Abstract
Differential image contrast (DIC), through the numerical managing and manipulation of complex wavefronts obtained by digital holography (DH), is investigated. We name the approach Dynamical Differential Holographic Image Contrast (DDHIC). DDHIC dispenses from special optics and/or complex setup configurations with moveable components, as usually occurs in classical DIC, that is not well-suited for investigating objects experiencing dynamic evolution during the measurement. In fact, the technique presented here, is useful for floating samples since it allows, from a single recording, to set a posteriori the best conditions for DIC imaging in conjunction with the numerical focusing feature of DH. By DDHIC, the movies can be easily built-up to offering dynamic representation of phase-contrast along all directions, thus improving the visualization. Furthermore, the dynamic representation is useful for making the proper choice of other key parameters of DIC such as the amount of shear and the bias, with the aim to optimize the visualized phase-contrast imaging as favorite representation for bio-scientists. Investigation is performed on various biological samples.
OCIS codes: (090.1995) Digital holography, (180.3170) Interference microscopy, (100.2980) Image enhancement
1. Introduction
Deep understanding of morphology, behavior and growth of cells and microorganisms is a key issue in biology and biomedical research fields. Low amplitude contrast presented by biological samples limits the information that can be retrieved performing optical bright-field microscope measurements. Optical transparency is overcame for fixed specimen by means of staining techniques but they have the drawback to be invasive and not applicable on live cells. Study of microorganism in their natural environment without perturbing their equilibrium has became of great interest in microscopy. When light passes thorough biological samples a little change in amplitude is due to their low absorption properties that is not sufficient to distinguish cellular and sub-cellular morphologies. The main effect on light propagating in such objects is in phase, indeed it is altered respect to the phase of the beam propagating in the surrounding medium. This is known as phase-retardation or phase-shift. Phase contrast imaging (PCI), since its invention [1], has been a strong optical tool for visualizing, besides transparent and tiny object, lithographic patterns, fibers, glass fragments, fluids, etc. Objects are visible by PCI due to interferometric processes able to transform tiny phase variation in amplitude modulation so that any small differences in the beam optical path can be visualized. Many ways exist to obtain PC and, nowadays, optical phase microscopes are widely commercially available. DIC microscope is the most popular one because of the pseudo 3D imaging offered by a sort of shadowing effect. DIC converts specimen phase gradients into intensity differences to be detected by cameras or human eyes. Since the beginning, scientists in biology have been accustomed to look at DIC images and interpret them. Nowadays, recent progresses obtained in quantitative phase microscopy (QPM) [2,3] give the possibility to valuate maps related to the optical path length (OPL) of the objects under observation, rather than its derivative. However, the scientist familiarity with DIC maps is difficult to eradicate and, at qualitative level, spatial derivatives make phase gradients along some directions better visible, much more than QPM itself. In fact, the popular success of DIC in science is due to “spatial derivative” operation as it is able to enhance boundaries. The spatial derivative is responsible of the perceived shadowing effect. This is very well know in the field of classical image processing where appropriate kernels are adopted for performing spatial derivative with these aims. Actually, research in PCI field is basically divided in two branches: (i) direct recovering of the quantitative PCI map by interferometric and/or holographic methods [4–6] or (ii) QPM computation starting from classical DIC experimental analysis [7,8]. Several groups are still working on recovering quantitative information from DIC with the two following motivations. Firstly, DIC is attractive because it has clear advantages to get quantitative information by standard optical microscope. The second motivation lies in the fact that scientists can continue to use DIC analysis for their qualitative observation but, if needed, they can also have access and analyze information in quantitative manner. However, to obtain quantitative PCI information it is necessary to perform multiple acquisitions by changing the optical configuration, i.e. acting on the optical setup with mechanical movements [9]. A classical DIC microscope requires a polarizer, a prism (i.e. Wollaston or Senarmont) below the condenser, in order to split the incident light in two beams before entering the sample, and another prism above the objective to image the interference pattern. The major drawback in conventional DIC microscope is that the phase variations cannot be extracted from the light intensity emerging from the sample. Actually, standard DIC is a qualitative phase imaging technique because of the non-linear response to the optical path length (OPL) that does not allow sample mapping. Many efforts have been spent in last years to recover linear relationships between acquired DIC images and the OPL in transmission as well as in reflection DIC microscopy [9–15]. Besides these numerical implementation, quantitative DIC images can be obtained modifying the setup introducing additional optical elements along the beam path [16]. A further method, called dual-interference-channel quantitative-phase microscopy (DQPM), is based on a dual-channel interferometric setup that is able to simultaneously obtain two phase-shifted interferograms of the same sample [17,18]. In Ref. [19] authors introduce a modified Hartmann mask to perform a quadriwave lateral shearing to measure two gradients in two perpendicular directions. Ferraro et al. [20] combined the idea of Lateral Shear Interferometry (LSI) with digital holography (DH) in order to obtain quantitative information on the sample OPL. The method is appropriate in transmission as well as in reflection configuration and quantitative phase map are retrieved digitally by a single interferometric recording. Moreover, LSI together with DH allows the removing of the parabolic phase term due to the microscope objective.
In recent years, DH has been demonstrated to behave as a powerful tool in coherent microscopy thanks to its features such us high transversal and axial resolution, numerical aberration compensation [21] and focus flexibility [22]. The main characteristic is the possibility to discern between intensity and phase information performing quantitative mapping of the OPL [22]. The optical phase retardation introduced by transparent objects is directly mapped. Up to now, DH has been considered as an innovative and alternative approach in microscopy [23]. However, it is important to note that, even if the QPM furnishes complete quantitative information overwhelming the standard DIC, it is not the best visual phase-contrast representation. The dynamic range of the QPM phase-maps is such that small signatures in phase-objects are barely or not at all visible. On contrary the spatial derivative gives the possibility to enhance even the smallest details favoring their visualization and detectability. Recently, interesting devices have been developed to perform DIC image for in situ analysis on bio-chip [5,6,19,24]. However even if such devices allow to obtain either good contrast DIC and QPM in simpler way in respect to the method proposed here, it is important to underline that the intrinsic nature of such devices do not allow to optimize the parameters that instead depends on the optical parameters such as grating pitch, etc. that are fixed during the fabrication process and cannot be changed.
In this paper, the flexibility of DH is employed to perform quantitative PCI mapping as well as synthetic DIC imaging of biological sample. DH is a good candidate for complete specimen analysis in the framework of no invasive microscopy. The phase-contrast visualization is performed off-line, i.e. several holograms are recorded while the sample is moving or is altering its shape. During the recording time the observer doesn’t need to optimize the acquisition setup. The parameters for the best phase-contrast imaging are chosen in the numerical reconstruction step. For each recorded hologram it is possible to measure, at the same time, the DIC phase contrast along all directions in the transverse plane. Thanks to the actual technology of numerical reconstruction of DH and to the development of powerful computational capability of personal computer it is possible to elaborate great amount of data and display dynamical movies coming from the DH QPM phase-maps. Dynamic display of DIC phase-contrast images along all directions can enhance the visualization of all details of the object under investigation. In this way a novel concept of DIC in microscopy can be envisaged by using DH, we named here DDHIC (Dynamical Differential Holographic Image Contrast) where the numerical implementation of DIC images are obtained manipulating numerically the DH phase-maps. It is important to note that we use here a DH approach based on the processing of a sequence of single holograms (i.e., the object holograms) therefore it falls within the category of techniques that do not need double recording [20,21].
Up to now no systematic analysis and discussion can be found in literature on how to optimize a DIC visualization by manipulating complex wavefront or QPM from interferometric or holographic methods. Only few examples have been reported but no discussion on how to about DIC is reported [25]. Here we illustrate the novel concept of DDHIC, describing the procedure, to follow step by step with the aim to optimize the phase contrast demonstrating its valuable effect in visualizing static and dynamic biological samples.
2. Image recording
Two different biological samples are investigated in order to prove DDHIC, mouse cells and bovine spermatozoa. Preadipocyte 3T3-F442A mouse cell line are grown in the recommended culture medium and studied during the differentiation process. The bovine sperm cells were prepared by the institute “Lazzaro Spallanzani” after fixation in suspension of the seminal material with 0.2% glutaraldehyde solution in phosphate buffered saline (PBS) without calcium and magnesium (1:3 v/v). A drop with volume 6 μL has been deposed on a glass slide, and then, covered with a cover slip (20 mm × 20 mm). The cover slip has been linked to the glass slide by means of a strip of varnish.
The optical setup is a coherent microscope based on DH in Mach-Zehnder configuration interferometer as illustrated in Fig. 1 . The approach is made of two separated steps: hologram recording and numerical reconstruction of the complex wavefront transmitted by the specimen [20,21]. In microscope configuration the light coming from the specimen is collected by a microscope objective (20× magnification, 0.4 numerical aperture) and made to interfere with a reference beam. The interference pattern (digital hologram) is recorded by a charge coupled device (CCD) positioned at a certain distance from the image plane. The hologram is numerically back propagated to calculate both intensity and phase of the object wavefront in the image plane. The interferometer uses as light source a He-Ne laser emitting at . After leaving the specimen plane, the diffracted light is collected by the MO. The interference pattern between the object and reference beams is obtained by a second BS and acquired by the CCD camera. The resolution in the image plane, that is the Reconstruction Pixel (RP) size, , is limited by the physical dimensions of the CCD detector (pixels number, N and size, ) according to the following relation: where M is the MO magnification [22]. For the results presented here the MO is not used within its standard working distance so M is calculated by a test target and for the mouse cell sample and for bovine spermatozoa.
Fig. 1.
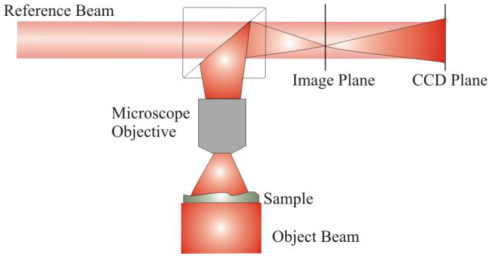
Schematic drawing of the optical setup employed to record holograms. During the acquisition time the optical elements are fixed. The best imaging conditions are evaluated in the further step: the numerical reconstruction of the sample images.
3. Image processing and results
The reconstruction algorithm is divided in two stages. The first one is the usual back propagation of the recorded holograms, the second one is devoted to generate DIC images. Common back propagation is based on the diffraction integral in the Fresnel approximation to calculate the complex wavefield in the image plane :
where is the hologram in the plane . The intensity and the phase for the optical beam transmitted by the sample are calculated from the previous equation:
In Fig. 2 for a bovine spermatozoa, and preadipocyte 3T3-F442A mouse cells are displayed. In this first pictures phase maps are obtained using the standard procedure of the double exposure, that is, object and reference holograms curvature are subtracted each other to compensate the optical aberration in the setup [26].
Fig. 2.
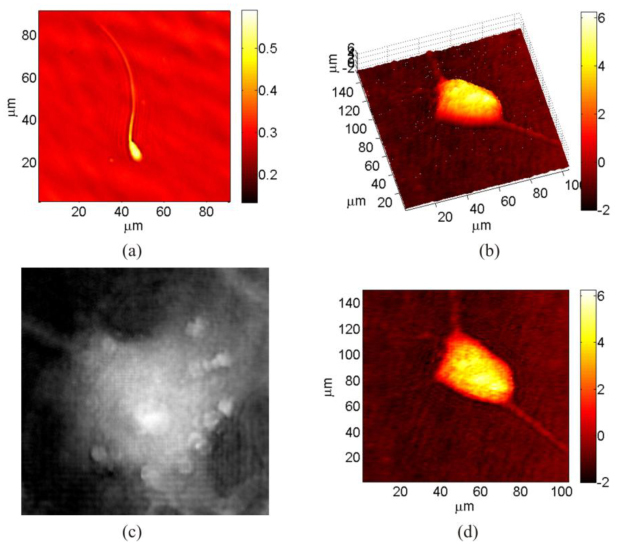
OPD computed starting from double exposure recording for (a) a bovine spermatozoa and (b), (c) and (d) preadipocyte 3T3-F442A mouse cells; (b) and (d) are, respectively, a pseudo 3D and 2D view of the same cell.
Double exposure method or, equally, LSI combined with DH are well suited and commonly used processes to retrieve quantitative information in DH [27]. Nevertheless QPMs in Fig. 2 present several difficulties for specimen visualization, for example, in Fig. 2(a) the end of the spermatozoa tail is not much visible due to low contrast and high dynamic range of the phase map. Moreover, in Figs. 2(b) and (c), due to the high OPD dynamic range, visibility of some details in more complex specimen is hindered thus avoiding careful recognition of internal structure and/or external filaments. DIC imaging method is much better than QPM to discriminate details of the tail as well as the head of the spermatozoa. In fact DIC allows to distinguish better phase gradients corresponding to particles presence or different density areas into mouse cells.
DIC imaging, in common optical microscope, depends strongly from several parameters as the direction along which the interfering wavefronts are shifted, the amount of the lateral shift and the bias retardation eventually introduced between them. DH allows controlling all these factors in a posteriori analysis of the complex wavefield. Here, DIC images are numerically obtained in the off-line analysis after the holograms recording has been performed. DIC images are recovered and optimized choosing the best values for the aforesaid parameters that are independent each others. Complex wavefield is processed to obtain DIC images of the sample in several directions after the shift quantity and the bias retardation have been chosen. For each direction a replica of is calculated digitally by numerical shifting it in the image plane (see Fig. 3 ). The sheared wavefront is subtracted to the original one to compute the difference phase image.
Fig. 3.
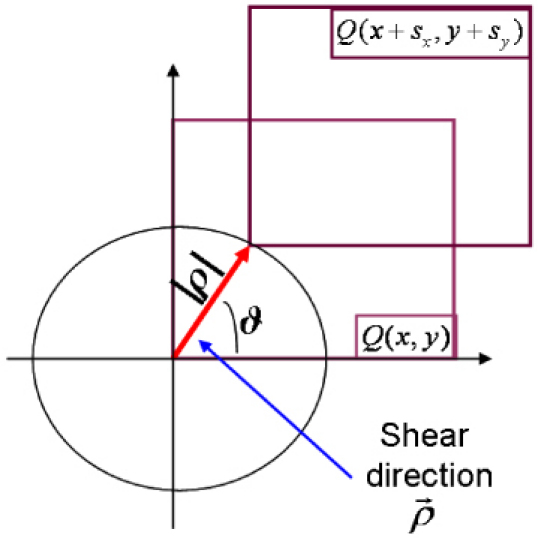
Schematic representation of the digital shearing along a chosen direction
As described in Ref. [20], if the defocus term is considered as the main contribution to the phase retardation and higher order aberrations are neglected, the calculated phase difference is given by
| (1) |
The shear quantities depend on the modulus of the vector and on the angle, ϑ, as in the following equations:
| (2) |
The equivalent DIC image is obtained by:
| (3) |
where is an arbitrary and constant phase factor [13].
A conceptual flow-chart of all steps for image reconstruction procedure is shown in Fig. 4 .
Fig. 4.
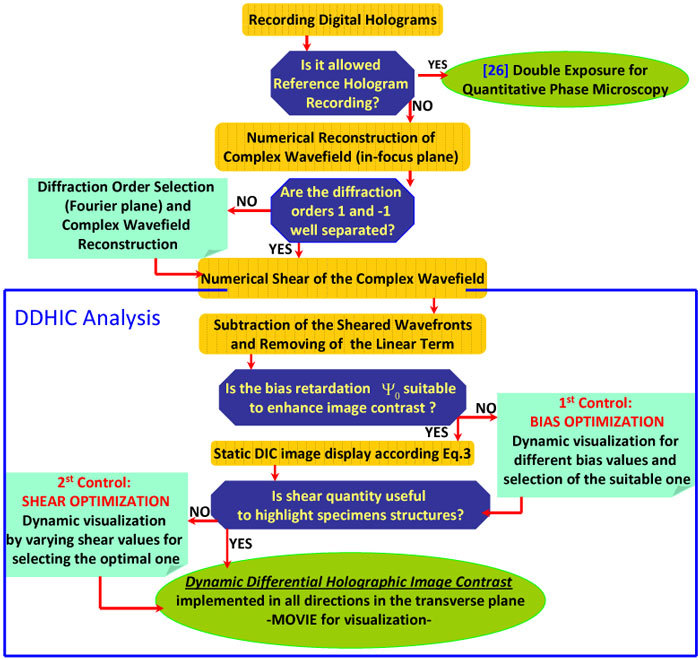
Flow chart for the linear DDHIC routine
In traditional DIC microscope the best values for the aforesaid parameters (i.e. shear, bias and direction) are chosen and remain fixed during the observation time. Each image of the specimen is recorded under specific settings of shift, bias and direction. The parameters are selected in situ and in real-time, through a subjective evaluation by the observer. Such parameters cannot be changed after the image has been recorded. The method proposed here, instead, allows to set them a posteriori avoiding to fix them in real-time. In this way, the best visualization condition can be found as post-processing step by manipulating the DH retrieved data. Furthermore a dynamic visualization can be displayable by fixing two parameters while one of the three is varying. In fact static DIC images with fixed parameters values could not be sufficient to discern all specimens details. Moreover, inside the same field of view, different regions of interest can have different phase variations that would require, for optimal visualization, a different parameters settings. Consequently, as it will be provided in the following paragraphs, dynamic visualization through DDHIC movies, can furnish a complete view of the sample allowing to detect all details and architecture of the phase-object under investigation. We tested the procedure on spermatozoa and mouse cells whose OPD was previously showed in Fig. 2 in order to compare the resulting analysis for standard DH and DDHIC. The complete procedure of the method is illustrated in the flow chart of Fig. 4. Dynamic visualization provided from the first and second movies allow to optimize amount of shear and bias while the final dynamical PC-imaging is provided by varying the direction. Dynamic bias variation, shear quantities and shear direction will be showed.
3.1 Setting of shear pixels number
Linear DDHIC image processing is performed on bovine sperm and mouse cells to prove the routine feasibility in all its steps. One of the parameters to be set is the shear quantity. In Fig. 5 DDHIC images obtained by Eq. (3) are displayed for different value of shear quantities and . Taking into account Eqs. (2), shear angle ϑ is kept constant at 30° while the modulus of vector is changed varying from 0.23μm to 1.38μm corresponding to a pixels variation from 1RP to 6RP. The phase factor is kept constant.
Fig. 5.
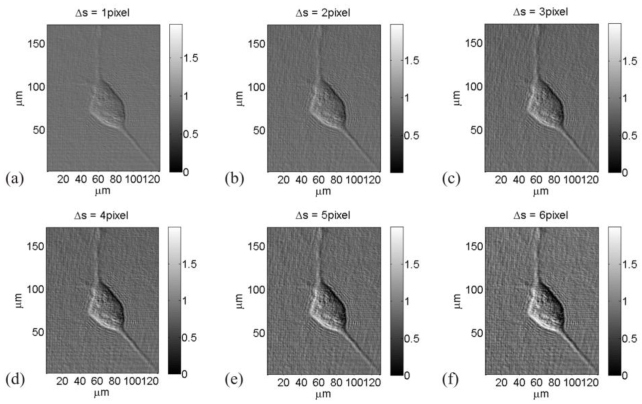
(a)-(f) DDHIC images of a mouse cell for different quantity of the shear pixels number changed from 1RP to 6RP (Media 1 (4MB, AVI) ).
Gradients in the optical path along the selected direction are better visible for higher values of the shear pixels number. Inside the cell perimeter a rising shadow-cast effect bestows a pseudo three-dimensional realism. Some structures in the cell are much more visible by increasing the shear. Nevertheless, for rising shift values the noise around the cell grows up too. Moreover, even if the contrast inside is improved, augmenting the shear there is, of course, a reduction of the spatial resolution. A compromise between contrast visibility and noise level is desirable. On the other hand a single shear value is not the optimal parameter value for all phase variations in the sample. For example some structures are much more visible for high shear values. A movie for varying values is supplied.
3.2 Bias setting
Another parameter to be chosen is the bias retardation introduced to enhance the contrast between the specimen and the background. The cell investigated is a mouse cell whose QPM was displayed in Fig. 2(c). DDHIC images for different values of the bias are displayed in Figs. 6(a) –6(i), where the shear direction is kept fixed at 45° and the shear quantity, selected before, at 4RP. It is clear, by observing Fig. 6 that appropriate bias values allow to enhance, in correct way, the phase-contrast. In particular, phase values for the bias of 0.0 rad and 3.0 rad are the best choice. Also for this parameter a movie is provided showing the contrast variation as function of the bias. Eventually the choice can be evaluated automatically.
Fig. 6.
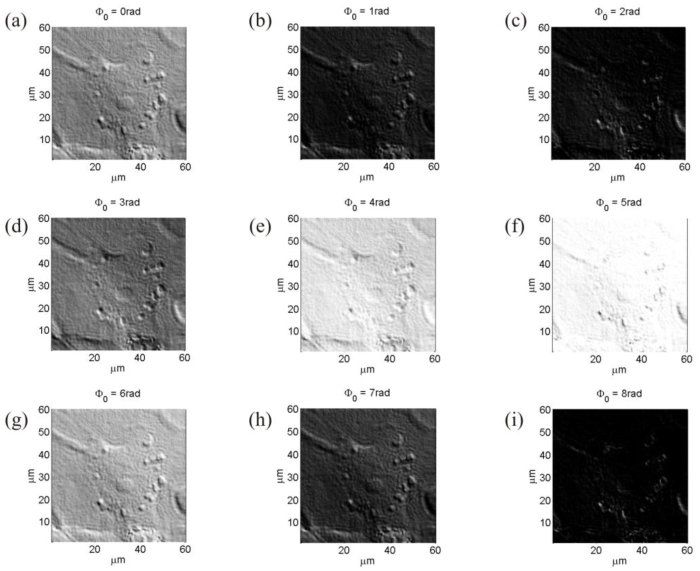
DDHIC images of a mouse cell for different bias retardation values. (a)-(i) the same mouse cell is displayed for bias values ranging from to with step of 1rad. (Media 2 (14.1MB, AVI) ).
3,3 Shear direction setting
As final step, for a complete visualization of the sample, a DDHIC routine is implemented with aim to build-up a movie with dynamic DIC along all directions. In fact differences in the light optical path are dependent on the direction of the shear and consequently diverse phase gradients are detectable for each different shear direction. DDHIC is accomplished in fast and effective way by applying the routine just modifying one parameter, the shear angle ϑ (Fig. 3). Images of the mouse cell for different shear directions are reported in Fig. 7 , Shear quantity is fixed at and bias at . Red arrows indicate the shear directions while green arrows point-out various cell structures that are visible or not depending from the direction of shear. It is clear that all the structures are visible only if a dynamic phase contrast along all direction is provided to the observer. DDHIC furnish optimal dynamic visualization that allows to detect all structures (see Media 3 (8.1MB, AVI) )
Fig. 7.
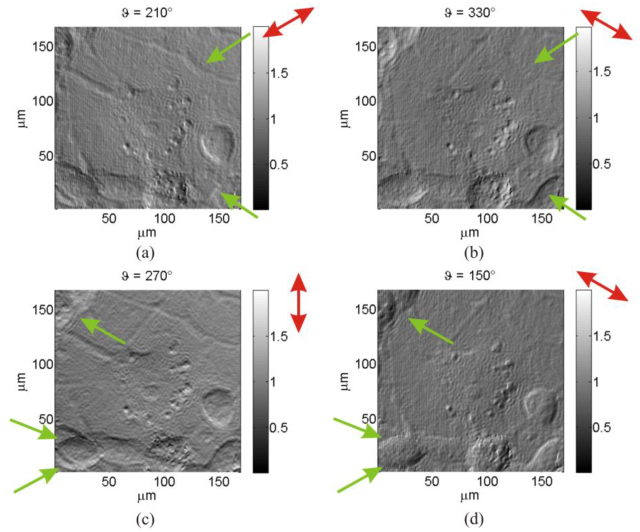
DDHIC images of a mouse cell for different direction of shear; in particular for (a), (b), (c) and (d). (Media 3 (8.1MB, AVI) ).
As further example, DDHIC is applied to another biological structure, a cow spermatozoa cell. The optimized shear value is kept constant and equal to 2RP corresponding to 364nm in the image plane while the bias is fixed at. Shear angle (or direction) is changed and resulting images are showed in Fig. 8 . The shear angles range is 360° with step of 30°C. From the picture is clear that, depending on ϑ, different specimen details and regions are enhanced. For example, at angles and the last portion of the tail is better contrasted and visible in respect to that of the QPM obtained by DH shown in Fig. 2(a).
Fig. 8.
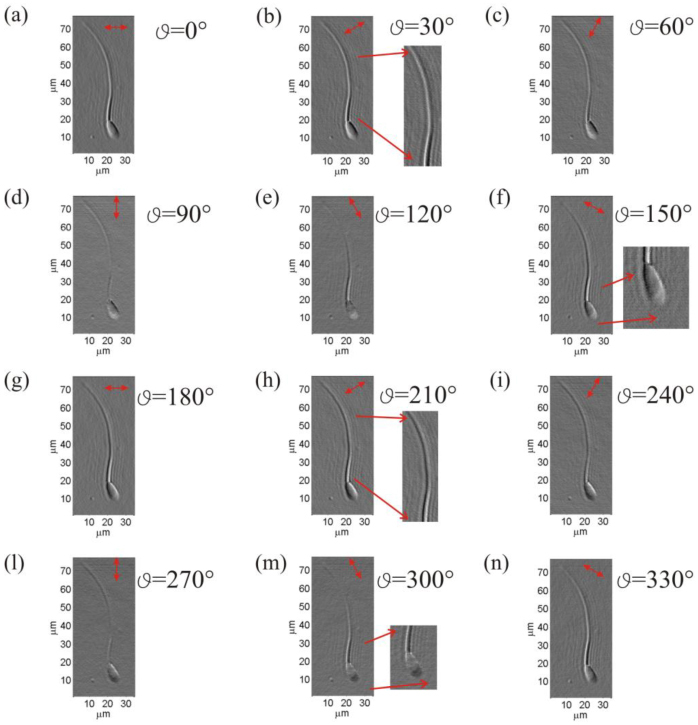
DDHIC images in different shear direction of a sperm cell; (a)-(n) the same spermatozoa is displayed for shear angle values ranging from to with step of 30°. (Media 4 (312.5KB, MOV) ).
Furthermore for angles and it is possible to recognize the separation between the acrosome and postacrosom regions of spermatozoa cell while the high dynamic range of the QPM in Fig. 2(a) does not allow to distinguish it.
The advantage offered by DDHIC stands in the possibility to obtain DIC along any direction “a posteriori” even if the object is fast moving or experience changes during the observation time. In fact in such cases it is not possible to operate rapidly mechanical movement to optimize the three parameters for a good and effective high contrast observation: amount of shear bias retardation and shear direction. DH allows to record dynamically the sequence of digital hologram during the observation time and if needed the focus can also be adjusted a posteriori too. Moreover shear and bias can be adjusted during the numerical reconstruction to obtain the highest obtainable contrast.
Furthermore, the possibility to visualize dynamically the DIC of object by changing continuously the shearing direction offers one more advantage in visualizing better the various details for the observer.
3,4 Time dependent DDHIC and QPM
An evaluation of the difference between traditional DH phase image and DDHIC visualization is reported for a sample whose position is time dependent. Preadipocyte mouse cell during differentiation is the sample investigated. Hundred of holograms are recorded to detect cell displacement and modification. Several of them are selected and processed to investigate specimen temporal behavior. Movies are realized to study cell morphology alteration through DDHIC as well as QPM to furnish a complete a-posteriori specimen analysis. A Movie related to Fig. 9 is made of four sub-movies. Two displays the QPM in 2D and pseudo 3D representation while the others two show DDHIC images for two perpendicular shear directions, respectively. In Fig. 9 two frames of that movie are shown at two different instants of time. Red circles indicate some elements inside cell perimeter observable in DDHIC configuration but not visible in the QPM. High OPD range hinder the visualization of such details that are completely unnoticeable from the OPD image but turn out discernible in DDHIC images.
Fig. 9.
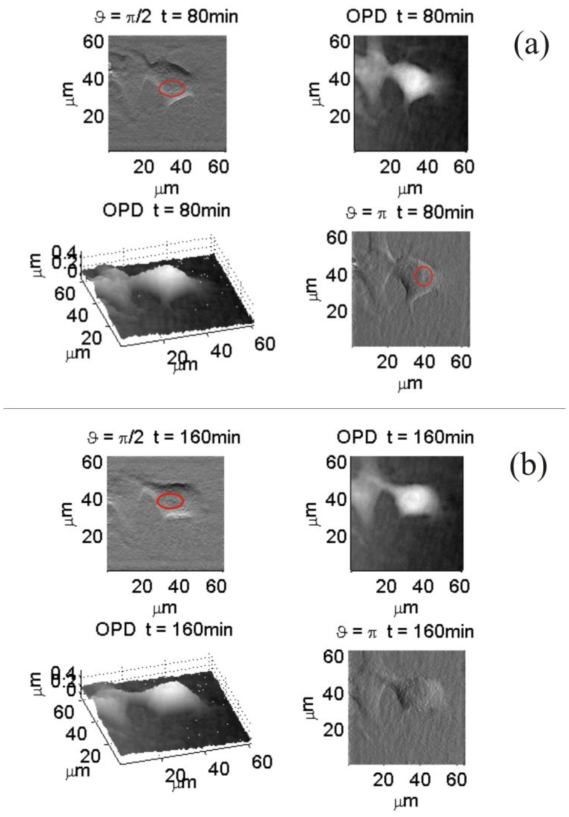
Sample modification tracking realized by QPM and DDHIC methods; (a) is made of four sub-figures correspondent to the istant of time : two images display DDHIC for different shear angles ϑ while the other two are the quantitative phase distributions in 2D and pseudo-3D visualizations; (b) shows the same sub-figures of (a) corresponding to the istant of time (Media 5 (7.4MB, AVI) ).
Figure 9 is a clear example of the usefulness of the post processing procedure because different details are visible for different shear directions and, in case of floating object, such choice can be realized only after image recording. Thanks to the parameters control obtainable by DH features the observer has a wide-ranging statement of cell structure even when it is moving.
4. Conclusions
DH is a label free and not invasive investigation instrument able to perform quantitative and qualitative mapping of biological specimens. Depending on the sample and the investigation to be performed, DH allows to visualize DIC image in all the directions in the sample plane by optimizing a posteriori the three key parameters for DIC visualization: amount of shear, shear direction and bias retardation. The possibility to control these parameters allows the improvement in visualization, as reported above. Suitable parameters value are chosen in order to enhance the phase contrast without losing resolution. Appropriate range of values for the shear pixels number is between 2RP and 4RP while the bias value is strongly dependent on the sample under investigation. Concerning the shear angle we found that the possibility to perform DIC in all directions and its dynamic visualization is the better solution to have a complete view of the specimen.
Moreover, the usefulness of the method has been proved on a swimming cell. When the sample change its position and structure the best way to catch its behavior is made of two steps: continuos and fast recording of digital holograms and accurate a posteriori processing. The drawback of traditional DIC stands in the real time setting of such parameters values. By DDHIC procedure this problem is overcame.
Acknowledgments
This work was supported in part by the Ministero delle Politiche Agricole e Forestali, project SESSIBOV 9106/7303/2009.
References and links
- 1.Zernike F., “Phase contrast, a new method for the microscopic observation of transparent object,” Physica 9(7), 686–698 (1942). 10.1016/S0031-8914(42)80035-X [DOI] [Google Scholar]
- 2.Kim M. K., “Principles and techniques of digital holographic microscopy,” SPIE Reviews 1(1), 018005 (2010). 10.1117/6.0000006 [DOI] [Google Scholar]
- 3.Arnison M. R., Larkin K. G., Sheppard C. J. R., Smith N. I., Cogswell C. J., “Linear phase imaging using differential interference contrast microscopy,” J. Microsc. 214(1), 7–12 (2004). 10.1111/j.0022-2720.2004.01293.x [DOI] [PubMed] [Google Scholar]
- 4.McIntyre T. J., Maurer C., Fassl S., Khan S., Bernet S., Ritsch-Marte M., “Quantitative SLM-based differential interference contrast imaging,” Opt. Express 18(13), 14063–14078 (2010). 10.1364/OE.18.014063 [DOI] [PubMed] [Google Scholar]
- 5.Oh C., Isikman S. O., Khademhosseinieh B., Ozcan A., “On-chip differential interference contrast microscopy using lensless digital holography,” Opt. Express 18(5), 4717–4726 (2010). 10.1364/OE.18.004717 [DOI] [PMC free article] [PubMed] [Google Scholar]
- 6.Fu D., Oh S., Choi W., Yamauchi T., Dorn A., Yaqoob Z., Dasari R. R., Feld M. S., “Quantitative DIC microscopy using an off-axis self-interference approach,” Opt. Lett. 35(14), 2370–2372 (2010). 10.1364/OL.35.002370 [DOI] [PMC free article] [PubMed] [Google Scholar]
- 7.Shribak M., LaFountain J., Biggs D., Inouè S., “Orientation-independent differential interference contrast microscopy and its combination with an orientation-independent polarization system,” J. Biomed. Opt. 13(1), 014011 (2008). 10.1117/1.2837406 [DOI] [PMC free article] [PubMed] [Google Scholar]
- 8.King S. V., Libertun A., Piestun R., Cogswell C. J., Preza C., “Quantitative phase microscopy through differential interference imaging,” J. Biomed. Opt. 13(2), 024020 (2008). 10.1117/1.2907328 [DOI] [PubMed] [Google Scholar]
- 9.Kou S. S., Waller L., Barbastathis G., Sheppard C. J., “Transport-of-intensity approach to differential interference contrast (TI-DIC) microscopy for quantitative phase imaging,” Opt. Lett. 35(3), 447–449 (2010). 10.1364/OL.35.000447 [DOI] [PubMed] [Google Scholar]
- 10.Van Munster E. B., van Vliet L. J., Aten J. A., “Reconstruction of optical pathlength distributions from images obtained by a wide-field differential interference contrast microscope,” J. Microsc. 188(2), 149–157 (1997). 10.1046/j.1365-2818.1997.2570815.x [DOI] [PubMed] [Google Scholar]
- 11.C. Preza and J. A. O’Sullivan, “Quantitative phase and amplitude imaging using differential-interference contrast (DIC) microscopy,” Proc. SPIE 7246, 724604 (2009). [Google Scholar]
- 12.Shribak M., Inoué S., “Orientation-independent differential interference contrast microscopy,” Appl. Opt. 45(3), 460–469 (2006). 10.1364/AO.45.000460 [DOI] [PubMed] [Google Scholar]
- 13.Franz G., Kross J., “Generation of two-dimensional surface profiles from differential interference contrast (DIC)-images,” Optik (Stuttg.) 112(8), 363–367 (2001). 10.1078/0030-4026-00063 [DOI] [Google Scholar]
- 14.Kouskousis B. P., Kitcher D. J., Collins S. F., Roberts A., Baxter G. W., “Quantitative phase and refractive index analysis of optical fibers using differential interference contrast microscopy,” Appl. Opt. 47, 5182–5189 (2007). 10.1364/AO.47.005182 [DOI] [PubMed] [Google Scholar]
- 15.Sun W., Wang G., Fang N., Yeung E. S., “Wavelength-dependent differential interference contrast microscopy: selectively imaging nanoparticle probes in live cells,” Anal. Chem. 81(22), 9203–9208 (2009). 10.1021/ac901623b [DOI] [PubMed] [Google Scholar]
- 16.Cui X., lew M., Yang C., “Quantitative differential interference contrast microscopy based on structured-aperture interference,” Appl. Phys. Lett. 93(9), 091113 (2008). 10.1063/1.2977870 [DOI] [Google Scholar]
- 17.Shaked N. T., Rinehart M. T., Wax A., “Dual-interference-channel quantitative-phase microscopy of live cell dynamics,” Opt. Lett. 34(6), 767–769 (2009). 10.1364/OL.34.000767 [DOI] [PMC free article] [PubMed] [Google Scholar]
- 18.Shaked N. T., Zhu Y., Rinehart M. T., Wax A., “Two-step-only phase-shifting interferometry with optimized detector bandwidth for microscopy of live cells,” Opt. Express 17(18), 15585–15591 (2009) 10.1364/OE.17.015585 [DOI] [PubMed] [Google Scholar]
- 19.Bon P., Maucort G., Wattellier B., Monneret S., “Quadriwave lateral shearing interferometry for quantitative phase microscopy of living cells,” Opt. Express 17(15), 13080–13094 (2009). 10.1364/OE.17.013080 [DOI] [PubMed] [Google Scholar]
- 20.Ferraro P., Alferi D., De Nicola S., De Petrocellis L., Finizio A., Pierattini G., “Quantitative phase-contrast microscopy by a lateral shear approach to digital holographic image reconstruction,” Opt. Lett. 31(10), 1405–1407 (2006). 10.1364/OL.31.001405 [DOI] [PubMed] [Google Scholar]
- 21.Miccio L., Alfieri D., Grilli S., Finizio A., De Petrocellis L., Nicola S. D., Ferraro P., “Direct full compensation of the aberrations in quantitative phase microscopy of thin objects by a single digital hologram,” Appl. Phys. Lett. 90(4), 041104 (2007). 10.1063/1.2432287 [DOI] [Google Scholar]
- 22.Grilli S., Ferraro P., De Nicola S., Finizio A., Pierattini G., Meucci R., “Whole optical wavefields reconstruction by digital holography,” Opt. Express 9(6), 294–302 (2001). 10.1364/OE.9.000294 [DOI] [PubMed] [Google Scholar]
- 23.Marquet P., Rappaz B., Magistretti P. J., Cuche E., Emery Y., Colomb T., Depeursinge C., “Digital holographic microscopy: a noninvasive contrast imaging technique allowing quantitative visualization of living cells with subwavelength axial accuracy,” Opt. Lett. 30(5), 468–470 (2005). 10.1364/OL.30.000468 [DOI] [PubMed] [Google Scholar]
- 24.Cui X., Ren J., Tearney G. J., Yang C., “Wavefront image sensor chip,” Opt. Express 18(16), 16685–16701 (2010). 10.1364/OE.18.016685 [DOI] [PMC free article] [PubMed] [Google Scholar]
- 25.Dubois F., Yourassowsky C., Monnom O., Legros J. C., Debeir O., Van Ham P., Kiss R., Decaestecker C., “Digital holographic microscopy for the three-dimensional dynamic analysis of in vitro cancer cell migration,” J. Biomed. Opt. 11(5), 054032 (2006). 10.1117/1.2357174 [DOI] [PubMed] [Google Scholar]
- 26.Ferraro P., De Nicola S., Finizio A., Coppola G., Grilli S., Magro C., Pierattini G., “Compensation of the inherent wave front curvature in digital holographic coherent microscopy for quantitative phase-contrast imaging,” Appl. Opt. 42(11), 1938–1946 (2003). 10.1364/AO.42.001938 [DOI] [PubMed] [Google Scholar]
- 27.Di Caprio G., Gioffrè M. A., Saffioti N., Grilli S., Ferraro P., Puglisi R., Balduzzi D., Galli A., Coppola G., “Quantitative label-free animal sperm imaging by means of digital holographic microscopy,” J. Sel. Top. Quantum 16(4), 833–840 (2010). 10.1109/JSTQE.2009.2036741 [DOI] [Google Scholar]


