Abstract
γ-Aminobutyric acid (GABA) is synthesized in brain by two isoforms of glutamic acid decarboxylase (Gad), Gad1 and Gad2. Gad1 provides most of the GABA in brain, but Gad2 can be rapidly activated in times of high GABA demand. Mice lacking Gad2 are viable whereas deletion of Gad1 is lethal. We produced null mutant mice for Gad2 on three different genetic backgrounds: predominantly C57BL/6J and one or two generations of backcrossing to 129S1/SvimJ (129N1, 129N2).We used these mice to determine if actions of alcohol are regulated by synthesis of GABA from this isoform. We also studied behavioral responses to a benzodiazepine (flurazepam) and a GABAA receptor agonist (gabaxadol). Deletion of Gad2 increased ethanol palatability and intake and slightly reduced the severity of ethanol-induced withdrawal, but these effects depended strongly on genetic background. Mutant mice on the 129N2 background showed the above three ethanol behavioral phenotypes, but the C57BL/6J inbred background did not show any of these phenotypes. Effects on ethanol consumption also depended on the test as the mutation did not alter consumption in limited access models. Deletion of Gad2 reduced the effect of flurazepam on motor incoordination and increased the effect of extrasynaptic GABAA receptor agonist gabaxadol without changing the duration of loss of righting reflex produced by these drugs. These results are consistent with earlier proposals that deletion of Gad2 (on 129N2 background) reduces synaptic GABA but also suggest changes in extrasynaptic receptor function.
Keywords: Alcohol intake, gabaxadol, Gad2, knockout mice, palatability, withdrawal
INTRODUCTION
γ-Aminobutyric acid (GABA), the major inhibitory neurotransmitter of the mammalian brain, is involved in diverse neural functions ranging from development and neural plasticity to the control of motor behavior and emotions (Obata 1977; Olsen & Sieghart 2009). Specificity of GABA functions in the brain is achieved, in part, through structural and neurochemical heterogeneity of GABA neurons and a variety of GABA receptors (for review see Olsen & Sieghart 2009). GABA is synthesized by two isoforms of glutamic acid decarboxylase, Gad2 (Gad65) and Gad1 (Gad67) (Erlander et al. 1991). The two isoforms, which are co-expressed in GABAergic neurons, differ with respect to cofactor association and subcellular distribution (for review see Soghomonian & Martin 1998; Sheikh, Martin & Martin 1999). Gad1 is found mainly in the cell body, tightly associated with the cofactor pyridoxal 5′-phosphate, whereas Gad2 is associated mainly with nerve termini, reversibly anchored to the membranes of synaptic vesicles (Christgau et al. 1991 1992; Reetz et al. 1991). Thus, it has been suggested that Gad1 is responsible for the maintenance of basal GABA levels, whereas Gad2 can be rapidly activated in times of high GABA demand (Martin et al. 1991).
Distinct roles for the two isoforms are further suggested by the comparison of behavioral phenotypes of Gad2-deficient and Gad1-deficient mice. Two groups independently constructed Gad2 knockout mice, and both lines of mutants appeared healthy and exhibited no obvious morphological abnormalities (Asada et al. 1996; Kash et al. 1997). Brains of Gad2 null mice exhibited a 50% decrease in cofactor-inducible Gad enzymatic activity (Kash et al. 1997). The levels of GABA were first reported to be normal in several brain regions (Asada et al. 1996; Kash et al. 1997), but later work reported decreased GABA content in the amygdala and hypothalamus (Obata et al. 1999; Stork et al. 2000). This phenotype is in sharp contrast to Gad1-deficient mice, which exhibit perinatal lethality (Asada et al. 1997; Condie et al. 1997). Brains of newborn Gad1 null mice have only 7% of wild-type levels of GABA at birth, consistent with an inability of the Gad2 protein alone to produce sufficient GABA for survival. In addition to the expected hypoGABAergic phenotype, Gad2-deficient mice exhibited increased anxiety-like behavior in open field and elevated zero maze tests (Kash et al. 1999). Gad2 knockout mice demonstrated an increase in spontaneous seizures (Kash et al. 1997) and were more sensitive to picrotoxin- and pentylenetetrazol-induced seizures (Asada et al. 1996). Mice lacking Gad2 displayed normal specific freezing response to the conditioned cue but showed lower levels of freezing and higher motor activity during conditioned fear retrieval than their wild-type littermates (Stork et al. 2003). Kash et al. (1999) suggested that many of the phenotypes are caused by an impairment of stress-induced GABA release in the mutant mice. Although Gad2 knockout mice displayed normal baseline and habituated startle responses, they showed dramatic deficits in prepulse inhibition (Heldt, Green & Ressler 2004).
A number of behavioral effects of ethanol have been attributed to actions at the GABAA receptor (for reviews see Mehta & Ticku 1999; Chester & Cunningham 2002; Enoch 2008). Numerous studies with mice lacking different subunits of GABAA receptors support a role for the GABA receptor system in multiple effects of ethanol (for review see Boehm et al., 2004b, 2006). However, it is not clear which GABAergic effects of alcohol are due to pre-or postsynaptic changes as ethanol can increase the release of GABA at some synapses (for review see Weiner & Valenzuela 2006; Mameli et al. 2008). To assess the importance of GABA release in the behavioral actions of alcohol, we tested a range of ethanol-related behaviors in mice lacking Gad2, the isoform associated with synaptic vesicles in nerve terminals. Because it was suggested that these mice may show deficits in stress-induced GABA release (Kash et al. 1999), we asked if they might show reduced response to alcohol. To answer this question, we studied several different ethanol-related behaviors in mice lacking the Gad2 isoform. The effect of a null mutation on behavioral phenotypes such as alcohol consumption often depends on the genetic background of the mutant mouse (Crabbe et al. 2006). To determine if effects of Gad2 deletion were influenced by background, we tested the mutation in three different lines of mice with varying amounts of C57BL/6J and 129S1/SvimJ background. One of the most prominent alcohol phenotypes was increased preference, but all phenotypes were dependent upon the genetic background.
MATERIALS AND METHODS
Animals
Null Gad2 (−/−) allele mice were created using homologous recombination (Kash et al. 1997) and were backcrossed on C57BL/6J for four generations. Breeding pairs of Gad2 (−/−) mice on a predominantly C57BL/6J genetic background were purchased from The Jackson Laboratories (Bar Harbor, ME, USA). They were backcrossed two times to 129/SvJ inbred mice, because 129S1/SvimJ embryonic stem cells were used for generation of these knockout mice and heterozygous mice from generations N1 and N2 were used to establish three experimental colonies. All behavioral analyses were performed on homozygous knockout (−/−) and wild-type (+/+) littermates generated from crosses between heterozygous animals from three colonies with different genetic backgrounds: C57BL/6J (B6); C57BL/6J × 129S1/SvimJ (129N1); and C57BL/6J × 129S1/SvimJ (129N2). Note that the ‘B6’ background is not completely inbred and only represent four generations of backcrossing. Mice were group-housed three-five per cage based on sex. Food and water were available ad libitum. The vivarium was maintained on a 12 : 12 hour light/dark cycle with lights on at 7.00 a.m. The temperature and humidity of the room were kept constant. All experiments were performed during the light phase of the light/dark cycle. Male mice were used for all studies and were 10–16 weeks of age at the time of analysis; within each experiment all mice were of similar age. All experiments were conducted in the isolated behavioral testing rooms in the animal facility to avoid external distractions. All experiments were approved by the Institutional Animal Care and Use Committee.
Alcohol preference drinking, 24-hour access
The two-bottle choice protocol was carried out as previously described (Blednov et al. 2006). Briefly, mice were allowed to acclimate for 1 week to individual housing. Two drinking tubes were continuously available to each mouse, and tubes were weighed daily. One tube always contained water. Food was available ad libitum, and mice were weighed every 4 days. After 4 days of water consumption (both tubes), mice were offered 3% ethanol (v/v) versus water for 4 days. Tube positions were changed daily to control for position preferences. Quantity of ethanol consumed (g/kg body weight/24 hours) was calculated for each mouse, and these values were averaged for every concentration of ethanol. Immediately following 3% ethanol, a choice between 6% (v/v) ethanol and water was offered for 4 days, then 9% (v/v) ethanol for 4 days, then 12% (v/v) ethanol for 4 days and finally, 15% (v/v) ethanol for 4 days. Throughout the experiment, evaporation/spillage estimates were calculated daily from two bottles placed in an empty cage, one containing water and the other containing the appropriate ethanol solution.
Preference for non-alcohol tastants, 24-hour access
Wild-type or knockout mice were also tested for saccharin and quinine consumption. One tube always contained water, and the other contained the tastant solution. Mice were serially offered saccharin (0.033% and 0.066%) and quinine hemisulfate (0.03 mM and 0.06 mM), and intakes were calculated. Each concentration was offered for 4 days, with bottle position changed daily. For each tastant, the low concentration was always presented first, followed by the higher concentration. Between tastant testing, mice had access to two bottles with water for 2 weeks.
Ethanol drinking—Scheduled High Alcohol Consumption model with limited fluid access
An ethanol (5% solution) acceptance method using scheduled, restricted fluid access was recently found to produce high and stable ethanol intake in B6 and genetically heterogeneous mice (Finn et al. 2005). Briefly, individually-housed mice were given one bottle with tap water ad libitum for 2 days to accustom them to the sipper tube. At 5 p.m. on the second day of individual housing, the water tube was removed, which began the period of fluid restriction. On each subsequent day, mice had access to the water tube for a designated period. Initially, mice had access to fluid for 4 hours per day for 6 days. Beginning on day 7, the period of fluid access was increased by 2 hours, and then further increased by 2 hours after day 14 (i.e. 4 hours fluid/day for days 1–6, 6 hours fluid/day for days 7–14 and 8 hours fluid/day for days 15–22). Every third day, mice had access to a 5% ethanol solution in tap water for 30 minutes, followed by their designated access to water to complete the access period. Thus, mice received 8 sessions with the ethanol solution. Experiments were started at 9.00 a.m. (2 hours after lights on).
Ethanol drinking—limited access in the dark phase (drinking in the dark with one bottle)
Another approach for consumption of ethanol (15% solution) under conditions of limited access was recently described that achieves pharmacologically significant levels of ethanol drinking (Rhodes et al. 2005). Briefly, starting at 3 hours after lights off, the water bottles were replaced with a bottle containing a 15% ethanol solution. The ethanol bottle remained in place for either 2 (first 3 days) or 4 hours (day 4) and then was replaced with the water bottles. Other than this short period of time of ethanol drinking, mice had unlimited access to water. This procedure was repeated for four consecutive days. The ethanol bottles were weighed before placing and after removal of the bottles from each experimental cage.
Ethanol drinking—limited access in the dark phase (drinking in the dark with two bottles)
This was similar to the one-bottle drinking in the dark test described earlier except that two bottles containing 15% ethanol or water were placed in the cage (Blednov & Harris 2008). The ethanol and water bottles remained in place for 3 hours. After their removal, mice had unlimited access to one bottle of water. The positions of bottles during 3 hours access were changed daily to avoid potential side preference. The ethanol and water bottles were weighed before placing and after removal of the bottles from each experimental cage.
Saccharin and sucrose consumption—limited access
In our experiments, mice were acclimated for 1 week to individual housing with free access to food and water. To initiate the first approach to the drinking tube after acclimation, water was removed from the cage daily at 8:00 a.m. (1 hours after lights on), and water intake was measured for 4 hours (from 11:00 a.m. until 3:00 p.m.). From 3:00 p.m. until 8:00 a.m. the following day, mice had free access to water. Every bottle was weighed before and after each drinking session. The initial measurement of water intake was repeated for 4 days, and the mean of 4 hours water intake was taken as 100% of basal fluid intake. The same procedure was repeated followed by presentation of one bottle of saccharin (0.033% and 0.066%) or sucrose (2.5, 5.0 and 7.5%). Each concentration of tastant was presented for 3 days, and means from 3 days of intake were calculated from percent of basal water intake. Saccharin was used to distinguish between response to sweet taste and caloric consumption of sucrose.
Ethanol-induced acute withdrawal
Mice were scored for handling-induced convulsion (HIC) severity 30 minutes before and immediately before intraperitoneal (i.p.) ethanol administration. The two pre-drug baseline scores were averaged. A dose of 4 g/kg of ethanol in saline was injected i.p., and the HIC score was tested every hour until the HIC level reached baseline. Acute withdrawal was quantified as the area under the curve but above the pre-drug level (Crabbe, Merrill & Belknap 1991). Briefly, each mouse is picked up gently by the tail and, if necessary, gently rotated 180°, and the HIC is scored as follows: 5, tonic-clonic convulsion when lifted; 4, tonic convulsion when lifted; 3, tonic-clonic convulsion after a gentle spin; 2, no convulsion when lifted, but tonic convulsion elicited by a gentle spin; 1, facial grimace only after a gentle spin; and 0, no convulsion when lifted and after a gentle spin.
Conditioned taste aversion
Subjects were adapted to a water-restriction schedule (2 hours of water per day) over a 7-day period. At 48-hour intervals over the next 10 days (days 1, 3, 5, 7, 9 and 11), all mice received 1-hour access to a solution of saccharin (0.15% w/v sodium saccharin in tap water). Immediately after 1-hour access to saccharin, mice received injections of saline or ethanol (2.5 g/kg) (days 1, 3, 5, 7 and 9). All mice also received 30-minute access to tap water 5 hours after each saccharin access period to prevent dehydration (days 1, 3, 5, 7 and 9). On intervening days, mice had 2 hours of continuous access to water at standard times in the morning (days 2, 4, 6, 8 and 10).
Loss of Righting Reflex (LORR)
Sensitivity to ethanol was determined using the standard duration of LORR (sleep time) assay. Ethanol was diluted in 0.9% saline (20 % v/v) and administered in doses adjusted by injected volumes. Mice were injected with ethanol and when they became ataxic, they were placed in the supine position in V-shaped plastic troughs until they were able to right themselves three times within 30 seconds. Sleep time was defined as the time from being placed in the supine position until they regained their righting reflex. During all sleep time assays, room temperature was 22°C. Mice that failed to lose the righting reflex (misplaced injections) or had a sleep time greater than two standard deviations from the group mean were excluded from the analysis.
Rotarod
Mice were trained on a fixed speed rotarod (Economex; Columbus Instruments, Columbus, OH, USA); speed of rod, 5.0 rpm), and training was complete when mice were able to remain on the rotarod for 60 seconds. Every 15 minutes after injection of ethanol (2 g/kg i.p.), flurazepam (15 mg/kg and 35 mg/kg, i.p.) or gabaxadol (5 mg/kg and 10 mg/kg, i.p.) each mouse was placed back on the rotarod; and latency to fall was measured until the mouse was able to stay on the rotarod for 60 seconds.
Immunoblot analysis
Protein levels in various brain regions of Gad2 (−/−) knockout and wild-type mice (9–16 weeks of age) were compared using semi-quantitative Western blot analysis. Briefly, cerebellum, hippocampus and thalamus were dissected from frozen brains, and P2 membrane fractions were isolated (25 ug of each sample was analyzed). Cerebellar protein fractions were probed with a GABAA receptor anti-δ subunit antibody (Gad41-A; Alpha Diagnostic, San Antonio, TX, USA), hippocampal protein fractions were probed with a GABAA receptor anti-α5 subunit antibody (NB300-195; Novus Biologicals, Littleton, CO) and thalamic protein fractions were probed with a GABAA receptor anti-α4 subunit antibody NB300-194; Novus Biologicals, Littleton, CO, USA). All blots were re-probed with an anti-δ actin polyclonal antibody (ab8227-50; Abcam, Cambridge, MA, USA). The actin signal was used to normalize for loading differences. HRP-conjugated goat anti-rabbit antibody was used to detect the primary antibodies and was visualized by chemiluminescence (Western Lightning; Perkin Elmer Life and Analytical Sciences, Boston, MA, USA). Immunoreactive protein levels were compared by densitometric measurements of band intensities and analyzed using one-tailed unpaired Student’s t-test.
Drug injection
All injectable alcohol (Aaper Alcohol and Chemical, Shelbyville, KY, USA) solutions were made in saline (20%, v/v) and injected i.p. with a volume of 0.2 ml/10 g of body weight. Flurazepam hydrochloride (Sigma-Aldrich, St. Louis, MO, USA) and 4,5,6,7-tetrahydroisoxazolo(5,4-c)pyridin-3-ol (THIP hydrochloride or gabaxadol, Sigma-Aldrich) was dissolved in 0.9% saline and injected i.p. at a volume of 0.1 ml/10 g body weight.
Ethanol metabolism
Animals were given a single dose of ethanol (3.8 g/kg i.p.), and blood samples were taken from the retro-orbital sinus 30, 60, 120, 180 and 240 minutes after injection. Blood alcohol concentration values, expressed as mg ethanol per milliliter of blood, were determined spectrophotometrically by an enzyme assay (Lundquist 1959). Method is based on oxidation of ethanol by alcohol dehydrogenase with NAD and spectrophotometric measurement of production of NADH at 340 nM. Blood samples were precipitated with perchloric acid and centrifuged at 2000 rpm.
Statistical analysis
Data were reported as the mean ± standard error of the mean. The statistics software program GraphPad Prizm (Jandel Scientific, Costa Madre, CA, USA) was used throughout. Statistics for the analyses of data obtained in CTA experiments was performed using Statistica version 6 (StatSoft, Tulsa, OK, USA). To evaluate differences between groups, analysis of variance (two-way analysis of variance with Bonferroni post hoc analysis) and Student’s t-test were carried out. A chi-square test was used for comparison of frequencies of genotypes in our breeding colonies.
RESULTS
Comparison of ethanol-induced behaviors in Gad2 knockout mice on three different genetic backgrounds
Mouse production
Mice were produced by heterozygous breeding, allowing us to assess the number of wild-type and mutant mice in each litter. On the predominantly B6 background, the number of wild-type mice was 2.4 times higher than null mutants, and the ratios between the three genotypes were statistically different from expected (1:2:1), indicating impaired viability of the mutant mice (Table 1). Backcrossing for one (129N1) or two (129N2) generations with the 129 strain resulted in ratios of wild-type and null mice that were approximately 1:1, indicating normal viability of the mutant mice with these backgrounds (Table 1). However, on the 129N2 background the ratios between the genotypes were marginally different from 1:2:1 because of the ratio between wild-type and heterozygous mice, indicating better viability for heterozygous mutants on this particular background.
Table 1.
Production of male mice on three different genetic backgrounds. Number of animals indicates the number of mice in each group at age 30–60 days. Percent of total indicates the number of mice of each genotype expressed in percent of total number of mice. For calculation of ratio number of wild-type (+/+) animals were taken as 1.
| Gad2 (−/−) (B6) | Gad2 (−/−) (129N1) | Gad2 (−/−) (129N2) | ||||||||||
|---|---|---|---|---|---|---|---|---|---|---|---|---|
| Genotype | +/+ | +/− | −/− | Total | +/+ | +/− | −/− | Total | +/+ | +/− | −/− | Total |
| Number of animals | 38 | 84 | 16 | 138 | 42 | 90 | 35 | 167 | 23 | 79 | 28 | 130 |
| Percent of total | 27 | 61 | 12 | 25 | 54 | 21 | 18 | 61 | 21 | |||
| Ratio | 1 | 2.2 | 0.43 | 1 | 2.2 | 0.84 | 1 | 3.4 | 1.2 | |||
| Chi-square | 13.6 | 1.6 | 6.4 | |||||||||
| Degrees of freedom | 2 | 2 | 2 | |||||||||
| P value | 0.001 | 0.45 | 0.04 | |||||||||
The litter size was recorded at the time of weaning. Some offspring died after weaning, primarily from the ‘B6’ colony. These results show that survival rate of (−/−) mice on B6 background is reduced.
Ethanol consumption
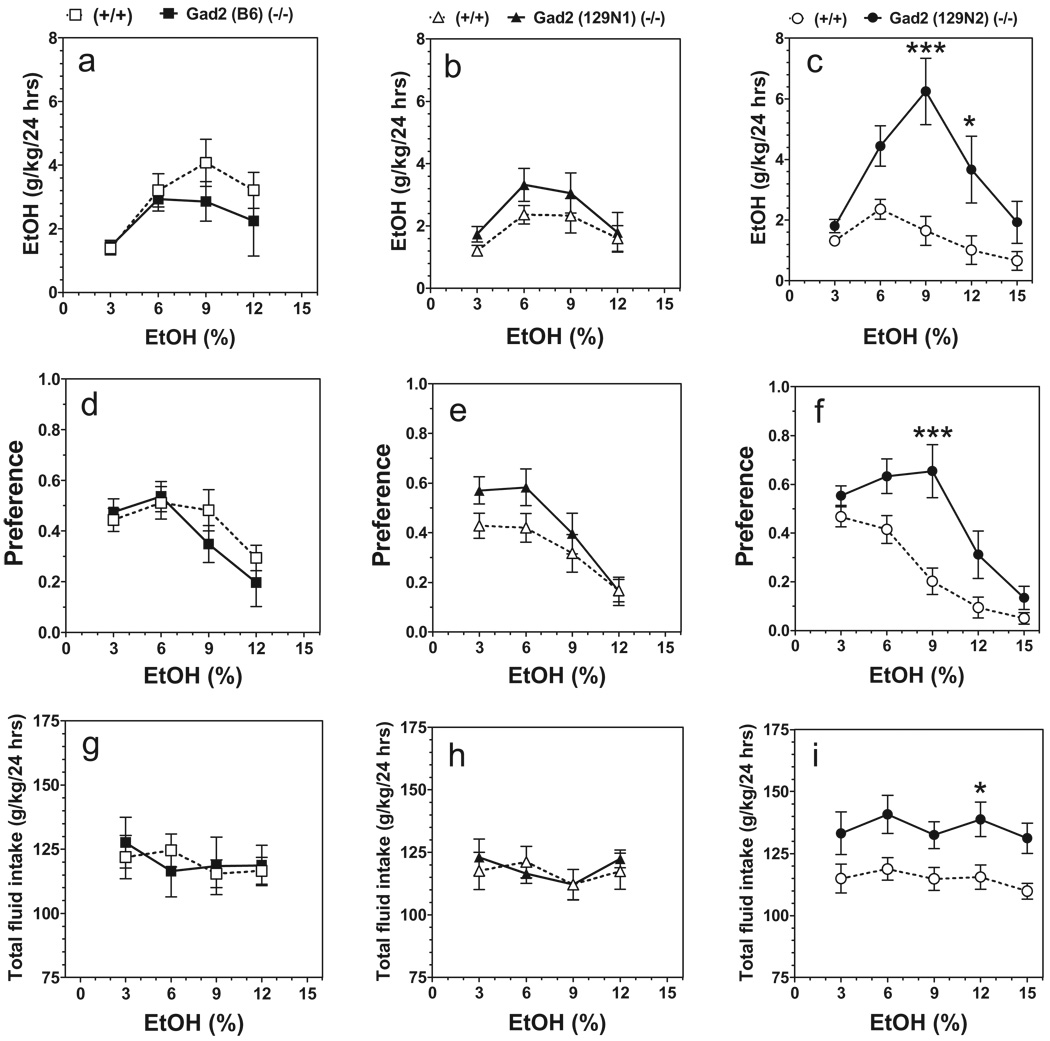
In a two-bottle free-choice paradigm in which mice could drink either water or an increasing series of ethanol concentrations, the amount of ethanol consumed by mutant male mice lacking Gad2 was larger than for wild type on the 129N2 genetic background only [F(1,90) = 30.35, P < 0.001, main effect of genotype; F(4,90) = 3.01, P < 0.05, genotype × concentration interaction] (Fig. 1c). The amount of ethanol consumed depended on ethanol concentration for mice on all three genetic backgrounds [F(3,86) = 3.93, P < 0.05, for B6 background; F(3,72) = 4.36; P < 0.01, for 129N1 background and F(4,90) = 6.49; P < 0.001, for 129N2 background] (Fig. 1a–c). Preference for ethanol was significantly increased in mutant mice on two genetic backgrounds—129N1 [F(1,72) = 4.55, P < 0.05, main effect of genotype] and 129N2 [F(1,90) = 27.61, P < 0.001, main effect of genotype; F(4,90) = 2.76, P < 0.05, genotype × concentration interaction] (Fig. 1e, f). Preference for ethanol depended on ethanol concentration for mice on all three genetic backgrounds and decreased at higher ethanol concentrations [F(3,86) = 5.26, P < 0.01, for B6 background; F(3,72) = 12.55; P < 0.001, for 129N1 background and F(3,90) = 18.51; P < 0.001, for 129N2 background] (Fig. 1d–f). Total fluid intake was significantly increased for null mice on the 129N2 genetic background only [F(1,90) = 29.44; P < 0.001, main effect of genotype] (Fig. 1i). Total fluid intake did not depend on concentration of ethanol for any of the three genetic backgrounds (Fig. 1g–i).
Figure 1.
Voluntary ethanol (EtOH) consumption in Gad2 (−/−) and wild-type mice on three genetic backgrounds (24 hours two-bottle choice paradigm). Data represent consumption and preference as a function of ethanol concentration. Ethanol consumption (g/kg/24 hours). (a) B6; (b) 129N1; (c) 129N2. Preference for ethanol. (d) B6; (e) 129N1; (f) 129N2.Total fluid intake (g/kg/24 hours). (g) B6; (h) 129N1; (i) 129N2 (B6: n = 8–16 per genotype. 129N1: n = 10 per genotype. 129N2: n = 10 per genotype). *P < 0.05; ***P < 0.001—significant difference relative to wild-type mice for same concentration of ethanol (Bonferroni post-test).Values represent mean ± standard error of the mean for 4 days of consumption
Preference for non-alcohol tastants
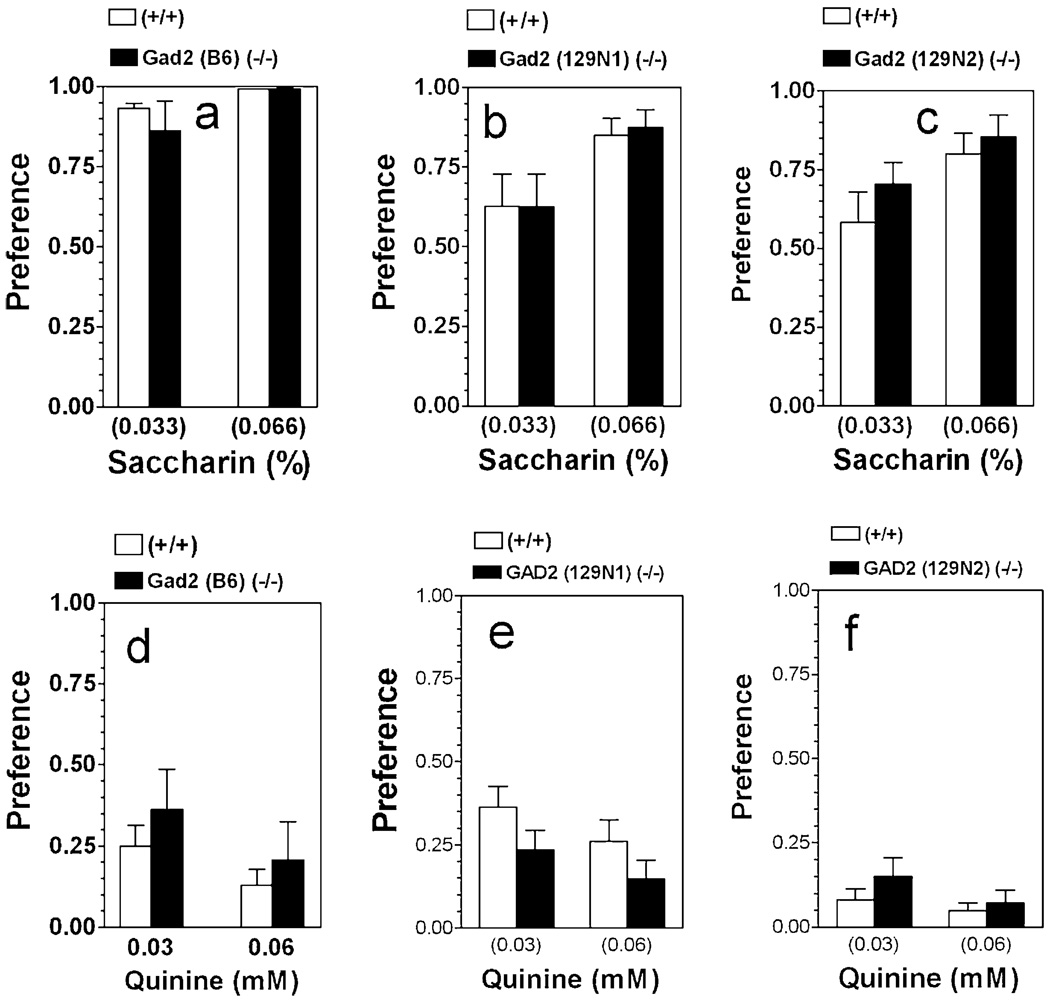
There was no difference between null and wild-type mice on any of the three genetic backgrounds in preference for saccharin in the 24 hours two-bottle choice test (Fig. 2a–c). Preference for saccharin depended on concentration for all three genetic backgrounds [F(1,16) = 6.28, P < 0.05, for B6 background; F(1,34) = 8.37; P < 0.01, for 129N1 background and F(1,34) = 5.98; P < 0.05, for 129N2 background].
Figure 2.
Saccharin and quinine consumption are not affected by deletion of Gad2 in any of the three genetic backgrounds. Data represent the relative preference for the different tastants with continuous access, two bottle choice test. Preference for saccharin: (a) Mice on B6 inbred background (n = 5 per genotype). (b) Mice on 129N1 genetic background (n = 9–10 per genotype). (c) Mice on 129N2 background (n = 9–10 per genotype). Preference for quinine: (d) Mice on B6 inbred background (n = 7–16 per genotype). (e) Mice on 129N1 background (n = 9–10 per genotype). (f) Mice on 129N2 genetic background (n = 10 per genotype). Values represent mean ± standard error of the mean
Neither main effects of genotype nor effects of concentration were seen for preference of quinine solutions in the three mouse colonies (Fig. 2d–f).
Saccharin and sucrose consumption in limited access procedure
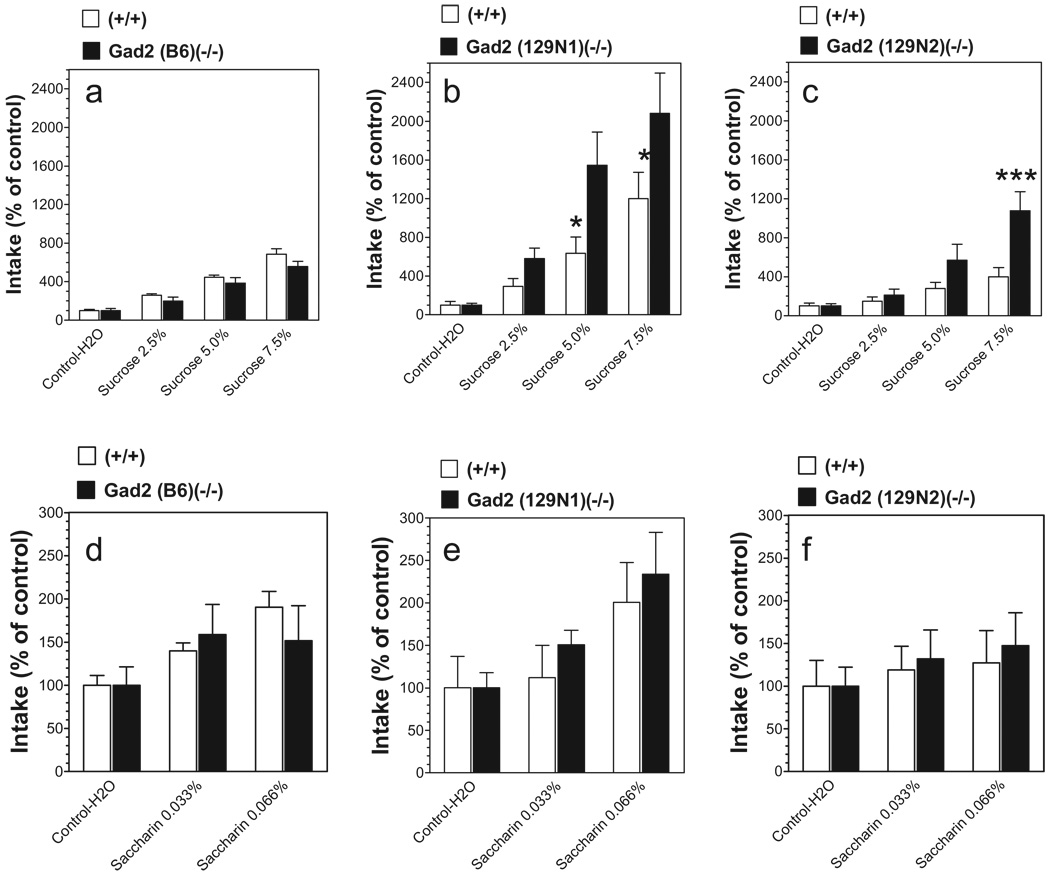
Consumption of water during a 4-hour access period varied slightly among the inbred B6 wild-type and mutant mice (B6 background: 10 ± 1 g/kg body weight and 17 ± 2 g/kg body weight for wild-type and null mice, respectively, P < 0.05 Student’s t-test; 129N1 background: 5.5 ± 1.8 g/kg body weight and 5.7 ± 1.6 g/kg body weight for wild-type and null mice, respectively; 129N2 background: 5.7 ± 1.1 g/kg body weight and 7.5 ± 1.1 g/kg body weight for wild-type and null mice, respectively). To correct for these differences in basal intake, intake of saccharin and sucrose was calculated as a percentage of the mean consumption of tastants by dividing the amount of saccharin and sucrose solution consumed on subsequent 4-hour sessions by the amount of water consumed during four basal 4-hour sessions. Sucrose produced a huge (20-fold) increase in fluid consumption, whereas saccharin produced only about a twofold increase (Fig. 3).
Figure 3.
Consumption of saccharin or sucrose solutions in Gad2 (−/−) and wild-type mice on three genetic backgrounds in a limited access test. Data represent intake of saccharin or sucrose as a percentage of the initial intake of water. Sucrose intake: (a) Mice on B6 inbred background (n = 7–13 per genotype). (b) Mice on 129N1 background (n = 5–7 per genotype). (c) Mice on 129N2 background (n = 7–8 per genotype). Saccharin intake: (d) Mice on B6 background (n = 7–13 per genotype). (e) Mice on 129N1 background (n = 5–7 per genotype). (f) Mice on 129N2 background (n = 7–8 per genotype). *P < 0.05; ***P < 0.001—significant difference relative to wild-type mice for same concentration of tastant (Bonferroni post-test).Values represent mean ± standard error of the mean
Null mice on B6 genetic background consumed slightly smaller amounts of sucrose than wild-type littermates [F(1,72) = 4.79; P < 0.05, main effect of genotype; F(3,72) = 65.68; P < 0.001, main effect of concentration] (Fig. 3a). In contrast, null mice on 129N1 and 129N2 genetic backgrounds consumed significantly higher amounts of sucrose than their wild-type littermates [129N1 background: F(1,40) = 11.75; P < 0.01, main effect of genotype; F(3,40) = 20.51; P < 0.001, main effect of concentration; 129N2 background: F(1,52) = 11.31; P < 0.01, main effect of genotype; F(3,52) = 14.13; P < 0.001, main effect of concentration; F(3,52) = 3.99; P < 0.05, genotype × concentration interaction) (Fig. 3b, c).
There were no differences in saccharin intake between null and wild-type male mice for any of three genetic backgrounds (Fig. 3d–f). Saccharin intake depended on concentration for two of three genetic backgrounds [F(2,54) = 5.84, P < 0.01 for B6; F(2,30) = 4.78, P < 0.05 for 129N1].
Acute ethanol withdrawal severity
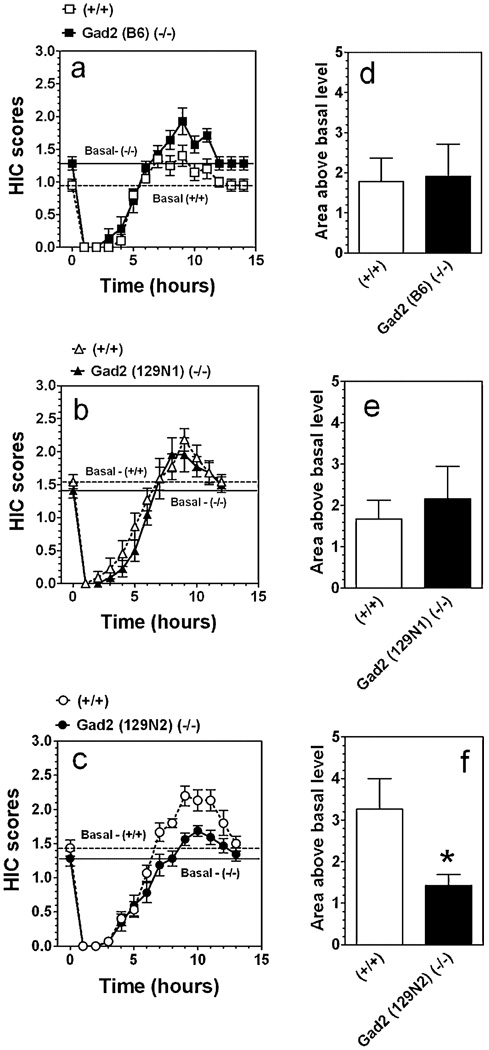
A single 4 g/kg ethanol dose suppressed basal HIC in both the knockout and wild-type mice of all genetic backgrounds for about 5 hours, followed by a small increase in HIC (Fig. 4a–c). There were no genotype differences in the area under the curves for HIC during withdrawal for male mice on B6 and 129N1 genetic backgrounds (P > 0.05, Student’s t-test) (Fig. 4d, e) but Gad2-deficient mice on 129N2 background showed a somewhat weaker withdrawal (P < 0.05, Student’s t-test) compared with their wild-type littermates (Fig. 4f).
Figure 4.
Severity of acute ethanol withdrawal was reduced in Gad2 (−/−) mice with 129N2 genetic background. Data represent the mean handling induced convulstion (HIC) score as a function of time after injection of ethanol (a–c). (a) Mice on B6 inbred background (n = 7–10 per genotype). (b) Mice on 129N1 background (n = 11 per genotype). (c) Mice on 129N2 background (n = 15–16 per genotype). (d–f) The integrated area of the HIC score over time above the basal level: (d) Mice on B6 inbred background. (e) Mice on 129N1 background. (f) Mice on 129N2 background. *P < 0.05—significant difference between wild-type and knockout mice (Student’s t-test).Values represent mean ± standard error of the mean
Conditioned taste aversion
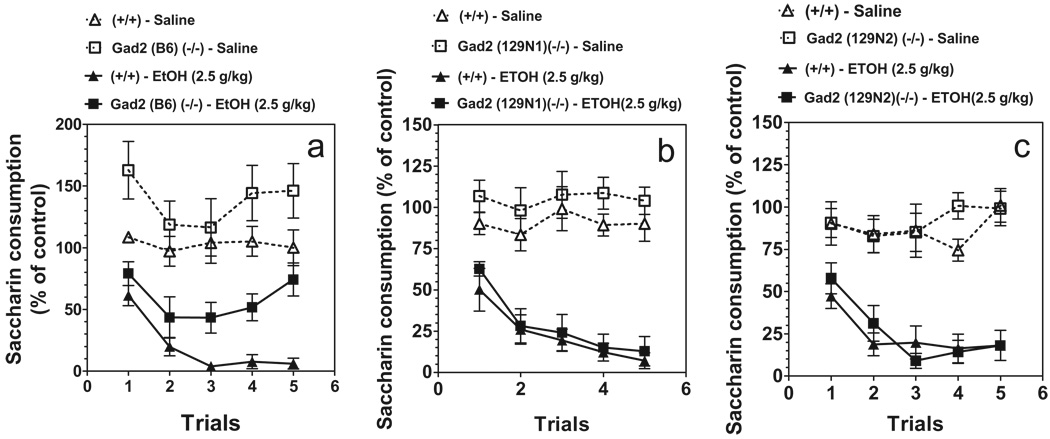
Consumption of saccharin during the 1-hour period varied slightly with genetic background in wild-type and mutant mice (B6 background: 50 ± 2 g/kg and 44 ± 6 g/kg body weight for wild-type and null mice, respectively; 129N1 background: 56 ± 3 g/kg and 58 ± 4 g/kg body weight for wild-type and null mice, respectively; 129N2 background: 58 ± 3 g/kg and 53 ± 2 g/kg body weight for wild-type and null mice, respectively). To correct for these initial differences in tastant intake, intake was calculated as a percentage of the trial 0 consumption for each subject by dividing the amount of saccharin solution consumed on subsequent conditioning trials by the amount of saccharin solution consumed on trial 0 (before conditioning). Figure 5 depicts saccharin intake (as a percentage of trial 0) for each genotype over the course of the five saccharin access periods. Ethanol produced trial-dependent reductions in saccharin intake over trials, indicating the development of conditioned taste aversion. Null mutant and wild-type mice on all three genetic backgrounds showed similar levels of conditioned aversion. Genotype × ethanol dose × trial analysis showed significant effects of ethanol dose [F(1,18) = 56.61; P < 0.001 for B6 background; F(1,22) = 74.23; P <0.001 for 129N1 background; F(1,25) = 59.63; P < 0.001 for 129N2 background], trial [F(4,72) = 9.92; P < 0.001 for B6 background; F(4,88) = 8.94; P < 0.001 for 129N1 background; F(4,100) = 8.61; P < 0.001 for 129N2 background] and ethanol dose × trial F(4,88) = 9.27; P < 0.001 for 129N1 background; F(4,100) = 8.35; P < 0.001 for 129N2 background]. Effects of genotype, genotype × ethanol dose, genotype × trial, and genotype × ethanol dose × trial were not significant for mice of the three genetic backgrounds. Only mice on the B6 background showed a significant effect of Gad2 deletion [F(1,18) = 11.52; P < 0.01].
Figure 5.
Ethanol-induced conditioned taste aversion is not affected by deletion of Gad2 in mice. Data represent the changes in saccharin consumption produced by injection of saline or ethanol. (a) Mice on B6 inbred background (n = 5–7 for saline injection for all genotypes; n = 5–7 for groups with ethanol injection). (b) Mice on 129N1 background (n = 5 for saline injection for all genotypes; n = 7–10 for groups with ethanol injection). (c) Mice on 129N2 background (n = 5 for saline injection for all genotypes; n = 9–10 for groups with ethanol injection).Values represent mean ± standard error of the mean
Depressant effects of ethanol
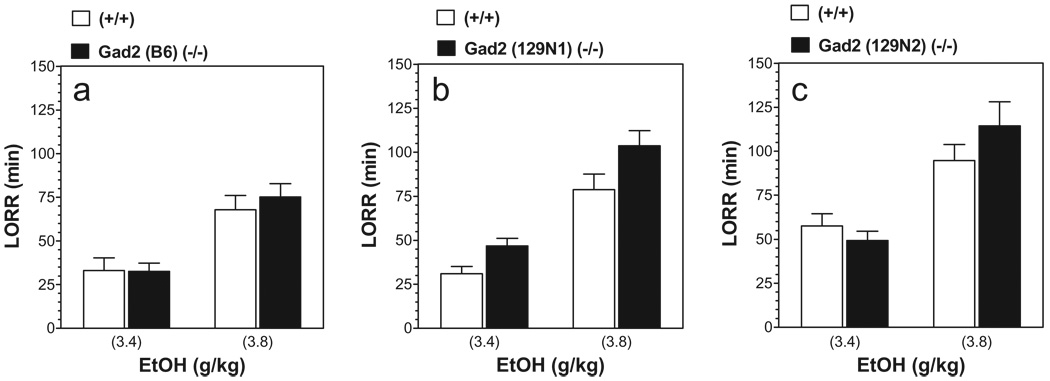
Ethanol-induced LORR demonstrated an effect of ethanol dose in all three genetic backgrounds [F(1,42) = 21.32; P < 0.001 for B6 genetic background; F(1,37) = 27.03; P < 0.001 for 129N1 genetic background; F(1,59) = 31.86; P < 0.001 for 129N2 genetic background] (Fig. 6). A marginally significant dependence on genotype was found for mice on 129N1 genetic background only [F(1,37) = 4.17; P < 0.05] (Fig. 6b). However, post hoc analyses did not support any difference between wild-type and knockout mice for the two doses of ethanol.
Figure 6.
Similar duration of ethanol-induced loss of righting reflex (LORR) in Gad2 (−/−) and wild-type mice. Data represent the duration of LORR in minutes following injection of ethanol (EtOH). (a) Mice on B6 inbred background (n = 7–16 per dose of ethanol and genotype). (b) Mice on 129N1 background (n = 6–15 per dose of ethanol and genotype). (c) Mice on 129N2 background (n = 15–16 per dose of ethanol and genotype).Values represent mean ± standard error of the mean
Additional ethanol behaviors: studies of Gad2-deficient mice on 129N2 background
Because the strongest ethanol behavioral phenotypes were obtained in Gad2-deficient mice on the 129N2 genetic background, we selected these mice for study of additional ethanol-induced behaviors.
Ethanol consumption in other tests for ethanol intake
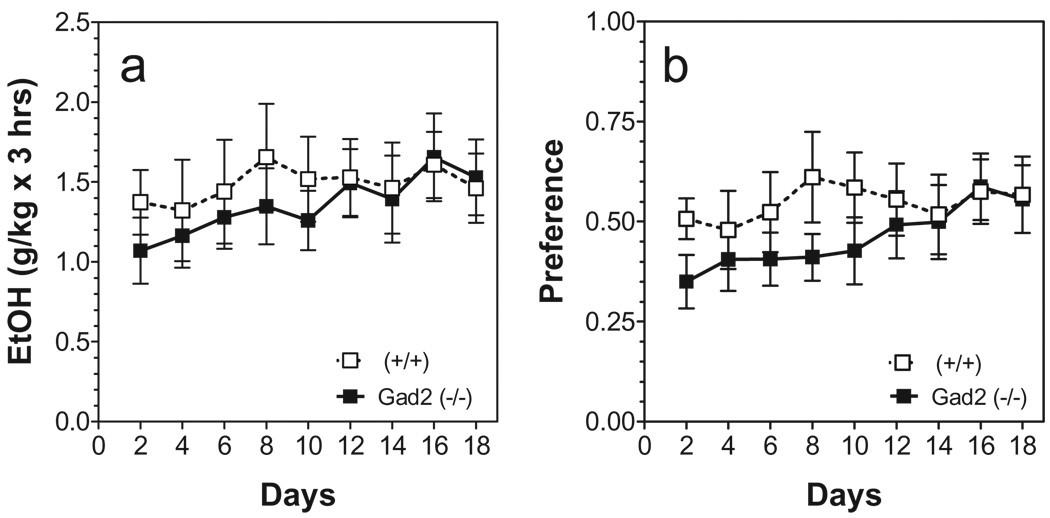
Neither genotype nor time dependence was a factor in the amount of alcohol consumed in the two-bottle drinking in the dark model (15% ethanol versus water) (Fig. 7a). Gad2-deficient mice consumed ethanol with slightly lower preference than wild-type littermates [F(1,162) = 4.73; P < 0.05] (Fig. 7b).
Figure 7.
Ethanol intake in a limited access (drinking in the dark with two bottles) model in Gad2 (−/−) and wild-type mice on the 129N2 background. (a) Amount of ethanol consumed given as g/kg/3 hours. (b) Preference for ethanol as a percent of fluid intake. (n = 10 per genotype). Values represent mean ± standard error of the mean
Limited access to a low concentration of ethanol (5%) with fluid deprivation (Scheduled High Alcohol Consumption model) showed no difference between knockout and wild-type mice in amount of ethanol consumed. However, Gad2-deficient mice consumed more water than their wild-type littermates [F(1,39) = 5.64, P < 0.05—effect of genotype; F(2,39) = 11.29, P < 0.001—effect of session] (data not shown).
Limited access to a high concentration of ethanol (15%) with no fluid deprivation (one-bottle drinking in the dark model) also did not show differences in ethanol consumption during 2- or 4-hour daily access on the last day of experiments (data not shown).
Motor-incoordination effect of ethanol
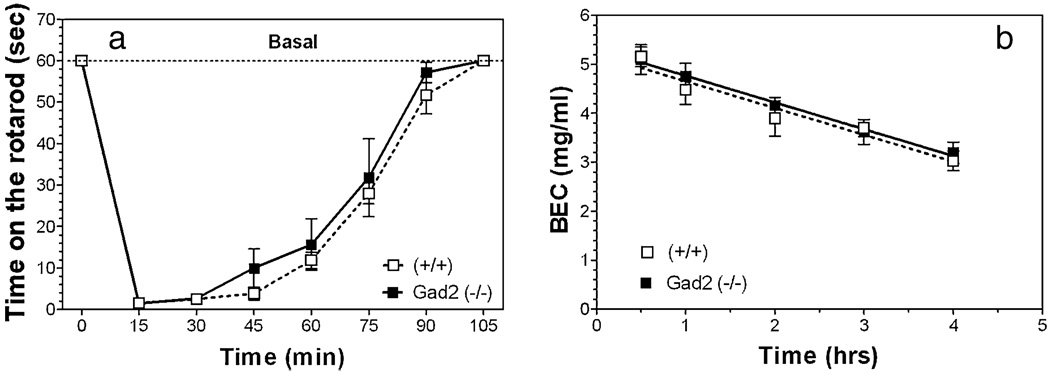
Acute administration of ethanol (2 g/kg) produces incoordination as measured by the rotarod test in wild-type as well as in Gad2 knockout mice (Fig. 8a). There were no differences between wild-type and Gad2-deficient mice in recovery from this motor incoordination [F(1,80) = 2.02; P > 0.05—dependence on genotype; F(7,80) = 115.31; P < 0.001 dependence on time].
Figure 8.
Motor incoordination (rotarod) and metabolism of ethanol are not altered by deletion of Gad2 in mice with the 129N2 background. (a) Time on the rotarod in seconds before and after motor incoordination induced by ethanol (2 g/kg) (n = 6 per genotype). (b) Metabolism of ethanol after 3.8 g/kg i.p. injection (n = 4 per genotype).Values represent mean ± standard error of the mean
Ethanol metabolism
There were no differences in metabolism of ethanol (3.8 g/kg i.p.) between wild and knockout mice (Fig. 8b). The slopes of the regression lines were −0.55 ± 0.09 and −0.55 ± 0.08 for wild-type and knockout mice, respectively.
Sensitivity of Gad2-deficient mice to pharmacological effects of flurazepam and gabaxadol
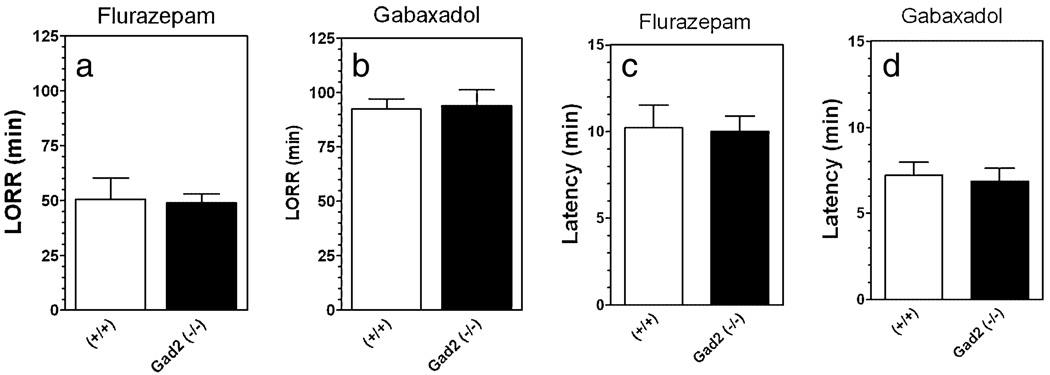
Some of the alcohol behaviors studied in null mutant mice were also tested using flurazepam and gabaxadol in mutant mice on the 129(N2) background. Flurazepam (225 mg/kg) or gabaxadol (55 mg/kg) induced prolonged LORR in wild-type as well as mutant mice. However, there were no differences between wild-type and mice lacking Gad2 in either duration of LORR (Fig. 9a, b) or latency for LORR (Fig. 9c, d).
Figure 9.
The duration of loss of righting reflex (LORR) produced by flurazepam or gabaxadol is not affected by deletion of Gad2 in mice with the 129N2 background. (a) Duration of LORR in minutes following injection of Flurazepam (225 mg/kg) (n = 9 per genotype). (b) Duration of LORR in minutes following injection of Gabaxadol (55 mg/kg) (n = 7–10 per genotype). (c) Latency in minutes following injection of flurazepam (225 mg/kg) (n = 9 per genotype). (d) Latency in minutes following injection of Gabaxadol (55 mg/kg) (n = 7–10 per genotype). Values represent mean ± standard error of the mean
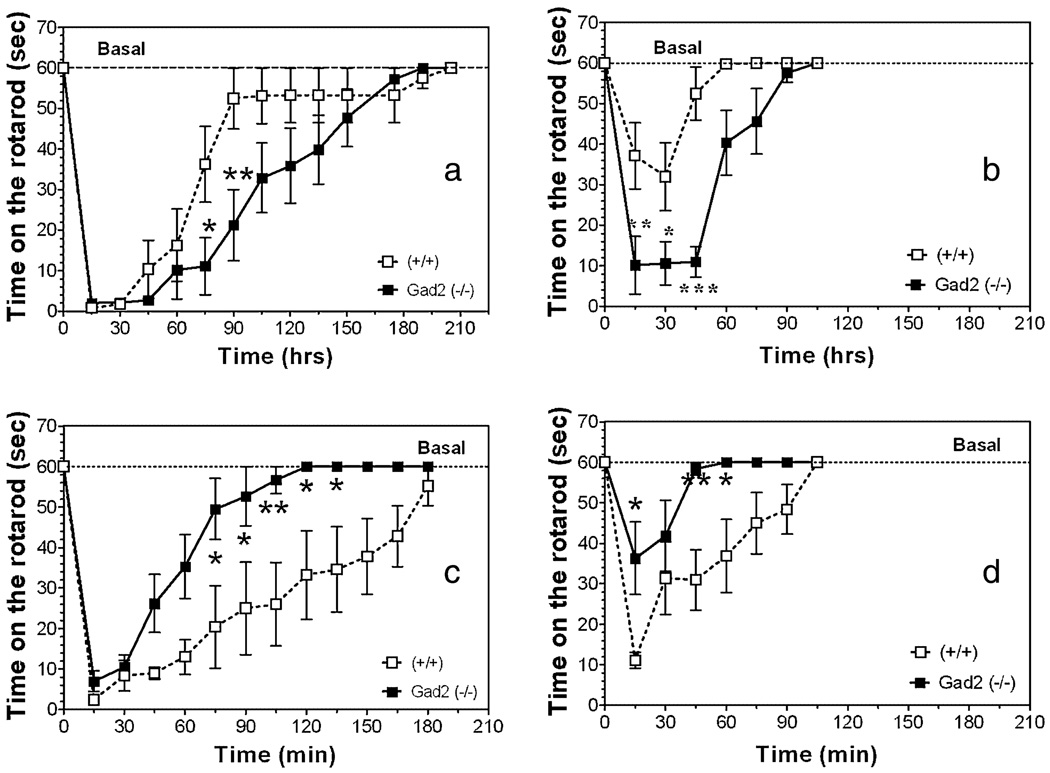
Administration of low doses of gabaxadol (10 mg/kg, Fig. 10a) or flurazepam (35 mg/kg, Fig. 10c) produced incoordination in wild-type as well as in knockout mice. Gad2-deficient mice demonstrated a markedly slower recovery from the effect of gabaxadol [F(1,196) = 14.32, P < 0.001—effect of genotype; F(13,196) = 28.15, P < 0.001—effect of time; F(13,196) = 1.79, P < 0.05—genotype × time interaction] and much faster recovery from the effect of flurazepam [F(1,117) = 56.68, P < 0.001—effect of genotype; F(12,117) = 17.87, P < 0.001—effect of time]. Administration of the drugs at lower doses (15 mg/kg flurazepam, Fig. 10d and 5 mg/kg gabaxadol, Fig. 10b) showed similar differences between wild-type and knockout mice [F(1,112) = 38.83, P < 0.001—effect of genotype; F(12,112) = 21.51, P < 0.001—effect of time; F(12,112) = 4.24, P < 0.001—genotype × time interaction for gabaxadol and F(1,104) = 25.26, P < 0.001—effect of genotype; F(7,104) = 9.78, P < 0.001—effect of time for flurazepam] (Fig. 10b, d). Post hoc analyses showed that knockout mice were more sensitive to the motor incoordination effect of gabaxadol (5 mg/kg) at 15 minutes after drug injection (P < 0.01).In contrast, knockout mice were less sensitive to this effect of flurazepam (15 mg/kg) at 15 minutes after drug injection (P < 0.05).
Figure 10.
Effects of flurazepam and gabaxadol on motor incoordination in Gad2 (−/−) and wild-type mice on the 129N2 background. (a, b) Recovery from motor incoordination measured by time on rotarod before and after flurazepam at 35 g/kg (a) and 15 mg/kg (b) (n = 6–8 per genotype). (c, d) Recovery from motor incoordination measured by time on rotarod before and after gabaxadol at 10 g/kg (c) and 5 mg/kg (d). *P < 0.05; **P < 0.01; ***P < 0.001—significant difference relative to wild-type mice for same concentration of drug (Bonferroni post-test) (n = 8 per genotype).Values represent mean ± standard error of the mean
Immunoblot analysis
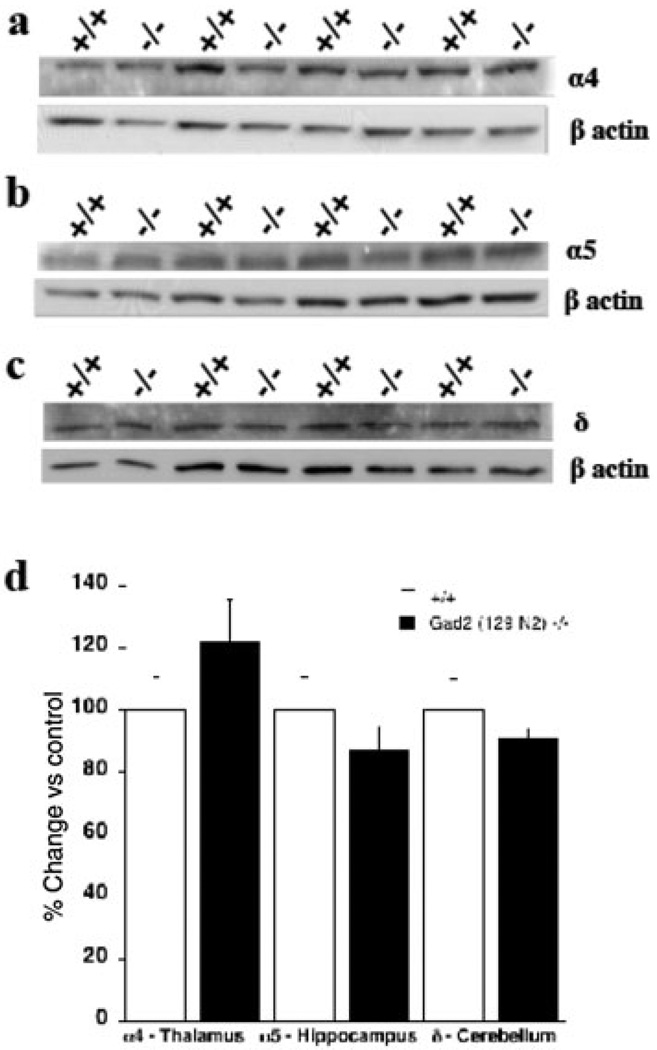
Western blot analysis of levels of GABAA receptor α5 and δ subunit proteins (n = 7–8 per genotype) from hippocampus and cerebellum, respectively, revealed no differences between genotypes (Fig. 11b–d). The α4 subunit protein from thalamus (n = 9–11 per genotype) of null mice revealed a slight, but nonsignificant (P = 0.12), increase compared with wild-type controls (Fig. 11a, d).
Figure 11.
Representative Western blots and summary data for levels of GABAA receptor subunits in different brain regions in Gad2 (−/−) and wild-type (+/+) mice (129N2 background). β-Actin was used as loading control for each blot). (a) GABAA receptor α4 subunit from thalamus (n = 9–11 per genotype). (b) GABAA receptor α5 subunit from hippocampus (n = 7–8 per genotype). (c) GABAA receptor δ subunit from cerebellum (n = 7–8 per genotype). (d) Summary graph of Western blot analysis demonstrating no change in levels of GABAA receptor α4,α5 and δ subunits. Data are expressed as mean ± standard error of the mean of % change in band intensity relative to wild-type (+/+) controls following normalization to actin
DISCUSSION
Our results show that effects of deletion of the Gad2 gene produces modest, background-dependent, changes in alcohol phenotypes despite marked changes in actions of the GABAergic drugs flurazepam and gabaxadol (as measured by ataxia). Three alcohol phenotypes were changed by the mutation: increased palatability of ethanol; increased ethanol intake; and reduction of severity of ethanol-induced withdrawal (summarized in Table 2). Mutant mice on the predominantly B6 background did not show any ethanol-related behavioral phenotypes, consistent with an earlier report that alcohol consumption is not altered in these mice (Stork et al. 2000). However, these alcohol phenotypes were present in the 129N1 and 129N2 genetic backgrounds and reduction of severity of ethanol-induced acute withdrawal was seen only on the 129N2 background. This suggests that the combination of less severe ethanol withdrawal with increased palatability of ethanol found in 129N2 mice led to more pronounced increases in ethanol intake and preference compared with 129N1 genetic background. A number of studies provide suggestive evidence that genetic variation in or near the Gad2 gene might contribute to genetic variation in human alcoholism or alcohol sensitivity (Loh et al., 2006; Lappalainen et al. 2007; Kuo et al. 2009) but Gad2 does not appear to be a candidate gene for alcohol withdrawal severity in mice (Fehr, Rademacher & Buck 2003). Thus far there is suggestive, but not compelling, evidence for a genetic relationship. Perhaps it is not surprising that the influence of variations in Gad2 promoter sequence or protein-coding regions on alcohol consumption may be difficult to detect in a heterogeneous human population as even complete deletion of Gad2 in mice does not change alcohol consumption with some genetic backgrounds. For human populations, the relationship of DNA variation to phenotypic differences is a central and unanswered question. One of the main obstacles is the extensive genetic heterogeneity and heterozygosity in the human population (for review see Guryev & Cuppen 2009). From this prospective, study of heterogenous backgrounds in mice may be useful because they have some similarity to human backgrounds (despite the limited number of progenitor inbred mouse strains) but are much easier to approach experimentally.
Table 2.
Summary of the behavioral effects of ethanol in Gad2 (−/−) deficient mice on three different genetic backgrounds.
| Genetic background | |||
|---|---|---|---|
| Behavior | B6 | 129(N1) | 129(N2) |
| Ethanol intake (g/kg) | 0 | 0 | ↑↑ |
| Ethanol preference | 0 | ↑ | ↑↑ |
| Palatability | ↑ | ↑ | ↑ |
| Ethanol acute withdrawal | 0 | 0 | ↓ |
| Ethanol-induced conditioned taste aversion | 0 | 0 | 0 |
| Ethanol-induced LORR | 0 | ↑ | 0 |
| Flurazepam-induced LORR | 0 | ||
| Gabaxadol-induced LORR | 0 | ||
| Recovery from flurazepam-induced motor incoordination | → | ||
| Recovery from flurazepam-induced motor incoordination | ← | ||
↓ = Decreased behavior in comparison with wild type. ↑ = Increased behavior in comparison with wild type. 0 = No change in comparison with wild type. → = Shift to the right in time-response curve (longer recovery). ← = Shift to the left in time-response curve (faster recovery). LORR = loss of righting reflex.
There are several possible explanations for the effects of genetic background in these studies. One is that the mutants on the 129N1 or 129N2 background show a more severe deficit of GABA than mice on the B6 background. This is the case for the null mutants backcrossed onto the NOD/LtJ background, which show decreased GABA levels, even though mice on the B6 background had normal GABA levels (Kash et al. 1997). However, this is unlikely for our colonies as viability was improved by backcrossing to 129S1/SvimJ strain, suggesting less severe GABA deficits. The increase of lethality and simultaneous disappearance of behavioral phenotypes with backcrossing of mutant mice on B6 background was demonstrated earlier. Thus, y-PKC null mutants after introgression on B6 background did not survive at the 7th to 10th generations and at the 6th generation the ‘no tolerance’ phenotype for sedative-hypnotic and hypothermic effects of ethanol was lost (Bowers et al. 1999). Another possibility is that backcrossing results in compensatory mechanisms that reduce the lethality of the mutation but also produce alcohol phenotypes, as was suggested for deletion of the α1 subunit of the GABAA receptor (Ponomarev et al. 2006). Lastly, it is possible that behavioral strain differences influence the action of the null mutation (for review see Crabbe et al. 2006). For example, B6 mice have very high levels of alcohol intake and very low levels of acute alcohol withdrawal HIC, and these ‘ceiling/floor’ effects may make it difficult to show increases in alcohol consumption or HIC.
There are several possible behavioral mechanisms for increased ethanol intake in the two-bottle choice paradigm. Mice can increase consumption of ethanol because of decreased aversive properties of alcohol as well as increased ethanol reward (for review see Chester & Cunningham 2002). However, our studies of conditioned taste aversion in these mutant mice indicate that changes in these properties of ethanol do not account for the decreased alcohol consumption. Alcohol withdrawal severity is inversely correlated with alcohol consumption in mice (Metten et al. 1998), raising the possibility that reduced alcohol withdrawal shown in mice lacking Gad2 (129N2) might account for the increase in alcohol consumption revealed in this mouse strain.
Some studies have shown a negative correlation between hypnotic (LORR) effects of ethanol and voluntary ethanol consumption (Thiele et al. 1998, 2000; Hodge et al. 1999; Spanagel et al. 2002), but this is not always the case (Blednov et al. 2003a,b; Boehm et al., 2003, 2004a). Our results showed slight overall increase of duration of ethanol-induced LORR only in mice on 129N1 genetic background without differences in effect of different ethanol doses, and it’s unlikely that these differences can account for the observed increase of ethanol preference and intake.
In addition to the pharmacological effects of alcohol, alcohol consumption depends on caloric value, taste, olfaction and palatability (Belknap, Crabbe & Young 1993; Kiefer, Hill & Kaczmarek 1998; McMillen & Williams 1998; Bachmanov et al. 2003). The potential role of taste in increased ethanol intake in Gad2-deficient mice can be ruled out because our data did not show differences in preference for sweet or bitter tastes between wild and mutant mice, and this is consistent with another study of taste in Gad2-deficient mice (Shimura et al. 2004). However, enhancement of GABAA receptor function by benzodiazepines enhances food consumption, apparently as a result of increased palatability or hedonic evaluation (for review see Cooper 2005). This seems inconsistent with our observation of increased palatability in mice lacking Gad2. Separating ethanol palatability from consumption is often difficult. One approach is the taste reactivity test, which assesses oral-facial responses to intra-oral infusions of ethanol solutions. We used a different approach. Nocturnal rodents, such as mice and rats, feed primarily during the dark hours (Erickson, Clegg & Palmiter 1996) and characteristically eat their largest meal shortly after ‘lights off’ (Green, Wilkinson & Woods 1992). To distinguish between consumption and response to a palatable stimulus, mice are provided with limited access to a highly palatable stimulus at a time different than their normal consumption period—e.g. during ‘lights on’. This approach has been used for comparison of palatable responses in wild-type and mutant mice (Sindelar et al. 2005; Blednov et al. 2006). As discussed further, removal of Gad2 may result in subunit specific changes in GABAA receptors. In this regard, it is important to note that drugs with different subunit specificity have different effects on palatability. For example, zolpidem, an α1-selective compound (Crestani et al. 2000), did not exhibit a hyperphagic effect in a palatable food consumption test (Yerbury & Cooper 1989). In contrast, CGS 17867A, with significant efficacy at α2- and α3-GABAA receptor subtypes (Mitchinson et al. 2004), proved effective in promoting overconsumption of palatable food in non-deprived rats (Yerbury & Cooper 1989).
There is no information about whether deletion of Gad2 will affect the molecular organization of postsynaptic or extrasynaptic GABAA receptors, but our data raise this possibility. First, the opposite effects of Gad2-deficiency on flurazepam- and gabaxadol-induced motor incoordination suggest changes in populations of GABAA receptors. Low doses of gabaxadol specifically target the extrasynaptic, δ-containing GABAA receptors (Herd et al. 2009). The effect of gabaxadol on motor incoordination is abolished in mice lacking δ- or α4 subunits of the GABAA receptor (Chandra et al. 2006; Herd et al. 2009). The increased effect of gabaxadol on motor incoordination found in mice lacking Gad2 suggests increases in extrasynaptic receptors with α4 and δ subunits. We measured the levels of α4 subunit protein in thalamus and the level of this subunit was slightly, but not significantly, higher in knockout mice. However, it is possible that measurement of surface, rather than total protein, or study of a different brain region might detect a subunit increase. Other studies have found changes in GABA neurochemistry in these mice. For example, vesicular GABA transporter is upregulated in Gad2 null mutant mice and the synaptic vesicles prepared from mutants transport cytosolic GABA more efficiently than the synaptic vesicles prepared from the wild type (Wu et al. 2007).
A weaker effect of low doses of flurazepam on motor incoordination is consistent with previously published results (Kash et al. 1999) and could be caused by the reduced levels of GABA in the synapse or to changes in synaptic GABAA receptors. It is unlikely that deletion of Gad2 changes the expression of the abundant α1 subunit because GABAA receptor binding (using [3H]-muscimol) is not affected in these mice (Kash et al. 1999). In addition, knock-in mice lacking the ethanol-sensitive site in the α1 subunit demonstrated significantly faster recovery from motor incoordination induced by ethanol (Werner et al. 2006) whereas no change in this type of behavior was found in Gad2 null mice.
Taken together, these data show that impairment of GABA synthesis by deletion of Gad2 increased ethanol intake and preference for ethanol in mice, and this depends on the genetic background. The changes in alcohol consumption may be caused by the modification of two other behaviors also related to GABAergic function, severity of ethanol withdrawal and palatability. These results were somewhat unexpected as reduction of synaptic GABAA function (by receptor subunit deletion or mutation) often reduces alcohol consumption, reduces duration of LORR from ethanol, and causes a quicker recovery from ataxia (Boehm et al., 2006; Werner et al. 2006). None of these expected changes in ethanol actions were obtained from deletion of Gad2, even though decreased actions of flurazepam were observed, consistent with decreased synaptic GABA. A possible explanation for some of the surprising findings is the increased action of gaboxadol, suggesting increased function of extrasynaptic GABAA receptors. These receptors may be important for actions of low concentrations of ethanol (see Olsen & Sieghart 2009) and increased modulation of extrasynaptic receptors combined with decreased actions on synaptic receptors may be responsible for the complex and unexpected phenotypes of these mutant mice.
Acknowledgments
This study or research was supported by grant from the National Institute of Alcohol Abuse and Alcoholism, NIH (AA U01 13520—INIA Project) and NIH grants A06399 and AA10422. The authors would like to thank Virginia Bleck and Chelsea Gail for the excellent technical assistance.
Footnotes
Authors Contribution
ARH provided the overall coordination of the whole project. YAB was responsible for supervision of behavioral experiments and directly participated in running some of them. DLW was fully responsible for the maintenance of breeding colonies and for all behavioral experimental work. GH and SV were fully responsible for immunoblot analysis.
References
- Asada H, Kawamura Y, Maruyama K, Kume H, Ding R, Ji FY, Kanbara N, Kuzume H, Sanbo M, Yagi T, Obata K. Mice lacking the 65 kda isoform of glutamic acid decarboxylase (gad65) maintain normal levels of gad67 and GABA in their brains but are susceptible to seizures. Biochem Biophys Res Commun. 1996;229:891–895. doi: 10.1006/bbrc.1996.1898. [DOI] [PubMed] [Google Scholar]
- Asada H, Kawamura Y, Maruyama K, Kume H, Ding RG, Kanbara N, Kuzume H, Sanbo M, Yagi T, Obata K. Cleft palate and decreased brain gamma-aminobutyric acid in mice lacking the 67-kDa isoform of glutamic acid decarboxylase. Proc Natl Acad Sci USA. 1997;94:6496–6499. doi: 10.1073/pnas.94.12.6496. [DOI] [PMC free article] [PubMed] [Google Scholar]
- Bachmanov AA, Kiefer SW, Molina JC, Tordoff MG, Duffy VB, Bartoshuk LM, Mennella JA. Chemosensory factors influencing alcohol perception, preferences, and consumption. Alcoholism: Clinical and Experimental Research. 2003;27:220–231. doi: 10.1097/01.ALC.0000051021.99641.19. [DOI] [PMC free article] [PubMed] [Google Scholar]
- Belknap JK, Crabbe JC, Young ER. Voluntary consumption of ethanol in 15 inbred mouse strains. Psychopharmacology. 1993;112:503–510. doi: 10.1007/BF02244901. [DOI] [PubMed] [Google Scholar]
- Blednov YA, Harris RA. Metabotropic glutamate receptor 5 (mGluR5) regulation of ethanol sedation, dependence and consumption: relationship to acamprosate actions. Int J Neuropsychopharmacol. 2008;11:775–793. doi: 10.1017/S1461145708008584. [DOI] [PMC free article] [PubMed] [Google Scholar]
- Blednov YA, Jung S, Alva H, Wallace D, Rosahl T, Whiting PJ, Harris RA. Deletion of the alpha1 or beta2 subunit of GABAA receptors reduces actions of alcohol and other drugs. J Pharmacol Exp Ther. 2003a;304:30–36. doi: 10.1124/jpet.102.042960. [DOI] [PubMed] [Google Scholar]
- Blednov YA, Walker D, Alva H, Creech K, Findlay G, Harris RA. GABAA receptor alpha 1 and beta 2 subunit null mutant mice: behavioral responses to ethanol. J Pharmacol Exp Ther. 2003b;305:854–863. doi: 10.1124/jpet.103.049478. [DOI] [PubMed] [Google Scholar]
- Blednov YA, Walker D, Martinez M, Harris RA. Reduced alcohol consumption in mice lacking preprodynorphin. Alcohol. 2006;40:73–86. doi: 10.1016/j.alcohol.2006.12.002. [DOI] [PMC free article] [PubMed] [Google Scholar]
- Boehm SL, II, Peden L, Chang R, Harris RA, Blednov YA. Deletion of the fyn-kinase gene alters behavioral sensitivity to ethanol. Alcoholism: Clinical and Experimental Research. 2003;27:1033–1040. doi: 10.1097/01.ALC.0000075822.80583.71. [DOI] [PubMed] [Google Scholar]
- Boehm SL, II, Peden L, Jennings AW, Kojima N, Harris RA, Blednov YA. Over-expression of the fyn-kinase gene reduces hypnotic sensitivity to ethanol in mice. Neurosci Lett. 2004a;372:6–11. doi: 10.1016/j.neulet.2004.08.028. [DOI] [PubMed] [Google Scholar]
- Boehm SL, II, Ponomarev I, Jennings AW, Whiting PJ, Rosahl TW, Garrett EM, Blednov YA, Harris RA. Gamma-aminobutyric acid A receptor subunit mutant mice: new perspectives on alcohol actions. Biochem Pharmacol. 2004b;68:1581–1602. doi: 10.1016/j.bcp.2004.07.023. [DOI] [PubMed] [Google Scholar]
- Boehm SL, II, Ponomarev I, Blednov YA, Harris RA. From gene to behavior and back again: new perspectives on GABAA receptor subunit selectivity of alcohol actions. Adv Pharmacol. 2006;54:171–203. doi: 10.1016/s1054-3589(06)54008-6. [DOI] [PubMed] [Google Scholar]
- Bowers BJ, Owen EH, Collins AC, Abeliovich A, Tonegawa S, Wehner JM. Decreased ethanol sensitivity and tolerance development in gamma-protein kinase C null mutant mice is dependent on genetic background. Alcoholism: Clinical and Experimental Research. 1999;23:387–397. [PubMed] [Google Scholar]
- Chandra D, Jia F, Liang J, Peng Z, Suryanarayanan A, Werner DF, Spigelman I, Houser CR, Olsen RW, Harrison NL, Homanics GE. GABAA receptor alpha 4 subunits mediate extrasynaptic inhibition in thalamus and dentate gyrus and the action of gaboxadol. Proc Natl Acad Sci USA. 2006;103:15230–15235. doi: 10.1073/pnas.0604304103. [DOI] [PMC free article] [PubMed] [Google Scholar]
- Chester JA, Cunningham CL. GABA(A) receptor modulation of the rewarding and aversive effects of ethanol. Alcohol. 2002;26:131–143. doi: 10.1016/s0741-8329(02)00199-4. [DOI] [PubMed] [Google Scholar]
- Christgau S, Aanstoot HJ, Schierbeck H, Begley K, Tullin S, Hejnaes K, Baekkeskov S. Membrane anchoring of the autoantigen GAD65 to microvesicles in pancreatic beta-cells by palmitoylation in the NH2-terminal domain. J Cell Biol. 1992;118:309–320. doi: 10.1083/jcb.118.2.309. [DOI] [PMC free article] [PubMed] [Google Scholar]
- Christgau S, Schierbeck H, Aanstoot HJ, Aagaard L, Begley K, Kofod H, Hejnaes K, Baekkeskov S. Pancreatic beta cells express two autoantigenic forms of glutamic acid decarboxylase, a 65-kDa hydrophilic form and a 64-kDa amphiphilic form which can be both membrane-bound and soluble. J Biol Chem. 1991;266:21257–21264. [PubMed] [Google Scholar]
- Condie BG, Bain G, Gottlieb DI, Capecchi MR. Cleft palate in mice with a targeted mutation in the gamma-aminobutyric acid-producing enzyme glutamic acid decarboxylase 67. Proc Natl Acad Sci USA. 1997;94:11451–11455. doi: 10.1073/pnas.94.21.11451. [DOI] [PMC free article] [PubMed] [Google Scholar]
- Cooper SJ. Palatability-dependent appetite and benzodiazepines: new directions from the pharmacology of GABA(A) receptor subtypes. Appetite. 2005;44:133–150. doi: 10.1016/j.appet.2005.01.003. [DOI] [PubMed] [Google Scholar]
- Crabbe JC, Merrill C, Belknap JK. Acute dependence on depressant drugs is determined by common genes in mice. J Pharmacol Exp Ther. 1991;257:663–667. [PubMed] [Google Scholar]
- Crabbe JC, Phillips TJ, Harris RA, Arends MA, Koob GF. Alcohol-related genes: contributions from studies with genetically engineered mice. Addict Biol. 2006;11:195–269. doi: 10.1111/j.1369-1600.2006.00038.x. [DOI] [PubMed] [Google Scholar]
- Crestani F, Martin JR, Möhler H, Rudolph U. Mechanism of action of the hypnotic zolpidem in vivo. Br J Pharmacol. 2000;131:251–1254. doi: 10.1038/sj.bjp.0703717. [DOI] [PMC free article] [PubMed] [Google Scholar]
- Enoch MA. The role of GABA(A) receptors in the development of alcoholism. Pharmacol Biochem Behav. 2008;90:95–104. doi: 10.1016/j.pbb.2008.03.007. [DOI] [PMC free article] [PubMed] [Google Scholar]
- Erickson JC, Clegg KE, Palmiter RD. Sensitivity to leptin and susceptibility to seizures of mice lacking neuropeptide Y. Nature. 1996;381:415–418. doi: 10.1038/381415a0. [DOI] [PubMed] [Google Scholar]
- Erlander MG, Tillakaratne NJ, Feldblum S, Patel N, Tobin AJ. Two genes encode distinct glutamate decarboxylases. Neuron. 1991;7:91–100. doi: 10.1016/0896-6273(91)90077-d. [DOI] [PubMed] [Google Scholar]
- Fehr C, Rademacher BL, Buck KJ. Evaluation of the glutamate decarboxylase genes Gad1 and Gad2 as candidate genes for acute ethanol withdrawal severity in mice. Prog Neuropsychopharmacol Biol Psychiatry. 2003;27:467–472. doi: 10.1016/S0278-5846(03)00034-4. [DOI] [PubMed] [Google Scholar]
- Finn DA, Belknap JK, Cronise K, Yoneyama N, Murillo A, Crabbe JC. A procedure to produce high alcohol intake in mice. Psychopharmacology. 2005;178:471–480. doi: 10.1007/s00213-004-2039-8. [DOI] [PubMed] [Google Scholar]
- Green PK, Wilkinson CW, Woods SC. Intraventricular corticosterone increases the rate of body weight gain in under-weight adrenalectomized rats. Endocrinology. 1992;130:269–275. doi: 10.1210/endo.130.1.1727703. [DOI] [PubMed] [Google Scholar]
- Guryev V, Cuppen E. Next-generation sequencing approaches in genetic rodent model systems to study functional effects of human genetic variation. FEBS Lett. 2009;583:1668–1673. doi: 10.1016/j.febslet.2009.04.020. [DOI] [PubMed] [Google Scholar]
- Heldt SA, Green A, Ressler KJ. Prepulse inhibition deficits in GAD65 knockout mice and the effect of antipsychotic treatment. Neuropsychopharmacology. 2004;29:1610–1619. doi: 10.1038/sj.npp.1300468. [DOI] [PubMed] [Google Scholar]
- Herd MB, Foister N, Chandra D, Peden DR, Homanics GE, Brown VJ, Balfour DJ, Lambert JJ, Belelli D. Inhibition of thalamic excitability by 4,5,6,7-tetrahydroisoxazolo[4,5-c]pyridine-3-ol: a selective role for delta-GABA(A) receptors. Eur J Neurosci. 2009;29:1177–1187. doi: 10.1111/j.1460-9568.2009.06680.x. [DOI] [PMC free article] [PubMed] [Google Scholar]
- Hodge CW, Mehmert KK, Kelley SP, McMahon T, Haywood A, Olive MF, Wang D, Sanchez-Perez AM, Messing RO. Supersensitivity to allosteric GABA(A) receptor modulators and alcohol in mice lacking PKCepsilon. Nat Neurosci. 1999;2:997–1002. doi: 10.1038/14795. [DOI] [PubMed] [Google Scholar]
- Kash SF, Johnson RS, Tecott LH, Noebels JL, Mayfield RD, Hanahan D, Baekkeskov S. Epilepsy in mice deficient in the 65-kDa isoform of glutamic acid decarboxylase. Proc Natl Acad Sci USA. 1997;94:14060–14065. doi: 10.1073/pnas.94.25.14060. [DOI] [PMC free article] [PubMed] [Google Scholar]
- Kash SF, Tecott LH, Hodge C, Baekkeskov S. Increased anxiety and altered responses to anxiolytics in mice deficient in the 65-kDa isoform of glutamic acid decarboxylase. Proc Natl Acad Sci USA. 1999;96:1698–1703. doi: 10.1073/pnas.96.4.1698. [DOI] [PMC free article] [PubMed] [Google Scholar]
- Kiefer SW, Hill KG, Kaczmarek HJ. Taste reactivity to alcohol and basic tastes in outbred mice. Alcoholism: Clinical and Experimental Research. 1998;22:1146–1151. [PubMed] [Google Scholar]
- Kuo PH, Kalsi G, Prescott CA, Hodgkinson CA, Goldman D, Alexander J, van den Oord EJ, Chen X, Sullivan PF, Patterson DG, Walsh D, Kendler KS, Riley BP. Associations of glutamate decarboxylase genes with initial sensitivity and age-at-onset of alcohol dependence in the Irish Affected Sib Pair Study of Alcohol Dependence. Drug Alcohol Depend. 2009;101:80–87. doi: 10.1016/j.drugalcdep.2008.11.009. [DOI] [PMC free article] [PubMed] [Google Scholar]
- Loh el-W, Lane HY, Chen CH, Chang PS, Ku LW, Wang KH, Cheng AT. Glutamate decarboxylase genes and alcoholism in Han Taiwanese men. Alcoholism: Clinical and Experimental Research. 2006;30:1817–1823. doi: 10.1111/j.1530-0277.2006.00218.x. [DOI] [PubMed] [Google Scholar]
- Lappalainen J, Krupitsky E, Kranzler HR, Luo X, Remizov M, Pchelina S, Taraskina A, Zvartau E, Räsanen P, Makikyro T, Somberg LK, Krystal JH, Stein MB, Gelernter J. Mutation screen of the GAD2 gene and association study of alcoholism in three populations. Am J Med Genet B Neuropsychiatr Genet. 2007;5:183–192. doi: 10.1002/ajmg.b.30377. [DOI] [PubMed] [Google Scholar]
- Lundquist F. The determination of ethyl alcohol in blood and tissue. Methods Biochem Anal. 1959;7:217–251. [Google Scholar]
- McMillen BA, Williams HL. Role of taste and calories in the selection of ethanol by C57BL/6NHsd and Hsd : ICR mice. Alcohol. 1998;15:193–198. doi: 10.1016/s0741-8329(97)00111-0. [DOI] [PubMed] [Google Scholar]
- Mameli M, Botta P, Zamudio PA, Zucca S, Valenzuela CF. Ethanol decreases Purkinje neuron excitability by increasing GABA release in rat cerebellar slices. J Pharmacol Exp Ther. 2008;327:910–917. doi: 10.1124/jpet.108.144865. [DOI] [PMC free article] [PubMed] [Google Scholar]
- Martin DL, Martin SB, Wu SJ, Espina N. Regulatory properties of brain glutamate decarboxylase (GAD): the apoenzyme of GAD is present principally as the smaller of two molecular forms of GAD in brain. J Neurosci. 1991;11:2725–2731. doi: 10.1523/JNEUROSCI.11-09-02725.1991. [DOI] [PMC free article] [PubMed] [Google Scholar]
- Mehta AK, Ticku MK. An update on GABAA receptors. Brain Res Rev. 1999;29:196–217. doi: 10.1016/s0165-0173(98)00052-6. [DOI] [PubMed] [Google Scholar]
- Metten P, Phillips TJ, Crabbe JC, Tarantino LM, McClearn GE, Plomin R, Erwin VG, Belknap JK. High genetic susceptibility to ethanol withdrawal predicts low ethanol consumption. Mamm Genome. 1998;9:983–990. doi: 10.1007/s003359900911. [DOI] [PubMed] [Google Scholar]
- Mitchinson A, Atack JR, Blurton P, Carling RW, Castro JL, Curley KS, Russell MG, Marshall G, McKernan RM, Moore KW, Narquizian R, Smith A, Street LJ, Thompson SA, Wafford K. 2,5-Dihydropyrazolo [4,3-c]pyridine-3-ones: functional selective benzodiazepine binding site ligands on the GABAA receptor. Bioorg Med Chem Lett. 2004;14:3441–3444. doi: 10.1016/j.bmcl.2004.04.085. [DOI] [PubMed] [Google Scholar]
- Obata K. Biochemistry and physiology of amino acid transmitters. In: Kandel E, editor. Handbook of Physiology. Bethesda, MD: The American Physiological Society; 1977. pp. 625–650. [Google Scholar]
- Obata K, Fukuda T, Konishi S, Ji F-Y, Mitoma H, Kosaka T. Synaptic localization of the 67 000 mol. wt isoform of glutamate decarboxylase and transmitter function of GABA in the mouse cerebellum lacking the 65 000 mol. wt isoform. Neuroscience. 1999;93:1475–1482. doi: 10.1016/s0306-4522(99)00274-2. [DOI] [PubMed] [Google Scholar]
- Olsen RW, Sieghart W. GABA A receptors: subtypes provide diversity of function and pharmacology. Neuropharmacology. 2009;56:141–148. doi: 10.1016/j.neuropharm.2008.07.045. [DOI] [PMC free article] [PubMed] [Google Scholar]
- Ponomarev I, Maiya R, Harnett MT, Schafer GL, Ryabinin AE, Blednov YA, Morikawa H, Boehm SL, 2nd, Homanics GE, Berman AE, Lodowski KH, Bergeson SE, Harris RA. Transcriptional signatures of cellular plasticity in mice lacking the α1 subunit of GABAA receptors. J Neurosci. 2006;26:5673–5683. doi: 10.1523/JNEUROSCI.0860-06.2006. [DOI] [PMC free article] [PubMed] [Google Scholar]
- Reetz A, Solimena M, Matteoli M, Folli F, Takei K, De Camilli P. GABA and pancreatic beta-cells: colocalization of glutamic acid decarboxylase (GAD) and GABA with synaptic-like microvesicles suggests their role in GABA storage and secretion. EMBO J. 1991;10:1275–1284. doi: 10.1002/j.1460-2075.1991.tb08069.x. [DOI] [PMC free article] [PubMed] [Google Scholar]
- Rhodes JS, Best K, Belknap JK, Finn DA, Crabbe JC. Evaluation of a simple model of ethanol drinking to intoxication in C57BL/6J mice. Physiol Behav. 2005;84:53–63. doi: 10.1016/j.physbeh.2004.10.007. [DOI] [PubMed] [Google Scholar]
- Sheikh SN, Martin SB, Martin DL. Regional distribution and relative amounts of glutamate decarboxylase isoforms in rat and mouse brain. Neurochem Int. 1999;35:73–80. doi: 10.1016/s0197-0186(99)00063-7. [DOI] [PubMed] [Google Scholar]
- Shimura T, Watanabe U, Yanagawa Y, Yamamoto T. Altered taste function in mice deficient in the 65-kDa isoform of glutamate decarboxylase. Neurosci Lett. 2004;356:171–174. doi: 10.1016/j.neulet.2003.11.041. [DOI] [PubMed] [Google Scholar]
- Sindelar DK, Palmiter RD, Woods SC, Schwartz MW. Attenuated feeding responses to circadian and palatability cues in mice lacking neuropeptide Y. Peptides. 2005;26:2597–2602. doi: 10.1016/j.peptides.2005.04.018. [DOI] [PubMed] [Google Scholar]
- Soghomonian JJ, Martin DL. Two isoforms of glutamate decarboxylase: why? Trends Pharmacol Sci. 1998;19:500–505. doi: 10.1016/s0165-6147(98)01270-x. [DOI] [PubMed] [Google Scholar]
- Spanagel R, Siegmund S, Cowen M, Schroff KC, Schumann G, Fiserova M, Sillaber I, Wellek S, Singer M, Putzke J. The neuronal nitric oxide synthase gene is critically involved in neurobehavioral effects of alcohol. J Neurosci. 2002;22:8676–8683. doi: 10.1523/JNEUROSCI.22-19-08676.2002. [DOI] [PMC free article] [PubMed] [Google Scholar]
- Stork O, Ji F-Y, Kaneko K, Stork S, Yoshinobu Y, Moriya T, Shibata S, Obata K. Postnatal development of a GABA deficit and disturbance of neural functions in mice lacking GAD65. Brain Res. 2000;865:45–58. doi: 10.1016/s0006-8993(00)02206-x. [DOI] [PubMed] [Google Scholar]
- Stork O, Yamanaka H, Stork S, Kume N, Obata K. Altered conditioned fear behavior in glutamate decarboxylase 65 null mutant mice. Genes Brain Behav. 2003;2:65–70. doi: 10.1034/j.1601-183x.2003.00008.x. [DOI] [PubMed] [Google Scholar]
- Thiele TE, Marsh DJ, Ste Marie L, Bernstein IL, Palmiter RD. Ethanol consumption and resistance are inversely related to neuropeptide Y levels. Nature. 1998;396:366–369. doi: 10.1038/24614. [DOI] [PubMed] [Google Scholar]
- Thiele TE, Willis B, Stadler J, Reynolds JG, Bernstein IL, McKnight GS. High ethanol consumption and low sensitivity to ethanol-induced sedation in protein kinase A-mutant mice. J Neurosci. 2000;20:RC75. doi: 10.1523/JNEUROSCI.20-10-j0003.2000. [DOI] [PMC free article] [PubMed] [Google Scholar]
- Weiner JL, Valenzuela CF. Ethanol modulation of GABAergic transmission: the view from the slice. Pharmacol Ther. 2006;111:533–554. doi: 10.1016/j.pharmthera.2005.11.002. [DOI] [PubMed] [Google Scholar]
- Werner DF, Blednov YA, Ariwodola OJ, Silberman Y, Logan E, Berry RB, Borghese CM, Matthews DB, Weiner JL, Harrison NL, Harris RA, Homanics GE. Knockin mice with ethanol-insensitive alpha1-containing gamma-aminobutyric acid type A receptors display selective alterations in behavioral responses to ethanol. J Pharmacol Exp Ther. 2006;319:219–227. doi: 10.1124/jpet.106.106161. [DOI] [PubMed] [Google Scholar]
- Wu H, Jin Y, Buddhala C, Osterhaus G, Cohen E, Jin H, Wei J, Davis K, Obata K, Wu JY. Role of glutamate decarboxylase (GAD) isoform, GAD65, in GABA synthesis and transport into synaptic vesicles-Evidence from GAD65-knockout mice studies. Brain Res. 2007;1154:80–83. doi: 10.1016/j.brainres.2007.04.008. [DOI] [PubMed] [Google Scholar]
- Yerbury RE, Cooper SJ. Novel benzodiazepine receptor ligands: palatable food intake following zolpidem, CGS 17867A, or Ro 23-0364, in the rat. Pharmacol Biochem Behav. 1989;33:303–307. doi: 10.1016/0091-3057(89)90504-2. [DOI] [PubMed] [Google Scholar]


