Abstract
Our recent studies have shown that high intensity pulsed ultrasound can achieve mechanical tissue fragmentation, a process we call histotripsy. Histotripsy has many medical applications where non-invasive tissue removal or significant tissue disruption is needed (e.g., cancer therapy). The primary aim of this study is to investigate tissue regions treated by histotripsy and to characterize the boundary between the treated and untreated zones using transmission electron microscopy (TEM). The nature of the tissue disruption suggests many clinical applications and provides insights on the physical mechanism of histotripsy. Fresh ex vivo porcine kidney tissues were treated using histotripsy. A 1 MHz 100mm diameter focused transducer was used to deliver 15 cycle histotripsy pulses at a peak negative pressure of 17 MPa and a pulse repetition frequency (PRF) of 100 Hz. Each lesion was produced by a 3 × 3 (lateral) × 4 (axial) grid with 2 mm between adjacent lateral and 3 mm between axial exposure points using mechanical scanning. 2000 pulses were applied to each exposure point to achieve tissue fragmentation. After treatment, the tissue was processed and examined using TEM. Extensive fragmentation of the tissues treated with histotripsy was achieved. TEM micrographs of the tissue treated by histotripsy – showing no recognizable cellular features and little recognizable subcellular structures - demonstrates the efficacy of this technique in ablating the targeted tissue regions. A boundary, or transition zone, of a few microns separated the affected and unaffected areas, demonstrating the precision of histotripsy tissue targeting. TEM micrographs of the tissue treated by histotripsy showed no discernable cellular structure within the treated region. Histotripsy can minimize fragmentation of the adjoining non-targeted tissues because, as a nonlinear threshold phenomenon, damage can be highly localized. The potential for high lesion precision is evident in the TEM micrographs.
Keywords: ultrasound therapy, histotripsy, tissue fractionation, transmission electron microscopy
Introduction and Literature
Minimally invasive surgical methods have obvious advantages over conventional surgical procedures; examples include reduced chances of infection, less recovery time, and lower cost. Tissue ablation is a minimally invasive alternative to surgical resection for various benign and malignant conditions. Ablation modalities in common clinical uses include high intensity focused ultrasound (HIFU), radiofrequency ablation (RFA), and cryosurgery. Each of these modalities work by inducing thermal changes to the tissues, and in the case of cryotherapy, the tissue is frozen and thawed several times to generate intracellular ice and disrupt cell membranes (Warner 1999, Luo 2007). Other ablative techniques increase temperature beyond a threshold thermal dose, causing irreversible protein denaturation and collagen cross-linking, inducing coagulative necrosis (Nikfarjam 2005). Hemorrhaging and necrosis in untreated areas using these treatment methods have been examined through both histology and electron micrographs (Susani 1993, Prentice 2005, Back 1994, Sindelar 1981, Van Leenders 2000, Ozaki 2003a). Histology images of thermally treated tissue regions often appear normal and intact. However, electron micrographs of these regions can display features evident of coagulative necrosis (Van Leenders 2000, Matlaga 2004, Anderson 2004, Young 1986); this is confirmed by immunohistochemistry and enzyme activity assays (Young 1986, Ozaki 2003b). Such necrosis may appear several centimeters away from the targeted tissue regions (Van Leenders 2000, Anderson 2004, Lake 2008), often in unpredictable patterns affected by perfusion and other tissue or physiological parameters.
We have recently reported on histotripsy, a novel technology using focused ultrasound to produce nonthermal tissue ablation by mechanical means (Lake 2008, Kieran 2007, Roberts 2006). Histotripsy has many potential medical applications where non-invasive tissue ablation is desired Parsons 2006, Tran 2003, Xu 2005, Crosier 2001). Previous studies have evaluated the percentage of intact cells remaining in the treatment volume using histology micrographs (Crosier 2001, Wang 2009, Xu 2009). The purpose of this study is: to identify, quantify, and analyze cellular damage in tissue treated with histotripsy, to compare normal vs. treated tissues as visualized using both histology and transmission electron microscopy (TEM), and to compare the effects of histotripsy to other tissue ablation modalities.
Materials and Methods
Kidney Preparation and Positioning
Fresh porcine kidneys were obtained from a local abattoir (Dunbar Meats, Milan, MI. USA), flushed with 0.9% NaCl solution and placed in degassed isotonic saline for several hours to remove any residual gas bubbles within the organs. The kidneys were placed in plastic bags filled with degassed isotonic saline and partially submerged in a tank of degassed, deionized water. The kidney cortex and collecting system was located with the 5 MHz imaging probe coaxially positioned in the therapy unit.
Ultrasound Treatment and Apparatus
A 1 MHz 100mm diameter focused annular array transducer with a 40-mm inner diameter, and a 90-mm geometric focal length (Imasonic, Besancon, France) was used to deliver 15 cycle histotripsy pulses and a pulse repetition frequency (PRF) of 100 Hz. The peak negative and positive pressures were 19 MPa and 125 MPa, respectively. The pressure waveform (Figure 1) was measured in degassed water using an in-house built fiber-optic hydrophone (Parsons 2006b). The 16 annular elements were driven synchronously to work as a single element transducer focused at the geometric focus. The input electronic signals to the therapeutic ultrasound high power driver amplifiers (in-house design) were delivered by a function generator (Model 3314A, Agilent Technology, Palo Alto, CA, USA). Lesions of approximately 6 mm × 6 mm × 15 mm were produced by scanning a 3 × 3 (lateral) × 4 (axial) grid with 2 mm between adjacent lateral and 3 mm between axial exposure points using mechanical scanning. In order to generate different degrees of tissue fractionation, 7 different ultrasound doses were delivered. The doses varied from 100 to 2,000 pulses per treatment location. The pulse duration is short with low duty cycle. Earlier experiments show that these parameters do not lead to significant temperature increase or thermal damage (Kieran 2007).
Figure 1.
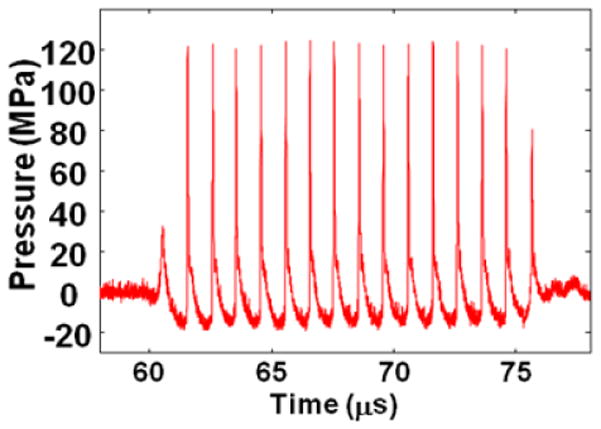
Measured pressure waveform generated from therapeutic ultrasound. Ultrasound used to perform histotrispy has 1MHz 15 cycle pulses delivered at a PRF of 100Hz and peak negative pressure of 19MPa.
All treatments were guided with a 5MHz imaging probe with a standard ultrasound imaging system. The backscatter data were collected before and after the treatment with a 10MHz probe with the same imaging system. A total of 58 lesions were produced in 9 porcine kidneys using seven different numbers of therapeutic ultrasound pulses per treatment location.
Histology
Gross kidney lesions were sectioned examined, measured, and photographed. The sectioned tissues were placed in formalin solution and fixed for approximately 1 week; this was performed to prevent any treated tissue – which was liquefied – from escaping out of the organs. The kidneys were then sliced open, exposing the treated areas based on their location within the kidney using ultrasound image guidance - determined during the histotripsy experiments; homogenized areas being hypoechogenic (Kieran 2007, Roberts 2006, Parsons 2006). They were then submitted in cassettes for embedment, sectioning, and staining in hematoxylin and eosin. The processed tissues were examined under an Olympus BX-51 optical microscope (Olympus America Inc., Center Valley, PA., USA) using brightfield light. Prepared H&E slides were examined between 40X and 200X magnifications.
TEM Preparation
The treated/untreated kidney tissues were removed in sections of approximately 1.0 mm3 and fixed for 3–7 days with 2.5% glutaraldehyde (Electron Microscopy Sciences, Hatfield, PA., USA) in 0.1M Sorenson’s phosphate buffer (pH = 7.41). This was performed to prevent any liquefied treated tissue, as noted above, from escaping. After rinsing 3 times in 0.1 M Sorenson’s phosphate buffer, the tissues were postfixed in 1% OsO4 (Electron Microscopy Sciences, Hatfield, PA., USA) in 0.l M Sorenson’s phosphate buffer followed by washing in distilled water and en bloc staining in 3% uranyl acetate (Electron Microscopy Sciences, Hatfield, PA., USA). Dehydration was carried out using a 70–100% graded ethanol series, followed by two changes in propylene oxide. The tissues were then embedded in Epon polymer and ultrathin sections (70 nm) were obtained with a diamond knife (Diatome, Hatfield, PA., USA) on a Reichert Jung ultramicrotome (Vienna, Austria), stained with uranyl acetate-lead citrate, and observed with a Philips CM-100 transmission electron microscope (FEI instruments, Hillsborough, OR., USA) at an accelerating voltage of 60 kV.
TEM Analyses
A representative set of TEM images (untreated controls, border regions between treated and untreated zones, and fully homogenized material) with magnifications ranging from 620X- 130,000X were examined and analyzed for four principal sub-cellular constituents: nuclei, mitochondria, basal lamina, and lipid bodies. The concentrations of each of these organelles were quantified over an area of approximately 100 μm2 as well as assessed qualitatively for the degree of damage produced by histotripsy. A table was produced which classifies the morphology of cells and sub-cellular structures in different stages of histotripsy-treated fractionation (Table 1). The table’s numerical values (“Histotripsy Scale”) range from 0 (no visible damage, fully intact) to 5 (fully fractionated, total damage).
Table 1.
Classification of homogenate morphology (“Histotripsy Scale”) with gradation describing the composition of the cells and sub-cellular structures in different stages of fractionation. The scale ranges from 0 (minimal disruption; indistinguishable from untreated tissues) to 5 (total homogenization of cells and tissues). Representative TEM images below each classification number exemplifies that particular classification
| Class 0: Cells in the treated zone indistinguishable from normal untreated cells. |
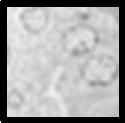 |
| Class 1: Areas in each slide showing minimal damage to organelles sensitive to mechanical disruption, eg: endoplasmic reticulum, plasma membrane, mixed with significant areas with no discernible damage. |
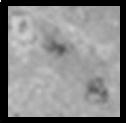 |
| Class 2: All areas of slide exhibiting some damage, particularly the cell membrane. |
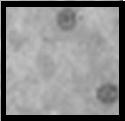 |
| Class 3: Severe damage to sensitive organelles, with some damage to most nuclei. Nuclei becoming pyknotic with tendency of having condensed chromatin. |
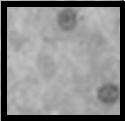 |
| Class 4: Significant reduction in the number of recognizable nuclei. Very few sensitive (membrane rich) organelles left. Those that are recognizable are severely damaged. All recognizable nuclei are severely pyknotic. |
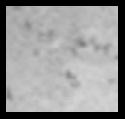 |
| Class 5: No distinguishable cells or cellular organelles even within the boundary of the treated zone on either the H&E or electron micrographs. “Complete” homogenization of the tissue. |
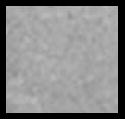 |
Images of the homogenized border between the treated and untreated regions at lower magnification (620X-1,450X) were examined and quantified for the number of intact organelles visible within the treated zone and the border immediately outside the zone. Both the intact organelles and the homogenized material were then assigned numerical values from Table 1 as to their condition. One-way analysis of variance (ANOVA) was then performed assessing the quantity of fractionation to the distance from the treated area. A chart was produced to quantify the four sub-cellular parts which were found to be intact between the treated and untreated regions; the number of replicates (n) was 4 for each of the organelles examined.
Results
Gross Examination
The lesions’ morphology showed an amorphous region approximately 1–2 cm2 corresponding to the area of the cortex targeted during the ablation experiment (Figure 2). There appears to be total absence of any tubules or other tissue structures within the lesion area.
Figure 2.
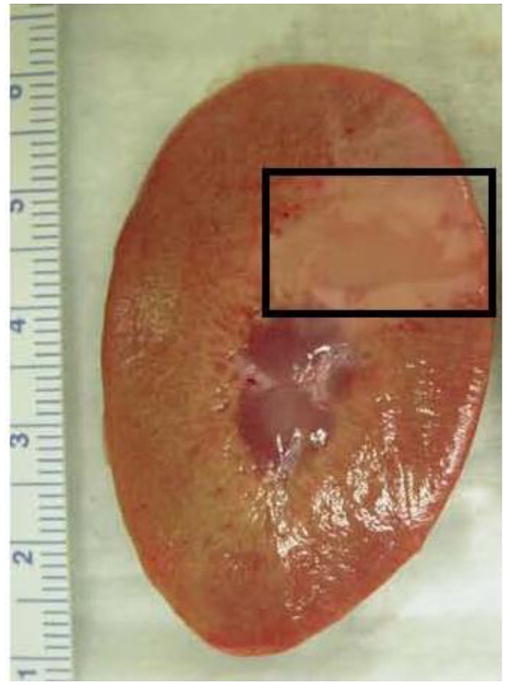
Cross section of the kidney cortex. Boxed area indicates the region where histotripsy was applied: this was determined by measuring the region’s proximity to the edge of the kidney and comparing its distance to that measured when viewed with ultrasound imaging.
Histology Examination
There appears to be a distinct boundary between fully intact and fractionated tissues (Figure 3). For the latter, no discernible cells and tubules are visible. Near the edge between the intact and fractionated regions are some clusters containing intact and partially fractionated cells.
Figure 3.
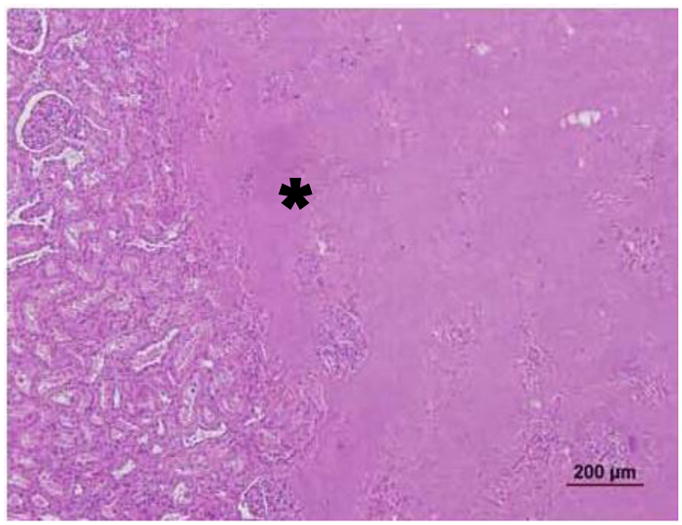
Histology of the kidney cortex showing an acellular treated area (asterisk) adjacent to normal appearing tissues consisting of tubules and glomeruli.
TEM Examination
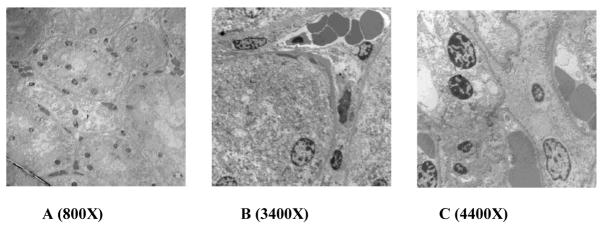
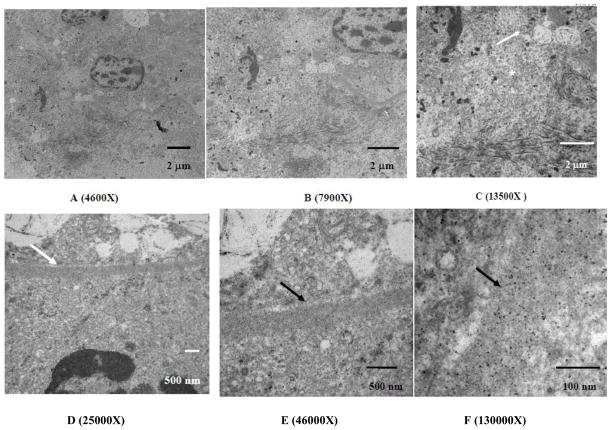
The histotripsy treated area showed little to no discernible features of cells or subcellular materials. The morphology of noticeable organelles includes pyknotic nuclei, fragments of mitochondria and basal lamina, while the cells and tissues approximately 10 μm outside of the treated areas appeared fully intact, similar to those of untreated controls (Figure 4). TEM images of an untreated intact kidney show the convoluted tubules and the interstitial vasculature fully intact (Figure 5A–C). In contrast, the TEM micrographs of the treated areas show significant disruption of the tissues, cells, and organelles (Figure 6A–C). The boundary beside the edge of the area completely homogenized ranges between 10 – 20 μm and provides a transition of the cellular materials’ disruption as they are subjected to histotripsy - greater disruption of cellular constituents closer to the treated area and more intact constituents further from the treated area. This is more evident at higher magnifications of 7,900X – 13,500X (Figures 6B and C, respectively). Starting from the fully intact region (all cells and subcellular materials’ morphology are clearly intact and discernible) and examining the 10 – 20 μm boundary near the fully homogenized region (all cells and subcellular materials are completely fractionated and no structures are discernible), we can assess the cells’ and organelles’ toughness. The nuclei, mitochondria, and keratin filaments still appear intact within the border closest to the treated area while the cell membranes appear only within the untreated area, evidence that they are fully fractionated within the boundary region. Approximately 4 μm away from the intact area, the cell nucleus is seen in a condensed pyknotic state, with fractionated materials surrounding it. The basal lamina appears structurally intact in one region of the intact tubule. Within the confines of the partially intact tubule, there is the presence of intact mitochondria – even within a few microns of the region which is fully fractionated. Within 5 μm of the fully intact area, keratin filaments are visible, often appearing in a state of disarray and surrounded by material which appears completely fragmented. Approximately 8–10 μm away from the fully intact area nuclei in a pyknotic state are visible followed by fractionation in the region closest to and within the treated zone. The center of the treated region appears fully homogenized, with no visible organelles.
Figure 4.
1450X Detail of the kidney cortex under TEM showing the margin between region affected by ultrasound (A) and the unaffected area (U). Note the nuclei in the affected region appear pyknotic and there is little presence of subcellular features compared to the unaffected region.
Figure 5.
TEM of untreated kidney cortex between 800X – 4400X, showing the intact convoluted tubules and red blood cells are clearly visible within the interstitial blood vessels. At higher magnification, the organelles are seen fully intact within the structural cells of each tubule and the cell membranes are also visible.
Figure 6.
TEM micrographs of the kidney cortex after histotripsy treatment at the border adjacent to the homogenized region. The material in the lower right in both micrographs is the remnant of the homogenized cells, with a fragment of pyknotic nucleus remaining. The upper half of images A and B shows a cell immediately adjacent to the homogenized area appearing to show a transition between homogenate and completely intact. At 13500X magnification (C), there is a noticeable change in the morphology between the fully intact mitochondria (arrow) and the fragmented mitochondria within the homogenized region (asterisk). The homogenized area also includes keratin fragments in the lower half of the image. Other sub-cellular constituents such as endoplasmic reticulum, Golgi, lysosomes, and the cell membrane are not visible within the homogenized area. Images of the basal lamina magnified between 25000X up to 130000X (D–F) show the basal lamina (arrows) appearing intact, with no transition of fractionation. This is in spite of being within the histotripsy-treated region where the sub-cellular material within its confines appears to have been been disrupted.
The TEM images of the affected regions adjacent to intact cells and tissues show extensive fragments of basal lamina present along with nuclei (occasionally pyknotic but with their architecture intact) and fragments of mitochondria and keratin filaments. Representative TEM images of the treated volumes showed no distinct cellular features even at > 100,000X magnification. The margin between the affected and unaffected tissue was approximately 3–5 μm between fully intact and fragmented tissues. Cells within the margins appeared partially or extensively disrupted, with little or no membranes present; the nuclei appeared pyknotic and often fragmented. The cells 5–10 μm beyond the marginal zone remained intact, with the additional presence of small, partially intact cell clusters within the treated regions. The convoluted tubules and blood vessels of an untreated control kidney appear fully intact with no remarkable features and no fractionation of the cells’ membrane or organelles.
The nuclei appear as the most robust sub-cellular component (Wang 2009). Intact, pyknotic, and fragmented nuclei were observed where other organelles were not found. The next set of robust organelles appears to be the basal lamina surrounding the individual convoluted tubules. The basal lamina first appear to partition from the surrounding tubules - evident by the micrographs showing the treated-untreated interface – followed by a form of fractionation which is yet undetermined. The images of the basal lamina do not show any evidence of fractionation after partitioning from the tubules and the fragments (taken within the treated region) imaged at magnifications >100,000X still do not show any stages of decomposition (Figure 6D–F).
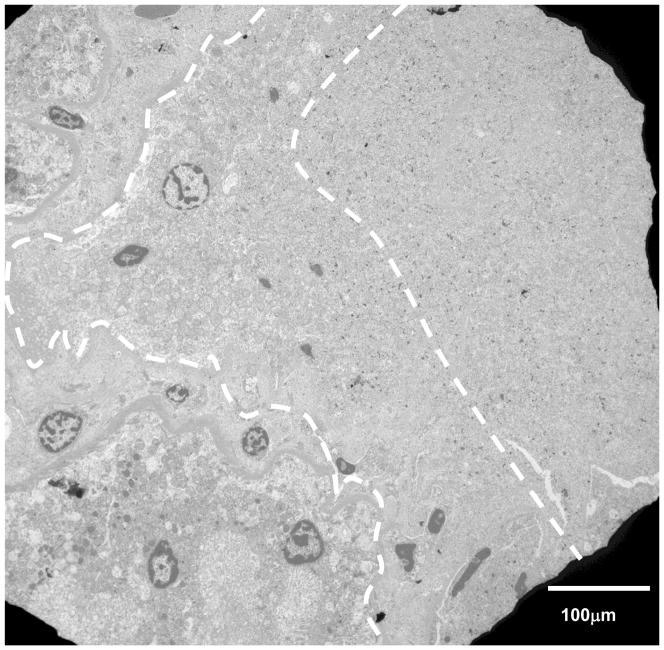
The representative set of TEM images at magnifications between 620X – 1,450X all display the border with similar features: a distance of approximately 10 μm separates the sub-cellular features between those fully intact and those that are fully fractionated (Figure 7). Based on the classification scheme detailed under Table 1, this 10 μm distance shows the morphological transitions in the sub-cellular features exposed to the histotripsy: starting from the fully intact region (classification “0” - indistinguishable from normal untreated cells), then moving toward the treated area, a gradual breakdown in the structural components of the cells is seen (classification “1–4” – increasing damage to organelles and pyknosis of nuclei due to mechanical disruption). This leads ultimately to fully homogenized tissue with no distinguishable cells or cellular organelles (classification “5”).
Figure 7.
TEM micrograph of the kidney cortex at 1450X magnification. The dashed white lines represent the approximate boundary between the treated and untreated regions and a transition in the morphology of the subcellular material is clearly evident: there is a clear absence of membranes and other subcellular features. Nuclei appear pyknotic and there is less presence of mitochondria (the two more robust organelles). To the right of the region, there are less recognizable subcellular features; to the left, the cellular material is more clearly defined.
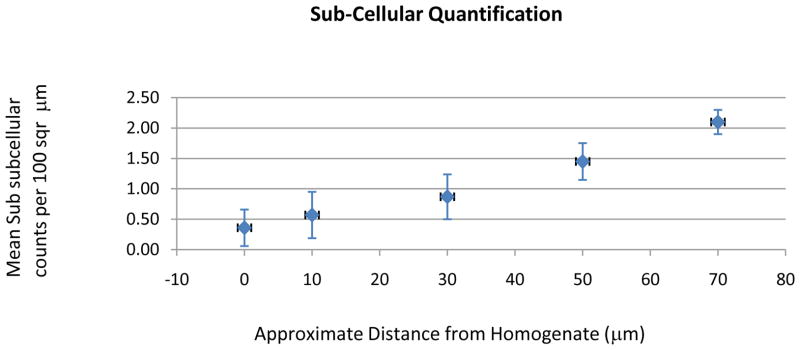
A one-way ANOVA correlating the mean number of sub-cellular components per 100 μm2 within the kidney tissues to the average distance from the treated region shows a distinct transition of fragmentation among the organelles (Figure 8). The mean sub-cellular counts are almost non-existent (0–1 counts/100 μm2) in areas closest to the homogenate (0–30 μm). Between 50–70 μm from the homogenate, the mean number of sub-cellular components increases approximately 1.50 – 2.0 counts/100 μm2. In addition, the four principal organelles examined showed different degrees of fractionation when exposed to histotripsy at different distances from the treated zones (Figure 9A–C). A correlation is seen between how visibly intact and recognizable the different organelles are with respect to their distances from the treated regions. The border distance between 10–20 μm from the intact region is where the condition of sub-cellular materials transitions into stages of fragmentation and the quantity of different visible organelles begin to decline. Distances 20–30 μm show the counts dropping to an insignificant amount; a distance greater than 30 μm within the treated zone shows no counts of any visible intact organelles.
Figure 8.
Data correlating the mean number of sub-cellular components per 100 μm2 within the kidney tissues to the average distance from the treated region. The data is based on n = 4.
Figure 9.
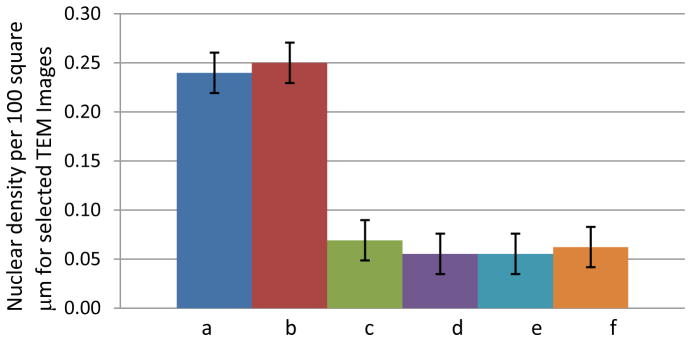
Figure 9A. Comparing nuclear densities per 100 μm2 between the untreated control kidneys (a-b) and treated areas adjacent to the homogenate border (c–f); n = 4 for each organelle.
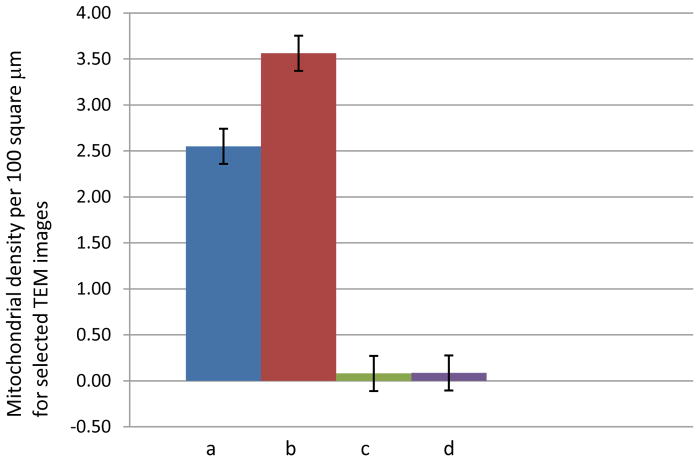
Figure 9B. Comparing mitochondrial densities per 100 μm2 between the untreated control kidneys (a–b) and treated areas adjacent to the homogenate border (c–d); n = 4 for each organelle.
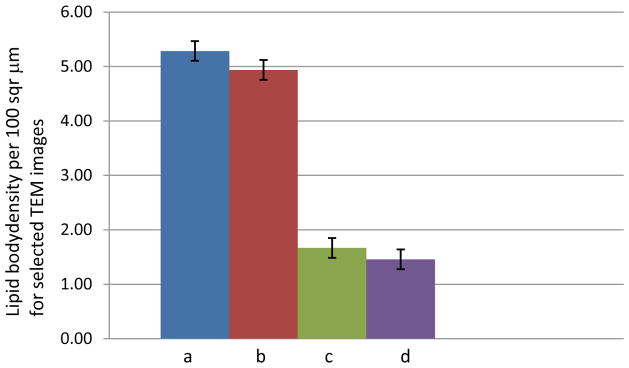
Figure 9C. Comparing lipid body densities per 100 μm2 between the untreated control kidneys (a–b) and treated areas adjacent to the homogenate border (c–d); n = 4 for each organelle.
For Figure 9A–C, the number of individual organelles within the aforementioned boundary were counted and averaged with their standard deviations. Three principal organelles – nuclei, mitochondria, and nuclei – showed decreases in their population densities: 2.5/100 μm2 for nuclei, 3.5/100 μm2 for lipid bodies, and 35/100 μm2 for the mitochondria. These densities were derived from organelles which were found fully intact within the EM images. In the cases of the mitochondria and lipid bodies, the treated lesions showed negligible to no visible structures, either intact or partially fragmented. Figure 9b and 9c (mitochondria and lipid bodies, respectively) have no e and f bar graphs since these organelles were not visible after a certain distance within the images, compared to the nuclei.
Discussion and Summary
Based on the TEM images, histotripsy has been shown to be an effective non-thermal mechanical method of tissue ablation, providing precise fractionation of targeted tissues while minimizing damage to surrounding unaffected cells and tissues. This method potentially has clinical benefits for noninvasive surgery requiring tissue ablation.
Other minimally invasive methods to produce tissue damage from therapeutic applications include high intensity focused ultrasound (HIFU), radiofrequency ablation (RFA), cryosurgery, and extracorporeal shockwave lithotripsy. These methods sometimes have difficulty in treating only the targeted tissues while sparing healthy regions from damage (Warner 1999, Nikfarjam 2005, Ozaki 2003a, Rabkin, 2005, Nakata 1998). Thermally treated lesions have shown collateral damage outside treated areas – visible in their TEM micrographs - which may affect the normal physiological function of the surrounding tissues and organs. The TEM images for the histotripsy lesions display a narrow, distinct boundary of several microns between the treated and untreated areas. Within the confines of the boundary, we see the cells and sub-cellular constituents in transitions between fully intact and completely homogenized.
While examining the morphology of the intact sub-cellular structures does provide evidence of histotripsy’s precision in ablating only the targeted tissue region, it does not show whether these structures are still living or not. Certainly cells which are fragmented or have pyknotic nuclei are clearly either dead or necrotic. However, cells and tissues which appear structurally intact may in fact be undergoing necrosis as a result of collateral damage due to histotripsy exposure. Although the TEM micrographs provide visual evidence that cells and tubules of the renal cortex outside of the treated zone are intact, it is not known at this time whether the structures are alive and functional. How histotripsy may affect malignant lesions – whether it could promote or decrease metastasis – is still unknown. These mechanisms and the long-term outcomes of histotripsy are currently being investigated.
Processing of the tissues for TEM examination will also affect the structures of the renal cortex. Further studies are needed to assay for any biological activity of cells and tissues near the boundary such as immunohistochemistry, flow cytometry, and TUNEL stains to detect apoptosis/necrosis (Labat-Moleur 1998, Glamoclija 2005). Additional methods, such as assaying of cells for different degrees of DNA fragmentation (Zhivotovsky 2001), are required to better assess their survival following histotripsy exposure. Although we have quantified and characterized the visible damage patterns from histotripsy using high-powered microscopy methods, we currently do not know the conditions of the intact cells and tissues immediately adjacent to the treated regions. These cannot be determined by solely examining the cells’ morphologies and ultrastructures.
Acknowledgments
The authors would like to thank Mr. Chris Edwards and Ms. Dorothy Sorenson of the Microscopy and Imaging Analyses Laboratory, University of Michigan Medical Center, Ann Arbor, MI. for their assistance in this study.
This work is supported by grants from NIH (R01 HL077629, R01 EB008998, and R01 CA134579) and support from the Wallace H. Coulter Foundation.
Footnotes
Publisher's Disclaimer: This is a PDF file of an unedited manuscript that has been accepted for publication. As a service to our customers we are providing this early version of the manuscript. The manuscript will undergo copyediting, typesetting, and review of the resulting proof before it is published in its final citable form. Please note that during the production process errors may be discovered which could affect the content, and all legal disclaimers that apply to the journal pertain.
References
- Anderson CD, Lin W-C, Beckham J, Mahadevan-Jansen A, Buttemere CR, Pierce J, Nicoud IB, Pinson CW, Chari RS. Fluorescence Spectroscopy Accurately Detects Irreversible Cell Damage During Hepatic Radiofrequency Ablation. Surgery. 2004 Sep;136(3):524–31. doi: 10.1016/j.surg.2004.05.035. [DOI] [PubMed] [Google Scholar]
- Back W, Kohrmann KU, Bensemann J, Rassweiler J, Alken P. Histomorphologic and Ultrastructural Findings of Shockwave-Induced Lesions in the Isolated Perfused Kidney of the Pig. J Endourol. 1994;8(4):257–261. doi: 10.1089/end.1994.8.257. [DOI] [PubMed] [Google Scholar]
- Crosier AE, Farin PW, Dykstra MJ, Alexander JE, Farin C. Ultrastructural Morphometry of Bovine Blastocysts Produced In Vivo or In Vitro. Biol Reprod. 2001;64:1375–1385. doi: 10.1095/biolreprod64.5.1375. [DOI] [PubMed] [Google Scholar]
- Glamoclija V, Vilović K, aga-Babić M, Baranović A, Sapunar D. Apoptosis and Active Caspase-3 Expression in Human Granulosa Cells. Fertil Steril. 2005;83:426–31. doi: 10.1016/j.fertnstert.2004.06.075. [DOI] [PubMed] [Google Scholar]
- Hsu THS, Fidler ME, Gill IS. Radiofrequency Ablation of the Kidney: Acute and Chronic Histology in Porcine Model. Urol. 2000;56:872–875. doi: 10.1016/s0090-4295(00)00737-8. [DOI] [PubMed] [Google Scholar]
- Kieran K, Hall TL, Parsons JEJ, Wolf JS, Fowlkes JB, Cain CA, Roberts WW. Refining Histotripsy: Defining the Parameter Space for the Creation of Nonthermal Lesions With High Intensity, Pulsed Focused Ultrasound of the In Vitro Kidney. J Urol. 2007;178:672–676. doi: 10.1016/j.juro.2007.03.093. [DOI] [PubMed] [Google Scholar]
- Labat-Moleur F, Guillermet C, Lorimier P, Robert C, Lantuejoul S, Brambilla E, Negoescu A. TUNEL Apoptotic Cell Detection in Tissue Sections: Critical Evaluation and Improvement. J Histochem Cytochem. 1998;46:327–334. doi: 10.1177/002215549804600306. [DOI] [PubMed] [Google Scholar]
- Lake AM, Xu Z, Wilkinson JE, Cain CA, Roberts WW. Renal Ablation by Histotripsy: Does it Spare the Collecting System? J Urol. 2008;179:1150–1154. doi: 10.1016/j.juro.2007.10.033. [DOI] [PubMed] [Google Scholar]
- Lu J, Ye Z, Wang W, Chen Z, Zhang Y, Hu W. Experimental Study on the Effect of High-Intensity Focused Ultrasound (HIFU) Using Sonablate-500 in the Ablation of Canine Prostate. J Huazhong Univ Sci Technolog Med Sci. 2007;27(2):193–6. doi: 10.1007/s11596-007-0223-x. [DOI] [PubMed] [Google Scholar]
- Luo W, Zhou X, Gong X, Zheng M, Zhang J, Guo X. Study of Sequential Histopathologic Changes, Apoptosis, and Cell Proliferation in Rabbit Livers After High-Intensity Focused Ultrasound Ablation. J Ultrasound Med. 2007;26:477–485. doi: 10.7863/jum.2007.26.4.477. [DOI] [PubMed] [Google Scholar]
- Matlaga BR, Zagoria RJ, Clark PE, Hall MC. Radiofrequency Ablation of Renal Tumors. Curr Urol Rep. 2004;5(1):39–44. doi: 10.1007/s11934-004-0010-1. [DOI] [PubMed] [Google Scholar]
- Nakata SY, Lee FT, Warner T, Chosy SG, Moon TD. Laparoscopic Cryosurgery Study of the Kidney in the Porcine Model: An Acute Histological Study. Urology. 1998;51(Suppl 5A):161–166. doi: 10.1016/s0090-4295(98)00080-6. [DOI] [PubMed] [Google Scholar]
- Nikfarjam M, Muraliharan V, Christophi C. Mechanisms of Focal Heat Destruction of Liver Tumors. J Surg Res. 2005;127:208–223. doi: 10.1016/j.jss.2005.02.009. [DOI] [PubMed] [Google Scholar]
- Ozaki T, Tabuse K, Tsuji T, Nakamura Y, Kakudo K, Mori I. Microwave Cell Death: Enzyme Histochemical Evaluation for Metastatic Carcinoma of the Liver. Pathol Int. 2003;53(12):837–45. doi: 10.1046/j.1440-1827.2003.01571.x. [DOI] [PubMed] [Google Scholar]
- Ozaki T, Mori I, Nakamura M, Utsunomiya H, Tabuse K, Kazudo K. Microwave Cell Death: Immunohistochemistry and Enzyme Histochemical Evaluation. Pathol Eval. 2003;53:686–692. doi: 10.1046/j.1440-1827.2003.01537.x. [DOI] [PubMed] [Google Scholar]
- Parsons JE, Cain CA, Fowlkes JB. Cost-Effective Assembly of a Basic Fiber-Optic Hydrophone for Measurement of High-Amplitude Therapeutic Ultrasound Fields. J Acoust Soc Am. 2006b;119:1432–1440. doi: 10.1121/1.2166708. [DOI] [PubMed] [Google Scholar]
- Parsons JE, Cain CA, Abrams GD, Fowlkes JB. Pulsed Cavitational Ultrasound Therapy for Controlled Tissue Homogenization. Ultrasound in Med & Biol. 2006;32:115–129. doi: 10.1016/j.ultrasmedbio.2005.09.005. [DOI] [PubMed] [Google Scholar]
- Prentice P, Cuschieri A, Dholakia K, Prausnitz M, Campbell P. Membrane Disruption by Optically Controlled Microbubble Cavitation. Nat Phys. 2005;1:107–110. [Google Scholar]
- Rabkin BA, Vesna Zderic V, Vaezy S. Hyperecho in Ultrasound Images of HIFU Therapy: Involvement of Cavitation. Ultrasound Med Biol. 2005;31 (7):947–956. doi: 10.1016/j.ultrasmedbio.2005.03.015. [DOI] [PubMed] [Google Scholar]
- Roberts WW, Hall TL, Ives K, Wolf JS, Jr, Fowlkes JB, Cain CA. Pulsed Cavitational Ultrasound: A Noninvasive Technology for Controlled Tissue Ablation (Histotripsy) in the Rabbit Kidney. J Urol. 2006;175:734–738. doi: 10.1016/S0022-5347(05)00141-2. [DOI] [PubMed] [Google Scholar]
- Sindelar WF, Javadpour N, Bagley DH. Histological and Ultrastructural Changes in Rat Kidney After Cryosurgery. J Surg Oncol. 1981;18:363–379. doi: 10.1002/jso.2930180406. [DOI] [PubMed] [Google Scholar]
- Susani M, Madersbacher S, Kratzik C, Vingers L, Marberger M. Morphology of Tissue Destruction Induced by Focused Ultrasound. Eur Urol. 1993;23(suppl 1):34–38. doi: 10.1159/000474677. [DOI] [PubMed] [Google Scholar]
- Tran BC, Seo J, Hall TL, Fowlkes JB, Cain CA. Microbubble-Enhanced Cavitation for Noninvasive Ultrasound Surgery. IEEE Transactions on Ultrasonics Ferroelectrics & Frequency Control. 2003;50:1296–1304. doi: 10.1109/tuffc.2003.1244746. [DOI] [PubMed] [Google Scholar]
- Van Leenders GJLH, Beerlage HR, Ruilter ETh, de la Rosette JJMCH. Histopathological Changes Associated With High Intensity Focused Ultrasound (HIFU) Treatment for Localised Adenocarcinoma of the Prostate. J Clin Pathol. 2000;53:391–394. doi: 10.1136/jcp.53.5.391. [DOI] [PMC free article] [PubMed] [Google Scholar]
- Wang T-Y, Xu Z, Winterroth F, Hall TL, Fowlkes JB, Rothman EE, Roberts WW, Cain CA. Quantitative Ultrasound Backscatter for Pulsed Cavitational Ultrasound Therapy- Histotripsy. IEEE Transactions on Ultrasonics, Ferroelectrics, and Frequency Control. 2009;56(5):995–1005. doi: 10.1109/tuffc.2009.1131. [DOI] [PMC free article] [PubMed] [Google Scholar]
- Warner TF, Nakata SY, Lee FT, Salisbury S, Chosy SG, Moon TD. Mucinous Vacuolar Change of Porcine Urothelium Induced by Regional Embolism or Cryoablation. Vet Pathol. 1999;36:167–170. doi: 10.1354/vp.36-2-167. [DOI] [PubMed] [Google Scholar]
- Xu Z, Fan Z, Hall TL, Winterroth F, Fowlkes JB, Cain CA. Size Measurement of Tissue Debris Particles Generated from Pulsed Ultrasound Cavitational Therapy-Histotripsy. Ultrasound Med Biol. 2009 Feb;35(2):245–55. doi: 10.1016/j.ultrasmedbio.2008.09.002. [DOI] [PMC free article] [PubMed] [Google Scholar]
- Xu Z, Fowlkes JB, Ludomirsky A, Cain CA. Investigation of Intensity Thresholds for Ultrasound Tissue Erosion. Ultr Med Biol. 2005;31(12):1673–1682. doi: 10.1016/j.ultrasmedbio.2005.07.016. [DOI] [PMC free article] [PubMed] [Google Scholar]
- Young IT, Verbeek PW, Mayall BH. Characterization of Chromatin Distribution in Cell Nuclei. Cytometry. 1986;7:467–474. doi: 10.1002/cyto.990070513. [DOI] [PubMed] [Google Scholar]
- Zhivotovsky B, Orrenius S. Assessment of Apoptosis and Necrosis by DNA Fragmentation and Morphological Criteria. Current Protocols in Cell Biology. 2001:18.3.1–18.3.23. doi: 10.1002/0471143030.cb1803s12. [DOI] [PubMed] [Google Scholar]


