Abstract
The mechanism of antimalarial action of [Au(CQ)(PPh3)] PF6 (1), which is active in vitro against CQ-resistant P. falciparum and in vivo against P. berghei, has been investigated in relation to hemozoin formation and DNA as possible important targets. Complex 1 interacts with heme and inhibits β-hematin formation both in aqueous medium and near water/n-octanol interfaces at pH ~ 5 to a greater extent than chloroquine diphosphate (CQDP) or other known metal-based antimalarial agents; the higher inhibition activity is probably related to the higher lipophilicity observed for 1 through partition coefficient measurements at low pH, with respect to CQDP. The interactions of complex 1 with DNA were explored using spectrophotometric and fluorimetric titrations, circular dichroism spectroscopy, viscosity and melting point studies, as well as electrophoresis and covalent binding assays. The experimental data indicate that complex 1 interacts with DNA predominantly by intercalation and electrostatic association of the CQ moiety, similarly to free CQDP, while no covalent metal-DNA binding seems to take place. The most likely antimalarial mechanism for complex 1 is thus heme aggregation inhibition; the high activities observed against resistant parasites are probably due to the structural modification of CQ introduced by the presence of the gold-triphenylphosphine fragment, together with the enhanced lipophilic character.
Keywords: Malaria, Resistance, Plasmodium falciparum, Chloroquine, Gold, β-Hematin, Partition coefficient, DNA
1. Introduction
Malaria is a widespread parasitic disease and a leading cause of morbidity in tropical and subtropical regions. According to the World Health Organization, it affects over 240 million people and threatens more than one billion people around the world every year [1,2]. This situation is exacerbated by the fact that existing cheap drugs such as chloroquine (CQ) are no longer effective due to the emergence of resistance; CQ was for decades one of the most successful drugs ever used to treat an infectious disease, due its low cost, high efficacy and lack of significant side effects [3]. The loss of activity of CQ is a major setback for the effective control of malaria and consequently, current therapeutic tools are very limited; therefore, new anti-malarial drugs, preferably with new structures and/or modes of action, are urgently needed.
Malaria parasites invade red blood cells (RBC), where they degrade hemoglobin inside an acidic digestive vacuole; as a result of digestion heme is released, which is toxic to the parasite; its natural defense mechanism consists of oxidation to ferriprotoporphyrin followed by aggregation into a less toxic form called hemozoin or malaria pigment [4,5]. There is strong evidence suggesting that hemozoin forms spontaneously and rapidly at water/lipid interfaces within the digestive vacuole [6,7]. Inhibition of heme aggregation is widely accepted as the main mechanism of action of 4-aminoquinoline drugs, including CQ [4]. Although the precise mechanism of CQ resistance is not yet fully understood, it is associated to mutations within the pfcrt gene, which encodes the pfcrt protein located at the membrane of the food vacuole; once mutated this protein acts as a transporter capable of extruding CQ from the digestive vacuole [4,8–10]. Because of the specific mutation involved, the ability of compounds to be expelled by pfcrt decreases with increasing lipophilicity of the drug and it is also dramatically affected by particular structural features of the compounds [10–12].
We have previously demonstrated that attaching a metal-containing fragment (e.g. Rh [13] or Ru [13,14]) to CQ results in a strong modification of the physicochemical properties of the drug, which in turns leads to an enhanced activity against resistant strains of Plasmodium falciparum. More recently, a series of compounds of general formula Ru(η6-arene)(CQ)L2 and [Ru(η6-p-cymene)(η6-CQDP)][BF4]2 (CQDP = chloroquine diphosphate) were shown to be considerably more active than CQDP against CQ-resistant Dd2, K1 and W2 P. falciparum [14], through a combination of increased lipophilicity and structural changes of the parent drug [15]. We have also reported that the complex [Au(PPh3)(CQ)]PF6 (1, Fig. 1) causes a marked inhibition of the in vitro growth of CQ-resistant FcB1 and FcB2 P. falciparum, up to 10-fold higher than that promoted by CQDP, complex 1 is also about twice as active against P. berghei (rodent malaria) in vivo as CQDP, with no evidence of acute toxic responses [16].
Fig. 1.
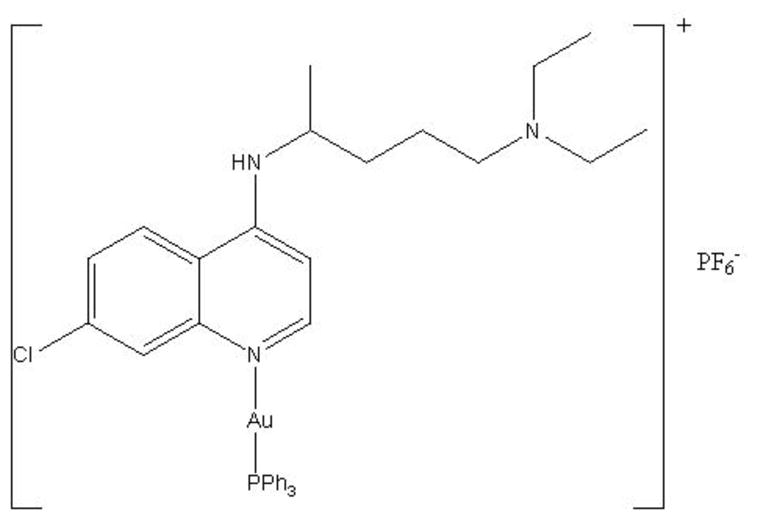
Structure of [Au(CQ)(PPh3)]PF6 (1).
This significant enhancement of activity of CQ against resistant parasites caused by coordination to gold stimulated the present study of the possible mechanisms of action of this promising compound. Two potential targets have been evaluated, i.e. hemozoin formation and DNA [17]. The most widely accepted mode of action of CQ is the interference with heme aggregation to hemozoin [18], which allows accumulation of toxic levels of heme resulting in parasite death [1,7,19]. Several other possibilities have been proposed such as inhibition of DNA and RNA synthesis or of protein synthesis, but these explanations seem unlikely since the concentrations of drug required for a lethal effect on the parasite would have to be much higher than those observed in vivo [20]. On the other hand, metal-based drugs are known to interact with DNA; therefore, the presence of a gold atom in the structure of our CQ derivative could open the possibility of DNA interactions with a significant effect on the antimalarial activity.
In this paper, we describe the ability of complex 1 to inhibit β-hematin formation, particularly at water-octanol interfaces, and to interact with DNA, and discuss the implications of both processes in the mechanism of antimalarial action of the [Au(PPh3)(CQ)]PF6 complex.
2. Materials and methods
2.1. General
All manipulations were carried out under N2 using common Schlenk techniques. Solvents were purified by standard procedures immediately prior to use. Complex 1 was prepared according to the literature [16]. Calf thymus (CT) DNA, chloride hemin, buffers and solvents were purchased from Sigma-Aldrich. All other commercial reagents were used without further purification. IR spectra were obtained with a Nicolet 5DCX FT instrument. Spectrophotometric studies and thermal denaturation experiments were performed on an Agilent 8453 diode-array spectrophotometer equipped with a HP 89090 Peltier temperature control accessory. Circular dichroism (CD) spectra were recorded on a Chirascan spectrometer, 150W xenon arc lamp. Steady-state fluorescence measurements were carried out using a photon technology international (PTI), fluorescence master system A1010B arc lamp, LBS 220B lamp power supply, 814 photomultiplier detection system. Metal analysis was performed on a Perkin Elmer Optimal 3000 Inductively Coupled Plasma (ICP) Emission Spectrometer, samples and standards were prepared in 10% HCl. Standards were prepared diluting a 1000 mg/L gold standard solution from Sigma, the samples were heated in a water bath at 70°C for 30 min before analyzing. In the β-hematin formation inhibition assay, plates were centrifuged using a Thermo Scientific IEC CL 30 centrifuge, and measured in a Tecan Sunrise Absorbance Reader at 405 nm.
2.2. Interaction with hematin
The association constant of [Au(CQ)(PPh3)]PF6 with Ferriprotoporphyrin IX (Fe(III)PPIX) was measured as described previously [21]. Briefly, a stock solution of hemin was prepared by dissolving 3.5 mg of hemin in 15 mL DMSO. Aqueous-DMSO (40% v/v) solutions of Fe(III)PPIX (pH 7.5) were prepared daily by mixing 140 μL hemin stock solution with 4 mL DMSO and 1 mL 0.2 M Tris buffer (pH 7.5) and completed to 10 mL with doubly distilled deionized water. The concentration of Fe(III)PPIX in this solutions was 4μM and absorbance readings were recorded at 402 nm. The reference cell containing 40% v/v DMSO, 0.020 M Tris pH 7.5 was also titrated with [Au(CQ)(PPh3)]PF6 in order to blank out the absorbance of the drug. The data were fitted to the equation A = (A0 + A∞K[C])/(1 + K[C]) for a 1:1 complexation model using nonlinear least squares fitting, strictly following the procedure of Egan et al. [21], with omission of the first few data points at very low drug-to-hematin ratio, where the fit is poor. A0 is the absorbance of hemin before addition of complex 1 or CQDP, A∞ is the absorbance for the drug–hemin adduct at saturation, A is the absorbance at each point of the titration, and K is the conditional association constant.
2.3. Inhibition of β-hematin formation
The transformation of hemin to β-hematin in acidic acetate solutions was studied using infrared spectroscopy using the method developed by Egan [22]. The IC50 of β-Hematin formation in buffer assay was performed according to Dominguez [23]. Briefly, a solution of hemin (50 μL, 4 mM), dissolved in DMSO, was distributed in 96-well micro plates. The complex was dissolved in DMSO and added in triplicate in test wells (50 μL) to final concentrations of 0 - 20 mM/well. Controls contained water and DMSO. Hemozoin formation was initiated by the addition of acetate buffer (100 μL 0.2 M, pH 4.4). Plates were incubated at 37 °C for 48 h to allow completion of the reaction and centrifuged at 4000 RPM × 15 min. After discarding the supernatant, the pellet was washed twice with DMSO (200 μL) and finally dissolved in NaOH (200 μL, 0.2 N). The solutions were further diluted 1:2 with NaOH (0.1 N) and absorbance recorded at 405 nm. The results were expressed as a percentage of inhibition of hemozoin formation.
β-Hematin formation at a water/octanol interface was followed according to a method proposed by Egan and coworkers [24] and modified by Martínez et al. [14]. Hemin was dissolved in 0.1 M NaOH solution to generate hematin and acetone was added until the acetone:water ratio was 4:6; the final solution contained 15 mg hematin/mL. A sample of this solution (200 μL) was carefully introduced close to the interface between n-octanol (2 mL) and aqueous acetate buffer (5 mL, 8M; pH 4.9) in a cylindrical vial with an internal diameter of 2.5 cm. The mixture was incubated at 37 ºC for 2 h and at the end of the incubation the product (β-hematin) was isolated by centrifugation. The pellet was collected and washed twice with DMSO (2 mL), centrifuged again for 20 min, washed with 2 mL of ethanol and finally dissolved in 25 mL of 0.1 M NaOH for spectrophotometric quantification. For the heme aggregation inhibition activity measurements the appropriate amount of the drug (23 mM in DMSO) was dissolved; after stirring for 30 min to equilibrate the drug between the two phases, the hematin solution was added close to the interface and the procedure was followed as described above. All experiments were performed in triplicate.
2.4. Distribution coefficient (D)
The water-octanol distribution coefficients were determined by use of the stir-flask method [25–27]; water-saturated octanol and octanol-saturated water were prepared by shaking equal volumes of octanol and water for one week and allowing the mixture to separate into the respective phases. An UV-visible calibration curve for complex 1 in octanol-saturated water in the range 2–50 μM was prepared. A mixture of 10 mL n-octanol and 10 mL of water (each saturated in the other) was stirred for 2 h at 37°C, after adding the right amount of the sample to be analyzed. The pH was maintained at 5.1 (MES : 20 mM 2-(N-morpholino)ethanesulfonic acid buffer) and pH 6.9 (Tris-HCl: 20 mM). Once the equilibrium was reached, the organic and aqueous phases were separated and centrifuged. Finally, the concentration of drug in each phase was measured spectrophotometrically in order to determine values of D = [drug](in octanol)/[drug](in water). Experiments were carried out in triplicate [28].
2.5. DNA interaction studies
The absorption titrations were carried out by stepwise additions of a calf thymus (CT) DNA solution (1 mM, in 5 mM Tris-HCl (pH 7.2) and 50 mM NaCl buffer) to a solution of complex 1 (65 μM) in DMSO, and recording the UV –vis spectra at 330 and 343 nm after each addition. The absorption of DNA was subtracted by adding the same amounts of CT DNA to the blank. The binding affinities were obtained by using the Scatchard equation r/Cf = K(n−1) for ligand-macromolecule interactions with non-cooperative binding sites [29–32], where r is the number of moles of Au complex bound to 1 mol of CT DNA (Cb/CDNA), n is the number of equivalent binding sites, and K is the affinity of the complex for those sites. Concentrations of free (Cf) and bound (Cb) complex 1 were calculated from Cf = C(1−α) and Cb = C−Cf, respectively, where C is the total Au concentration. The fraction of bound complex (α) was calculated according to α = (Af−A)/(Af−Ab), where Af and Ab are the absorbance of the free and fully bound complex 1 at the selected wavelength, and A is the absorbance at any given point during the titration. Kb is obtained from the slope of the plot [33].
To measure the interaction of complex 1 with CT DNA by fluorimetric titration the excitation and emission wavelengths for the complex were set to 343 and 380 nm, respectively. Using standard right-angle emission optics, we recorded fluorescence intensity measurements using the photon counting mode and corrected for any fluctuations of the 450-W xenon arc lamp source by deflecting a portion of the excitation signal onto a separate photodiode. The fluorimetric titration was carried out at room temperature. The complex was dissolved in a buffer consisting of 70% DMSO and 30 % Tris-HCl (5 mM Tris-HCl and 50 mM NaCl; pH 7.4) to obtain a 700 μM solution. 20 μL of that stock solution were then diluted with 1980 μL of the same buffer in a quartz cuvette and then titrated with 10 μL additions of a 90 μM solution of CT DNA (in 5 mM Tris-HCl (pH 7.2) plus 50 mM NaCl buffer). Emission spectra were monitored at 380 and 550 nm until saturation was reached. The binding affinities were obtained by using the Scatchard equation r/Cf = K(n−1).
Viscosity measurements were carried out by using an Ostwald viscometer, immersed in a water bath maintained at 25 °C. DNA concentration (75 μM in 5 mM Tris-HCl (pH 7.2) plus 50 mM NaCl buffer) were kept constant in all samples, but the concentration of 1 was increased from 0 to 75 μM. The flow time was measured at least 6 times with a digital stopwatch and the mean value was used. Data are presented as (η/η0)1/3 versus the ratio [complex]/[DNA], where η and η0 are the specific viscosity of DNA in the presence and absence of the title complex, respectively. The values of η and η0 were calculated by the expression (t − tb)/tb, where t is the observed flow time and tb is the flow time of buffer alone. Relative viscosities of DNA were calculated by means of (η/η0) [34].
For DNA electrophoresis assays, samples of 10 μL of the plasmid pBR322 (20 μg/mL) were combined with the complex at different ratios and then incubated for 18 h at 37 °C. Five μL of each sample were run (100 mV for 45 min) on a 1% agarose gel with TBE-1X (0.45 M Tris-HCl, 0.45 M boric acid, 10 mM EDTA) and stained with of ethidium bromide (5 μL ethidium bromide per 50 mL agarose gel mixture). The bands were then viewed with a trans-luminator and the image captured with a videocamera [35].
Melting curves were recorded in 5 mM Tris-HCl buffer (pH 7.29) containing 50 mM NaCl. The absorbance at 260 nm was monitored for solutions of CT DNA (3mL, 70 μM in 5 mM Tris-HCl (pH 7.2) plus 50 mM NaCl buffer) before and after incubation with a solution of the drug under study (35 μM) for 1 h at room temperature. The temperature was increased by 0.5 ºC/min between 40 and 55ºC and by 3ºC/min between 55 and 70ºC and between 70 and 90ºC [36].
A stock solution (5 mM) of complex 1 was freshly prepared in DMSO prior to use. The right volume of that solution was added to 3 mL samples of an also freshly prepared solution of CT DNA (195 μM) in Tris-HCl buffer (5 mM Tris-HCl, 50 mM NaCl, pH=7.29) to achieve molar ratios of 0, 0.5, 1.0 drug/DNA. The samples were incubated at 37ºC for a period of 18 h. All CD spectra of DNA and of the DNA-drug adducts were recorded at 25ºC over a range 220–330 nm and finally corrected with a blank and noise reduction. The final data is expressed in molar ellipticity (millidegrees) [37].
For the covalent binding studies, 1 mL of complex 1, 0.2 mM in DMSO was mixed with 1 mL CT DNA 1mM in Tris-HCl buffer (5 mM Tris-HCl, 50 mM NaClO4, pH=7.29) and incubated for 72 h. Samples were then transferred to 50-mL core centrifuge tubes. DNA was precipitated by adding EtOH (twice sample volume) and 2 M NaCl (0.1 times the sample volume). The tubes were centrifuged and the supernatant decanted. Excess liquid was removed by standing the tubes upside down for several minutes and then the DNA was resuspended overnight in water. This precipitation–resuspension cycle was typically repeated three times and the final suspension was analyzed for Au by IPC emission spectrometry and for DNA by the Burton assay [38].
3. Results and discussion
In previous publications [16,39], we have demonstrated that binding CQ to gold in the complex [Au(CQ)(PPh3)]PF6 (1) and other related compounds [40], results in an enhancement of the in vitro potency against CQ-resistant strains of P. falciparum and a high in vivo activity against P. berghei (rodent malaria) without any evidence for acute toxic effects even after prolonged treatment. Similarly, Ru-CQ complexes [41], and notably ferroquine [42] have been shown to be active against resistant malaria parasites and they seem to retain heme aggregation inhibition as the principal mechanism of action. It is thus reasonable to assume that in the case of Au-CQ complexes, heme aggregation may also be an important target. Also, the presence of a metal atom in the structure of a potential drug opens the possibility of DNA binding as an alternative or secondary mechanism of antimalarial action. In order to ascertain the most likely mechanism of action of complex 1, particularly against resistant parasites, a combination of experiments targeting heme and DNA have been performed, as described in the following sections.
3.1. Interaction with hemin and inhibition of β-hematin formation
The interaction of complex 1 with Fe(III)PPIX was followed by spectrophotometric titration at the Soret band at 402 nm as shown in Fig. 2. When the concentration of complex 1 was increased to saturation, the hypochromism reached approximately 70%. Following the procedure described before and data fitting for a 1:1 association model (with omission of the first few data points), we measured values of log K = 5.84 ± 0.01 for CQDP (at pH 7.4), in good agreement with the values reported by Biot et al. [43] and Sánchez-Delgado [14]. The data for complex 1 were fitted in a strictly analogous manner to yield values of log K = 7.69 ± 0.01 at pH 7.4 (for further details see Experimental section). This indicates that the Au–CQ complex interacts with hematin more strongly than CQDP under these conditions.
Fig. 2.
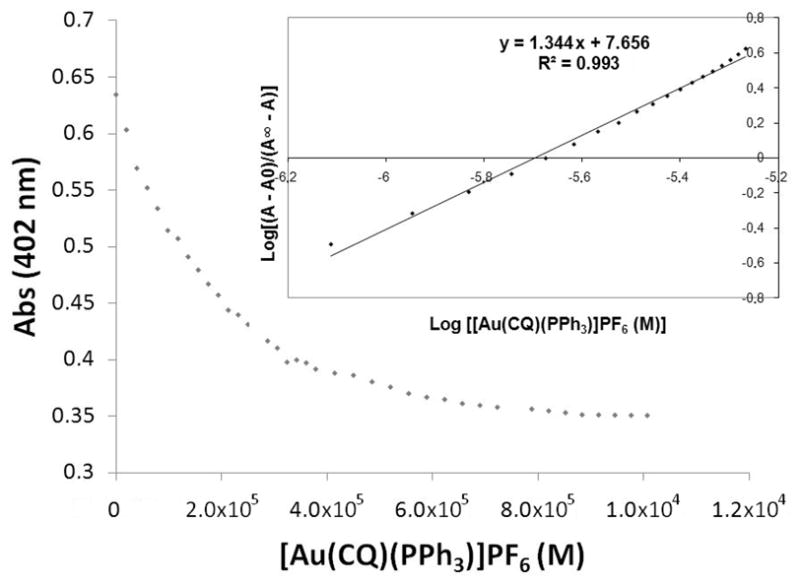
Variation in absorbance of Fe(III)PPIX at 402 nm as a function of complex concentration. Conditions: 40% DMSO, apparent pH 7.5, 0.020 M HEPES buffer, [Complex 1] = 26.98×10⁻⁶ M 25°C. Insert: log [(A−A∞) (A∞−A)] vs log {[Au(CQ)(PPh3)]PF6 (M)}.
Keeping this in mind, the effect of complex 1 on the inhibition of β-hematin formation was first qualitatively determined using FTIR spectroscopy to monitor the characteristic β-hematin bands at 1660 and 1207 cm−1 [22]. Fig. 3a illustrates the IR spectrum of β-hematin obtained from a control experiment in the absence of complex 1. The absence of the bands at 1660 and 1210 cm−1 was evident after addition of 3 equivalents of [Au(CQ)(PPh3)]PF6 (Fig. 3b), indicating that β-hematin was not produced, similarly to previous observations for CQ and other antiplasmodial agents [22].
Fig. 3.
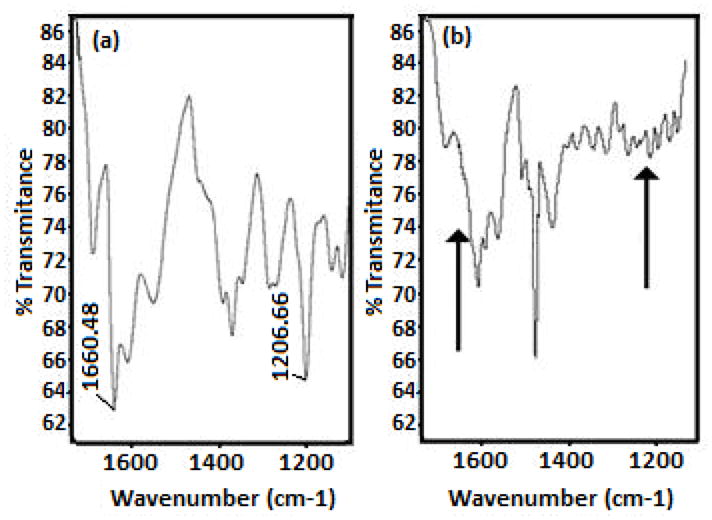
Infrared spectra of (a) β-hematin obtained from hemin in a control experiment and (b) the product of a heme aggregation experiment in the presence of 3 eq of [Au(CQ)(PPh3)]PF6. In both cases the IR spectra were obtained after incubation at 60 °C, pH 4.5; arrows in spectrum (b) indicate the place where the bands appear of β-Hematin.
In order to obtain quantitative data for the heme aggregation inhibition activity (HAIA) of complex 1, a second set of experiments were performed in acetate buffer and also at an interface n-octanol/aqueous buffer interface; the results were compared to those for CQDP as control (Table 1). The IC50 value measured for complex 1 in acetate buffer at pH 5 [23,44] was one order of magnitude higher than that for CQDP, in contradiction with the higher in vitro antimalarial activity observed for 1. When the IC50 value was measured using the HAIA method at the n-octanol/buffer interface, as reported by Sánchez-Delgado and co-workers [13,15], complex 1 was ~5 times better inhibitor than CQDP, in excellent agreement with the in vitro antiplasmodial results obtained for this complex against the CQ-resistant FCB1 and FCB2 strains of P. falciparum (see Table 1) [16]. These results support the idea [14] that heme aggregation inhibition values obtained at n-octanol/aqueous buffer interfaces are a much better predictor of the in vitro biological activity than the classical tests in acidic buffer.
Table 1.
Inhibition of β-hematin formation, partition coefficient and antiplasmodial activities of complex 1 and CQDP
| Complexes | Inhibition of β-hematin formation | HAI50 (mM) in buffera | HAI50 (mM) in interfaceb | Log Kc | Effect on the in vitro growth strains of P. falciparum (IC50 nM)d | |
|---|---|---|---|---|---|---|
| FCB1 | FCB2 | |||||
| [Au(CQ)(PPh3)]PF6 | + | 3.42 ± 1.89 (0.1) | 0.64 ± 0.02 (5) | 7.69 ± 0.01 | 5.1 | 23 |
| CQDP | + | 0.35 ± 0.09 (1) | 3.38 ± 0.13 (1) | 5.84 ± 0.01 | 47 | 110 |
HAI50 is the drug-to-hemin ratio required to inhibit 50% of heme aggregation against a control experiment in the absence of drugs.
Values in parentheses are the relative activity with respect to CQDP.
After 24-h reaction.
After 2 h reaction.
At 25°C.
A summary of the heme interaction data, together with the antiplasmodial activity values previously reported by us is collected in Table 1. The higher heme aggregation inhibition activity at interfaces and higher antiplasmodial activity of complex 1, in relation to CQ, may be related to the lipophilicity of the [Au(CQ)(PPh3)]PF6 complex. It is generally accepted that resistance to CQ is associated to a specific mutation in the pfcrt gene and that highly lipophilic drugs are better able to overcome resistance [13,14,16]. Fig. 4 shows the results of partition coefficients for complex 1 at pH 5.1 and 6.9, emulating the parasite vacuole and cytosolic conditions, respectively. At pH 5.1 complex 1 is substantially more lipophilic than CQDP (Log D of 0.79 for 1 vs. −1.37 for CQDP) and that may have a double implication: (1) The higher lipophilicity of complex 1 favours its accumulation at lipid/water interfaces inside of the digestive vacuole, where hemozoin formation takes place [10,11]; and (2) the resistance mechanism might not be efficiently operating for the Au-CQ complex, because the mutated pfcrt protein is not capable of recognizing this drug. The combination of a higher affinity for Fe(III)PPIX, an increased lipophilic character and the important structural modification of the overall drug with respect to CQDP provide a plausible explanation for the enhanced antiplasmodial activity observed for complex 1. This combination of structural effects and enhanced drug lipophilicity resulting in increased accumulation at lipid/water interfaces is in agreement with mechanistic proposals previously presented for ruthenium-chloroquine complexes [15] and for ferroquine [45].
Fig. 4.
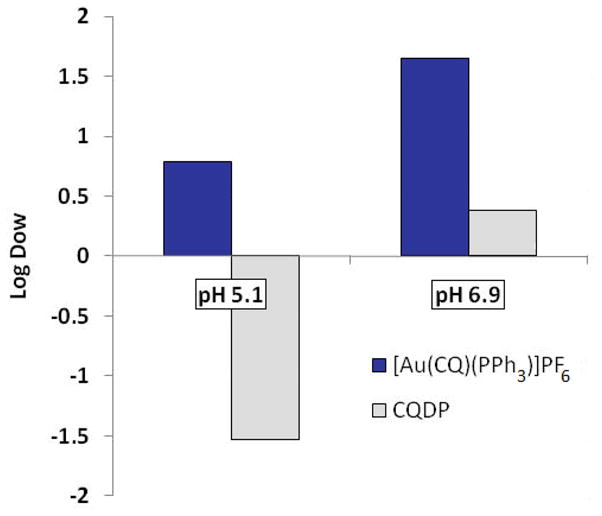
Partition coefficients of [Au(CQ)(PPh3)]PF6 and chloroquine diphosphate in a 1:1 n-octanol–water mixture.
Nevertheless, as noted above, the presence of a metal ion in the structure of this molecule may also lead to DNA binding and such interactions could be another important component of the mechanism of antimalarial action of complex 1.
3.2. DNA interaction studies
The interaction of complex 1 with CT DNA was evaluated by spectrophotometric and fluorimetric titrations. The plots of the absorption titration (Fig. 5) showed that increasing the amount of DNA added to the solution of complex 1 until saturation caused a hypochromism of 17 % in the maxima of absorbance (at 340 nm), a blue shift of 3 nm and an isosbestic point at 322 nm. This observation provides good evidence for an interaction between complex 1 and CT DNA. Additionally, the values of the binding constants (Kb) of complex 1 to DNA, calculated as described in the experimental section, were Kb1 (3.79 ± 0.01) × 107 M−1 and Kb2 (1.84 ± 0.89) × 105 M−1, well within the accepted range for a compound to be considered to be interacting with DNA [45,46]. These values are in the same order of magnitude as those ones obtained for CQ and for Ru-(CQ) complexes [14,15]. The fluorimetric titration for complex 1 is shown in Figure 6; complex 1 luminesces in a buffer solution at room temperature with a maximum at 389 nm. This emission band decreases in intensity, when incremental amounts of DNA were added until saturation. The binding constants obtained for complex 1 by use of Scatchard plots at 389 nm [33] were Kb1 (5.27 ± 1.82) × 107 M−1 and Kb2 (2.44 ± 1.69) × 105 M−1, these values of binding constants are consistent with those calculated from absorption studies and similar to the ones obtained for CQ and Ru-CQ complexes [14,15], among others [47], indicating that complex 1 interacts with DNA in an analogous manner to those compounds [14,16]. This can be interpreted in terms of an interaction involving predominantly intercalation through the planar CQ moiety plus an electrostatic component between the charged complex and negatively charged phosphate residues in the nucleic acid polymer [48].
Fig. 5.
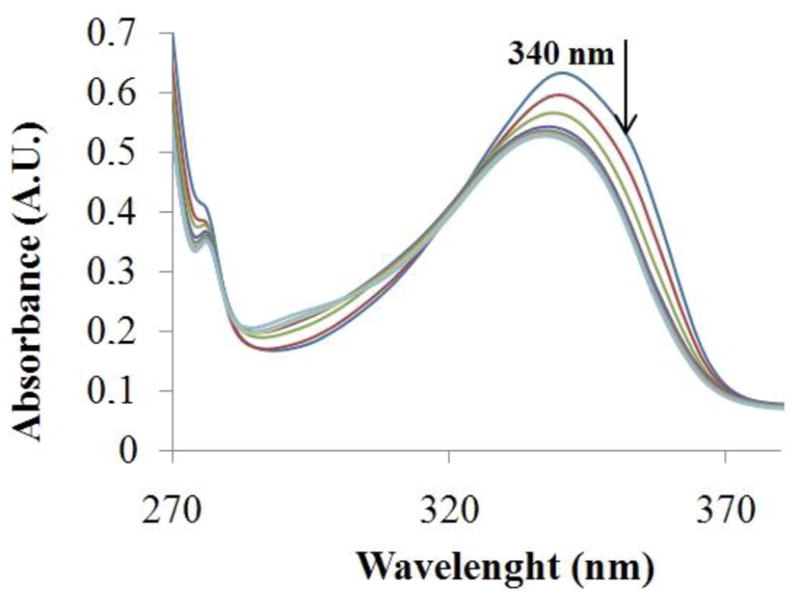
Spectra for spectrophotometric titrations of [Au(CQ)(PPh3)]PF6 with CT-DNA. [Complex] = 9.98×10⁻⁴ M and [DNA] = 0–50 μM.
Fig 6.
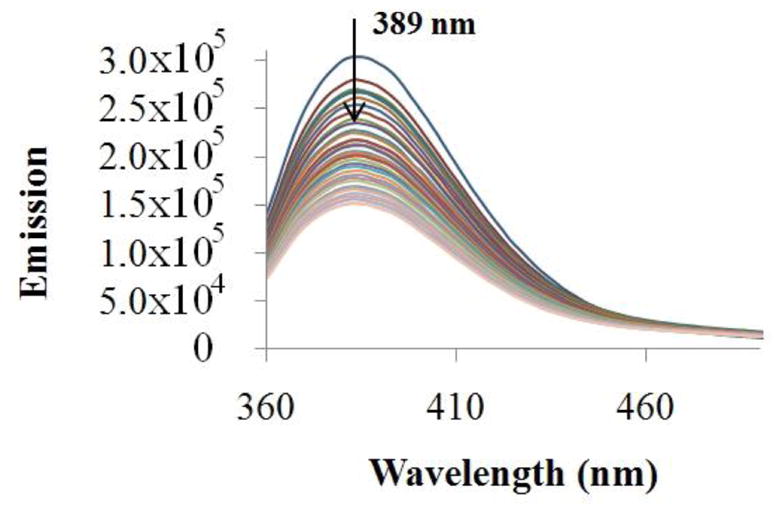
Spectra for fluorimetric titration of complex [Au(CQ)(PPh3)]PF6 with CT-DNA. [Complex] = 7.32×10⁻⁴ M and [DNA] = 0–10 μM.
Viscosity experiments are very sensitive to the change in the length of the DNA double helix and are considered one of the most unambiguous methods to determine intercalation or non-intercalation binding modes of complexes to DNA [33]. The results of viscosity measurements for complex 1 are shown in Figure 7. Increasing the [complex 1]/[DNA] ratios leads to an increase of the DNA viscosity, similar to that reported for the complex [Ru(bpy)2(dppz)]2+, which acts like the classical intercalator ethidium bromide [34]. This increase in the viscosity can therefore be attributed to the enlargement of the separation between base pairs, which are pushed apart to accommodate the intercalating molecule [46]. Thus, this provides further evidence for the idea that that complex 1 can act as a DNA intercalator.
Fig. 7.
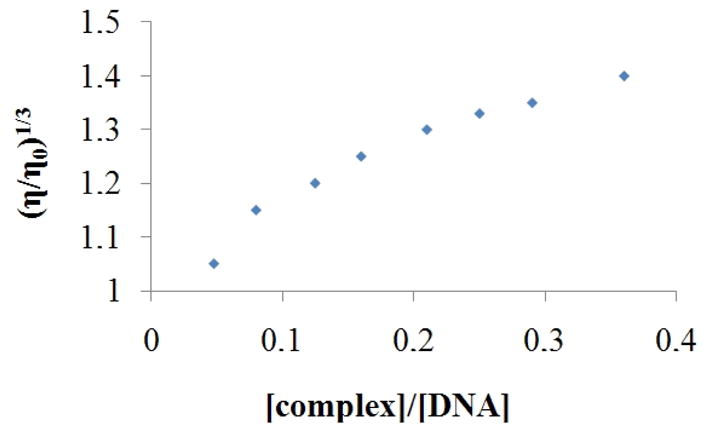
Effect of increasing concentration of complex on the relative viscosity of CT DNA at 25 °C.
Table 3 collects data showing that complex 1 caused an increase of the DNA melting temperature (Tm) upon incremental addition of complex 1. These results indicate a stabilization of the double helix of CT DNA upon interaction with complex 1, most likely due to the intercalation of the CQ moiety between the DNA bases. This is also supported by a control experiment using CQ at an Ri of 0.5, which leads to an increase in Tm of 15.7 °C.
Table 3.
DNA thermal denaturation data
| Ri 0 | Ri 0.05 | Ri 0.11 | Ri 0.21 | Ri 0.31 | Ri 0.52 | |
|---|---|---|---|---|---|---|
| Tm (°C) | 65.4 | 65.6 | 68.6 | 78.6 | 80.9 | 86.6 |
| (ΔTm) | ---- | + 0.2 | + 3.2 | + 13.2 | + 15.5 | + 21.2 |
Thermal denaturation curves of CT DNA in presence of [Au(CQ)(PPh3)]PF6 in pH 7 (tris HCl buffer 5mM NaCl). For free CT DNA in these conditions, Tm = 65.40 °C.
Further experiments showed that the complex 1 does not change the circular dichroism (CD) spectra of CT DNA and additionally does not modify the electrophoretic mobilities of plasmid pBR322 DNA at different molar ratios [complex]/[DNA], indicating that the gold complex is not able to disturb the tertiary structures of DNA at the ratios studied [37] (Fig. 8 and S1).
Fig. 8.
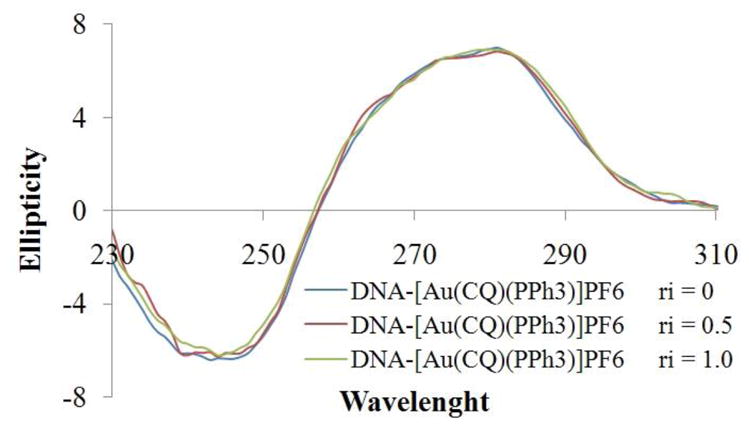
CD spectra of [Au(CQ)(PPh3)]PF6, The values Ri are relation complex:DNA.
The covalent binding studies for complex 1 described in experimental section indicated that the amount of gold bound to DNA of the order of 10 nmole of Au/mg of DNA, which can be taken as evidence that no metal-DNA covalent binding is taking place.
4. Conclusion
The mechanism of antimalarial action of [Au(CQ)(PPh3)]PF6 was studied in connection with two important possible targets, Fe(III)PPIX and DNA. Our findings allow us to conclude that: (i) [Au(CQ)(PPh3)]PF6 interacts with heme with a higher affinity constant than that one measured for chloroquine diphosphate, or for related metal-based compounds with antimalarial activity. The Au-CQ derivative also displays a stronger ability than CQDP to inhibit β-hematin formation, particularly near water/n-octanol interfaces, consistent with the behavior observed in the biological tests against resistant P. falciparum. These properties are related to the enhanced lipophilicity of [Au(CQ(PPh3)]PF6, which probably allows it to better accumulate near water-lipid interfaces inside the parasite’s food vacuole, where heme aggregation takes place, and prevents it from being extruded by the protein responsible for chloroquine resistance, in line with previous reports for other metal-based antimalarial drugs. (ii) Absorption and emission spectrophotometric titrations, DNA melting experiments, CD spectroscopic and viscosity measurements, gel electrophoresis and covalent binding studies indicate that [Au(CQ)(PPh3)]PF6 interacts with DNA in a similar way to that of CQDP, predominantly by intercalation and electrostatic association of the CQ moiety and without any important covalent component; these interactions do not represent an important component of the antimalarial mechanism.
In summary, we propose that the principal mechanism of antimalarial action of [Au(CQ)(PPh3)]PF6 against resistant strains of P. falciparum is the inhibition of β-hematin formation. Both the enhanced activity and the ability of this compound to lower CQ-resistance are related to the high lipophilicity of the metal complex and the important structural modification of the CQ structure imposed by the presence of the metal-containing fragment.
Supplementary Material
Table 2.
Affinity constants for the interaction between [Au(CQ)(PPh3)]PF6 and calf thymus DNA
| Compounds | Absorption Titration | Emission Titration | ||
|---|---|---|---|---|
| Kb1(×107 M−1)a | Kb2(×105 M−1)a | Kb1(×107 M−1)b | Kb2(×105 M−1)b | |
| CQDP | 1.38 ± 0.56 | 1.02 ± 0.15 | 3.24 ± 1.21 | 3.26 ± 1.01 |
| [Au(CQ)(PPh3)] PF6 | 3.79 ± 0.01 | 1.84 ± 0.89 | 5.27 ± 1.82 | 2.44 ± 1.69 |
Chloroquine diphosphate (CQDP), Chloroquine (CQ)
Averages of values calculated at 340 nm from absorption spectra.
Averages of values calculated at 389 nm from fluorescence spectra.
Acknowledgments
This work was supported by IVIC. We also thank Alexis Maldonado for some preliminaries studies and Neyra Gamboa for her technical assistance at Universidad Central de Venezuela. Funding from the NIH through Grant # 1S06GM 076168-04 to R. A. S-D. is gratefully acknowledged. We also thank Dr. Javier Suárez (Brooklyn College) for assistance with electrophoresis experiments
Footnotes
Publisher's Disclaimer: This is a PDF file of an unedited manuscript that has been accepted for publication. As a service to our customers we are providing this early version of the manuscript. The manuscript will undergo copyediting, typesetting, and review of the resulting proof before it is published in its final citable form. Please note that during the production process errors may be discovered which could affect the content, and all legal disclaimers that apply to the journal pertain.
References
- 1.World malaria report. World Health Organization; Geneva: 2008. http://www.who.int/malaria/wmr2008/ [Google Scholar]
- 2.Cravo P, Culleton R, Afonso A, Ferreira ID, do Rosário VE. Anti-Infect Agents Med Chem. 2006;5:63–67. [Google Scholar]
- 3.Krogstad DJ, Schlesinger PH, Herwaldt BL. Antimicrob Agents Chemother. Jun, 1988. pp. 799–801. [DOI] [PMC free article] [PubMed] [Google Scholar]
- 4.Rosenthal PHJ. Antimalarial Chemotherapy: mechanism of action, resistance and new directions in drug discovery. Humana Press Inc; New Jersey: 2001. [DOI] [PubMed] [Google Scholar]
- 5.Klonis N, Dilanian R, Hanssen E, Darmanin C, Streltsov V, Deed S, Quiney H, Tilley L. Biochemistry. 2010;49:6804–6811. doi: 10.1021/bi100567j. [DOI] [PubMed] [Google Scholar]
- 6.Egan TJ. Mol Biochem Parasitol. 2008;157:127–136. doi: 10.1016/j.molbiopara.2007.11.005. [DOI] [PubMed] [Google Scholar]
- 7.Egan TJ. J Inorg Biochem. 2008;102:1288–1299. doi: 10.1016/j.jinorgbio.2007.12.004. [DOI] [PubMed] [Google Scholar]
- 8.Sanchez C, McLean JE, Rohrbach P, Fidock DA, Stein WD, Lanzer M. Biochemistry. 2005;44:9862–9870. doi: 10.1021/bi050061f. [DOI] [PubMed] [Google Scholar]
- 9.Sanchez C, McLean JE, Stein WD, Lanzer M. Biochemistry. 2004;43:16365–16373. doi: 10.1021/bi048241x. [DOI] [PubMed] [Google Scholar]
- 10.Van Schalkwyk DA, Egan TJ. Drug Res Updates. 2006;9:211–226. doi: 10.1016/j.drup.2006.09.002. [DOI] [PubMed] [Google Scholar]
- 11.Warhurst DC. Malaria J. 2003;2:31–43. doi: 10.1186/1475-2875-2-31. [DOI] [PMC free article] [PubMed] [Google Scholar]
- 12.Warhurst DC, Craig JC, Adagu IS, Meyer DJ, Lee SY. Malaria J. 2003;2:26–30. doi: 10.1186/1475-2875-2-26. [DOI] [PMC free article] [PubMed] [Google Scholar]
- 13.Sánchez-Delgado RA, Navarro M, Pérez H, Urbina JA. J Med Chem. 1996;39:1095–1099. doi: 10.1021/jm950729w. [DOI] [PubMed] [Google Scholar]
- 14.Rajapakse CSK, Martínez A, Naoulou B, Jarzecki AA, Suárez L, Deregnaucourt C, Sinou V, Schrevel J, Musi E, Ambrosini G, Schwartz GK, Sánchez-Delgado RA. Inorg Chem. 2009;48:1122–1131. doi: 10.1021/ic802220w. [DOI] [PMC free article] [PubMed] [Google Scholar]
- 15.Martínez A, Rajapakse CSK, Jalloh D, Dautriche C, Sánchez-Delgado RA. J Biol Inorg Chem. 2009;14:863–871. doi: 10.1007/s00775-009-0498-4. [DOI] [PMC free article] [PubMed] [Google Scholar]
- 16.Navarro M, Pérez H, Sánchez-Delgado RA. J Med Chem. 1997;40:1937–1939. doi: 10.1021/jm9607358. [DOI] [PubMed] [Google Scholar]
- 17.Meshnick SR. Parasitol Today. 1990;6:77–79. doi: 10.1016/0169-4758(90)90215-p. [DOI] [PubMed] [Google Scholar]
- 18.Egan TJ. Drug Design Review. 2004;1:93–110. [Google Scholar]
- 19.Slater AFG, Cerami A. Nature. 1992;355:167–169. doi: 10.1038/355167a0. [DOI] [PubMed] [Google Scholar]
- 20.Cohen SN, Yielding KL. Proc Nat Acad Sci. 1965;54:521–527. doi: 10.1073/pnas.54.2.521. [DOI] [PMC free article] [PubMed] [Google Scholar]
- 21.Egan TJ, Mavuso WW, Ross DC, Marques HM. J Inorg Biochem. 1997;68:137–145. doi: 10.1016/s0162-0134(97)00086-x. [DOI] [PubMed] [Google Scholar]
- 22.Egan TJ, Ross DC, Adams PA. FEBS Lett. 1994;352:54–57. doi: 10.1016/0014-5793(94)00921-x. [DOI] [PubMed] [Google Scholar]
- 23.Domínguez JN, León C, Rodrigues J, Gamboa de Domínguez N, Rosenthal PJ. II Fármaco. 2005;60:307–311. doi: 10.1016/j.farmac.2005.01.005. [DOI] [PubMed] [Google Scholar]
- 24.Egan TJ, Chen JYJ, de Villiers KA, Mabotha TE, Naidoo KJ, Ncokazi KK, Langford SJ, McNaughton D, Pandiancherri S, Wood BR. FEBS Lett. 2006;580:5105–5110. doi: 10.1016/j.febslet.2006.08.043. [DOI] [PubMed] [Google Scholar]
- 25.OECD. Guidelines for Testing of Chemicals. 107. OECD; Paris: 1995. [Google Scholar]
- 26.Danielsson LG, Zhang YH. Trends Anal Chem. 1996;15:188–196. [Google Scholar]
- 27.Rappel C, Galanski M, Yasemi A, Habala L, Keppler B. Electrophoresis. 2005;26:878–884. doi: 10.1002/elps.200410053. [DOI] [PubMed] [Google Scholar]
- 28.Kah M, Brown CD. Chemosphere. 2008;72:1401–1408. doi: 10.1016/j.chemosphere.2008.04.074. [DOI] [PubMed] [Google Scholar]
- 29.McGhee JD, Von Hippel PH. J Mol Biol. 1974;86:469–489. doi: 10.1016/0022-2836(74)90031-x. [DOI] [PubMed] [Google Scholar]
- 30.Wei C, Jia G, Yuan J, Feng Z, Li C. Biochemistry. 2006;45:6681–6691. doi: 10.1021/bi052356z. [DOI] [PubMed] [Google Scholar]
- 31.Boyer RF. Biochemistry Laboratory: Modern Theory and Techniques. Benjamin Cummings; San Francisco: 2006. [Google Scholar]
- 32.Cusumano M, Di Pietro ML, Giannetto A. Inorg Chem. 1999;38:1754–1758. doi: 10.1021/ic9809759. [DOI] [PubMed] [Google Scholar]
- 33.Satyanarayana S, Dabrowiak JC. Biochemistry. 1992;31:9319–9324. doi: 10.1021/bi00154a001. [DOI] [PubMed] [Google Scholar]
- 34.Haq I, Lincoln P, Suh D, Norden B, Chowdhry BZ, Chaires JB. J Am Chem Soc. 1995;117:4788–4796. [Google Scholar]
- 35.Zhang B, Seki S, Akiyama K, Tsutsui K, Li T, Nagao K. Acta Medica Okayama. 1992;46:427–434. doi: 10.18926/AMO/32639. [DOI] [PubMed] [Google Scholar]
- 36.Shahabadi N, Kashaniana S, Purfoulad M. Spectrochim Acta, Part A. 2009;72:757–761. doi: 10.1016/j.saa.2008.11.022. [DOI] [PubMed] [Google Scholar]
- 37.Macquet JP, Butour JL. Eur J Biochem. 1978;83:375–387. doi: 10.1111/j.1432-1033.1978.tb12103.x. [DOI] [PubMed] [Google Scholar]
- 38.Burton K. Biochem J. 1956;62:315–323. doi: 10.1042/bj0620315. [DOI] [PMC free article] [PubMed] [Google Scholar]
- 39.Navarro M, Vásquez F, Sánchez-Delgado RA, Pérez H, Sinou V, Schrével J. J Med Chem. 2004;47:5204–5209. doi: 10.1021/jm049792o. [DOI] [PubMed] [Google Scholar]
- 40.Blackie MAL, Beagley P, Chibale K, Clarkson Cailean, Moss JR, Smith PJ. J Organomet Chem. 2003;688:144–152. [Google Scholar]
- 41.Martínez A, Rajapakse CSK, Sánchez-Delgado RA, Varela-Ramirez A, Lema C, Aguilera RJ. J Inorg Biochem. 2010;104:967–977. doi: 10.1016/j.jinorgbio.2010.05.002. [DOI] [PMC free article] [PubMed] [Google Scholar]
- 42.Biot C, Glorian G, Maciejewski LA, Brocard JS, Domarle O, Blampain G, Millet P, Georges AJ, Abessolo H, Dive D, Lebibi J. J Med Chem. 1997;40:3715–3718. doi: 10.1021/jm970401y. [DOI] [PubMed] [Google Scholar]
- 43.Biot C, Taramelli D, Forfar-Bares I, Maciejewski LA, Boyce M, Nowogrocki G, Brocard JS, Basilico N, Olliaro P, Egan TJ. Mol Pharm. 2005;2:185–193. doi: 10.1021/mp0500061. [DOI] [PubMed] [Google Scholar]
- 44.Baelmans R, Deharo E, Muñoz V, Sauvain M, Ginsburg H. Exp Parasitol. 2000;96:243–248. doi: 10.1006/expr.2000.4558. [DOI] [PubMed] [Google Scholar]
- 45.Long EC, Barton JK. Acc Chem Res. 1990;23:271–273. [Google Scholar]
- 46.Graves DE, Watkins CL, Yielding LW. Biochemistry. 1981;20:1887–1892. doi: 10.1021/bi00510a026. [DOI] [PubMed] [Google Scholar]
- 47.Li Y, Yang ZY. Inorg Chim Acta. 2009;362:4823–4831. [Google Scholar]
- 48.Krajewski WA. FEBS Lett. 1995;361:149–152. doi: 10.1016/0014-5793(95)00144-x. [DOI] [PubMed] [Google Scholar]
Associated Data
This section collects any data citations, data availability statements, or supplementary materials included in this article.


