

Abstract
Background
Tight regulation of testicular gene expression is a prerequisite for male reproductive success, while differentiation of gene activity in spermatogenesis is important during speciation. Thus, comparison of testicular transcriptomes between closely related species can reveal unique regulatory patterns and shed light on evolutionary constraints separating the species.
Methodology/Principal Findings
Here, we compared testicular transcriptomes of two closely related mouse species, Mus musculus and Mus spretus, which diverged more than one million years ago. We analyzed testicular expression using tiling arrays overlapping Chromosomes 2, X, Y and mitochondrial genome. An excess of differentially regulated non-coding RNAs was found on Chromosome 2 including the intronic antisense RNAs, intergenic RNAs and premature forms of Piwi-interacting RNAs (piRNAs). Moreover, striking difference was found in the expression of X-linked G6pdx gene, the parental gene of the autosomal retrogene G6pd2.
Conclusions/Significance
The prevalence of non-coding RNAs among differentially expressed transcripts indicates their role in species-specific regulation of spermatogenesis. The postmeiotic expression of G6pdx in Mus spretus points towards the continuous evolution of X-chromosome silencing and provides an example of expression change accompanying the out-of-the X-chromosomal retroposition.
Introduction
Spermatogenesis is a tightly regulated process of germ cell mitotic proliferation, differentiation, and two consecutive meiotic divisions ultimately forming spermatozoa. As testes contain various cell types including developing germ cells, the testicular transcriptome is complex with many yet uncharacterized transcripts. Beside the protein-coding genes, the testicular transcriptome is abundant in antisense transcripts [1], transcribed pseudogenes [2], retrogenes, and various types of non-coding RNAs including microRNAs (miRNAs) [3], and Piwi-interacting RNAs (piRNAs) [4], [5]. Several forms of these transcripts were shown to play a crucial role in spermatogenesis. Recently discovered piRNAs are specifically expressed in the male germ line and are involved in retrotransposon silencing [6]. Another class of small RNAs (microRNAs) was shown to escape inactivation of X chromosome in pachytene stage of spermatogenesis and was suggested to regulate this inactivation process [7], [8].
Differentiation of autosomal ancestors into the mammalian sex chromosomes started after the divergence of the mammalian and avian lineages and progressed during evolution [9]. The growing disparity of the X-Y pair obviously challenged performance of some vital processes such as control of gene dosage in somatic cells and proper execution of homologous recombination in testicular cells. In order to successfully complete male meiotic prophase, two processes have been evolving on sex chromosomes: suppression of recombination and transcriptional silencing – the latter process called meiotic sex chromosome inactivation (MSCI) [10], [11].
MSCI is established at mid-pachytene stage and then maintained to a substantial degree even postmeiotically [12], [13], although the multicopy X-linked genes were reported to escape this inactivation [14]. MSCI is believed to be the driving force for retroposition of spermatogenesis-related genes from X chromosome to autosomes [15], [16], [17]. Based on the comparative study in primates, the process of retroduplication has accelerated in recent evolution history and contributed significantly to the formation of new human genes functional in the male germline [18].
The genes involved in spermatogenesis play an important role during speciation, as demonstrated in Drosophila [19], [20], [21], [22] and in Mus musculus species [23]. Two studies compared transcriptomes of several tissues between human and chimpanzee [24] and between Mus musculus and Mus spretus mouse species [25]. Compared to other tissues, the testis revealed the highest expression divergence.
In this study we used mouse genomic tiling microarrays covering chromosomes X, Y, 2 and mitochondrial genome to study the differences in testicular transcriptome between Mus musculus and Mus spretus. As these mouse species diverged approximately 1.1–1.5 million years ago [26], their comparison could provide an insight into the recent evolutionary forces leading to different transcriptional activity during spermatogenesis. The tiling arrays enabled us to search for differentially expressed genomic regions regardless of their previous functional annotation.
Here we show differences in the expression pattern of the X-chromosome linked G6pdx gene, a parental gene of G6pd2 recently retrotransposed on Chromosome 5. Our finding demonstrates the continuous evolution of the expression pattern of this parent-retrogene pair. Besides several known genes we observed differential expression of previously uncharacterized transcripts including antisense transcripts localized in introns of known genes and two piRNA clusters on Chromosome 2.
Results
Differential levels of testicular transcripts between Mus spretus and Mus musculus
As we wanted to determine how testicular transcriptomes differ between two mouse species by an unbiased experimental method we used mouse tiling arrays. We isolated RNA from testes of three males of Mus spretus (Spr) and Mus musculus, represented by C57BL/6J strain (B6). Only transcripts exceeding ∼200 nucleotides were hybridized to the chip. As the single-strand targets labeling was used and the probes on the chip come from the forward strand of the mouse genomic sequence, only reverse strand transcripts could be detected. This design enabled us to distinguish the antisense transcripts.
To reveal regions with differential expression between Spr and B6, we searched for genomic areas harboring the probes with diverged intensity ratios between Spr and B6. Briefly, the probes were ordered based on their individual chromosome coordinates and sliding windows of 100 probes were analyzed. The windows with at least 10% of probes exhibiting significantly different intensity between Spr and B6 (P<0.05) were merged to create the differentially regulated clusters (see Materials & Methods). Herefrom, the probes with significantly decreased intensity in Spr are stated as downregulated, the probes with increased intensity as upregulated. Counts of upregulated and downregulated probes are summarized in Table 1. Similarly, the clusters enriched in downregulated probes are called downregulated and vice versa.
Table 1. Summary of the unique probes present on the chip.
| chromosome | probes | upregulated probes | % upregulated probes | downregulated probes | % downregulated probes |
| 2 | 2750132 | 2696 | 0.10% | 8952 | 0.33% |
| X | 1600041 | 914 | 0.06% | 2190 | 0.14% |
| Y | 8826 | 4 | 0.05% | 153 | 1.73% |
| Mitochondria | 226 | 0 | 0.00% | 102 | 45.13% |
The probes with significantly decreased intensity in Spr (adjusted P<0.05) are listed as downregulated, the probes with increased intensity as upregulated.
Because of the sequence divergence between Spr and B6, the substantial number of downregulated probes and downregulated clusters might reflect this divergence and not the decreased expression. Indeed, we observed 11,397 downregulated probes compared to 3,614 upregulated probes in Spr. Moreover, the proportion of downregulated probes differed among the individual chromosomes. The highest proportion of downregulated probes was found in the mitochondrial genome. Almost 46% of mitochondrial probes were downregulated whereas none of them was upregulated. The downregulated probes were quite randomly distributed along the mitochondrial genome and created one downregulated cluster (Table 2 and Table S1). An abundance of downregulated probes was also a characteristic of Chromosome Y, with almost 35-fold excess of downregulated probes representing ∼1.8% of all probes on Chromosome Y.
Table 2. Summary of upregulated and downregulated clusters in Mus spretus.
| chromosome | upregulated clusters | downregulated clusters |
| 2 | 17 | 97 |
| X | 1 | 8 |
| Y | 0 | 3 |
| Mitochondria | 0 | 1 |
Differentially regulated clusters are regions enriched in either upregulated or downregulated probes.
To verify the expected cause of overrepresentation of downregulated probes in the mitochondrial genome, we compared the mitochondrial sequences of Spr and B6. Fifteen Mus spretus mitochondrial DNA sequences obtained from GenBank (Table S2) covering ∼3680 nt exhibited ∼93.5% identity to the B6 sequence. Each of the 18 downregulated probes that mapped into this area, matched the sites of sequence divergence between Spr and B6 (Figure 1). It strongly suggests that the observed downregulation in Spr is due to the sequence divergence of the transcribed mitochondrial genomes between Spr and B6 and not due to the expression difference. We found 108 additional downregulated clusters on Chromosomes X, Y, and 2 (Table 2 and Table S1). Sequencing of these clusters would be necessary to distinguish between expression and sequence divergence.
Figure 1. Downregulation of probes within the mitochondrial genome refers to sequence divergence.

The individual probes are plotted along the mitochondrial genome coordinates as bars with the height corresponding to the log fold change difference in intensity between Spr and B6. (a) Two tracks are visualized: the upper one shows probes whose difference in intensity between Spr and B6 is significant at P<0.05. Below, the alignment of Mus spretus sequences obtained from GenBank (http://www.ncbi.nlm.nih.gov/Genbank/) to the B6 sequence is shown and positions of nucleotide differences are highlighted in red or orange. Red bars refer to SNPs and the orange color refers to insertion in the Spr sequence. Alignments are shown in detail in (b) and (c). The tracks were created using UCSC genome browser [50].
Downregulation of piRNA clusters on Chromosome 2 in Mus spretus
From the group of downregulated clusters in Mus spretus we focused only on two clusters of Chromosome 2 (Figure 2), since they are abundant in Piwi-interacting RNAs (piRNAs) with an obvious role in spermatogenesis [5], [6], [27].
Figure 2. Downregulation of four piRNA clusters in chromosomal region chr2: 150,953,000–151,257,000.

Three tracks are depicted. The upper one shows positions of piRNAs as obtained from piRNAbank (http://pirnabank.ibab.ac.in/). Reverse-strand piRNAs are shown in green, forward-strand piRNAs in red. Only the probes exhibiting significant differential intensity between Spr and B6 (P<0.05) are depicted in the middle track. Both clusters with reverse-strand piRNAs exhibit apparent abundance of downregulated probes. Predicted Ensemble transcripts are shown in the lowest track.
Based on the piRNA sequences from piRNAbank (http://pirnabank.ibab.ac.in/) and published data [5], the region between chromosomal positions: 150,953,000-151,257,000 (UCSC build: mm9, NCBI build 37) consists of two piRNA clusters on forward genomic strand and two piRNA clusters on reverse genomic strand. All these clusters share high sequence similarity (>97%). The tiling arrays revealed an enrichment of downregulated probes in two reverse strand clusters in Spr (Figure 2). We assigned these differences to precursors of piRNAs rather than to their mature forms, because only the transcripts exceeding ∼200 nucleotides were assayed. Forward strand transcript clusters could not be detected due to the experimental design.
In order to validate the tiling array results, we designed two nested primer pairs within the B6 sequence, which should amplify all four piRNA clusters (Figure 3a, 3b). Sequencing of the PCR products acquired from testicular genomic DNA confirmed amplification of all four clusters in B6, since unique polymorphisms for individual clusters were present (Figure S1). Even the Spr genomic DNA sequencing revealed several cases of polymorphisms but in different positions than in B6. The sequencing of the outer primer pair PCR product also confirmed sequence identity of the inner primer pair loci between Spr and B6 (Figure S1). As the real-time quantitative PCR (q-PCR) of genomic DNA provided lower amplification in Spr (1.4 and 1.8-fold for the inner and outer primer pair, respectively), we cannot exclude a possibility that less than four clusters are present in Spr genome (Figure 3c).
Figure 3. Quantitative real-time RT-PCR of piRNA clusters from Chromosome 2.

(a) Two nested primer pairs were designed (outer and inner primer pairs), which amplify parts of all four piRNA clusters in chromosomal region chr2: 150,953,000–151,257,000. (b) Detailed view of part of the first cluster, which shows localization of the outer and inner primer PCR products. (c) Quantitative real-time PCR of testicular DNA indicate different copy number between Spr and B6. (d) Strong downregulation was observed in testicular cDNA. (e) In B6 the piRNA clusters were predominantly expressed in pachytene spermatocytes, with substantial downregulation in Spr. Two or three biological samples were used for each comparison. The expression was related to concentration and normalized to B6 expression. Standard deviations are plotted. Pre-pach: pre-pachytene spermatocytes; pach SC: pachytene spermatocytes; ST: spermatids.
Using real-time quantitative Reverse Transcriptase-PCR (qRT-PCR) of testicular RNA, we confirmed the transcriptional decrease (2.7-fold for the inner primer pair and 10.5-fold for the outer primer pair) of the piRNA clusters in Spr (Figure 3d), which was substantially higher than the difference on the genomic DNA. The transcriptional decrease was also apparent when the Spr expression was compared to another laboratory strain C3H, which harbors all 4 clusters (Figures S1 and S2). To get insight into the transcriptional profile during spermatogenesis we performed qRT-PCR of RNA isolated from FACS-sorted populations (see Materials & Methods) of pre-pachytene and pachytene spermatocytes and spermatids. Using both pairs of primers we determined predominant expression of these piRNA clusters in pachytene spermatocytes of B6 mice and substantial downregulation in the same cell population of Spr species (Figure 3e). However, it remains to be elucidated whether the observed transcriptional downregulation is influenced by a possible lower number of piRNA clusters in the region.
Another large piRNA cluster on Chromosome 2 [5] corresponds to chromosomal positions 92,376,642–92,452,541 (UCSC build: mm9, NCBI build 37). Since this cluster contains only forward strand piRNAs, it is undetectable on the tiling array used. Hence, we designed four primer pairs to verify the expression of the piRNA precursors (Figure 4a). First, we performed the q-PCR on genomic DNA, which indicated the identical copy number of the piRNA region among the strains (Figure S2). Using qRT-PCR we detected significant transcriptional downregulation in Spr compared to B6 for three of four primers (Figure 4b). However, the expression of C3H was also lower and therefore similar to the expression of Spr (Figure S2). Therefore the diverged regulation of this piRNA region is rather the characteristic of B6 strain and does not discriminate between Mus musculus and Mus spretus species. Using one of the four primers we then confirmed the predominant expression of piRNA precursors in pachytene spermatocytes of B6 and substantial downregulation in the same cell population of Spr (Figure 4c).
Figure 4. Downregulation of piRNA cluster in chromosomal region chr2: 92376642–92452541.

(a) Four primers were designed to amplify piRNA precursors from the region to compare expression between Spr and B6. No downregulated cluster was found in this region on the tiling chip as this piRNA cluster corresponds to the genomic forward strand. (b) Still, the downregulation was discovered by qRT-PCR. (c) One primer pair was also used to investigate the expression pattern in spermatogenic populations, which confirmed the predominant expression in pachytene spermatocytes of B6 and downregulation in Spr. Three biological samples were used for each comparison. The expression was related to concentration and normalized to B6 expression. Standard deviations are plotted. Pre-pach: pre-pachytene spermatocytes; pach SC: pachytene spermatocytes; ST: spermatids.
Abundance of upregulated non-coding RNAs on Chromosome 2
We identified 18 upregulated clusters in Mus spretus exclusively on the Chromosomes 2 and X (Table 3). Since the presence of upregulated probes can hardly be explained by sequence divergence, we consider the upregulated clusters as the regions with increased transcriptional activity. Still, the copy number variation might be involved.
Table 3. Summary of upregulated clusters in Mus spretus.
| Mitochondria | |||
| no upregulated clusters |
The chromosomal positions of the listed clusters are displayed according to UCSC genome build mm9.
Seventeen upregulated clusters were found on Chromosome 2 (Table 3 and Figure S3). Four of the 17 clusters overlap the exons of known genes previously annotated to reverse strand. The genes involved are: Nebl, Depdc7, Atp8b4 and Flrt3. Using qRT-PCR we verified the testicular expression of Atp8b4 and Flrt3 and confirmed their transcriptional upregulation in Spr, which was more than 4-fold for Atp8b4 and 19-fold for Flrt3, respectively.
Strikingly, the majority of the upregulated clusters (13/17) do not correspond to any annotated transcript, suggesting the existence of novel transcripts in Spr. According to the annotation of RefSeq (http://www.ncbi.nlm.nih.gov/RefSeq/) and Ensemble (www.ensembl.org), these clusters can be divided into two groups: the first group contains five upregulated clusters, which reside in the introns of known forward strand genes and therefore represent possible new antisense transcripts. The second group consists of eight clusters that do not match any known gene, thus occupying intergenic regions.
We verified the transcriptional upregulation of several of these clusters (4 of 13) using qRT-PCR. Clusters 7 and 9 represent possible antisense transcripts, which reside in introns of the Ckap5 or Abtb2 gene, respectively. The expression in Spr strongly exceeded the B6 expression: more than 10-fold for cluster 7 (Figure 5a) and 18-fold for cluster 9 (Figure 5b). Clusters 12 and 17 are potential new transcripts with strong upregulation. More than 9-fold upregulation was detected for cluster 12 (Figure 6b) and 10-fold for cluster 17 (Figure 6b).
Figure 5. Upregulation of non-coding antisense RNAs.

Two upregulated clusters from chromosome 2 are depicted: (a) cluster 7, which is an antisense to the Ckap gene, and (b) cluster 9, which is an antisense to the Abtb2 gene. Differentially regulated probes are depicted together with the positions of the PCR products, which were quantified using qRT-PCR to verify the upregulation in testicular germ cell suspension. Three biological samples were used for each comparison. The expression was related to concentration and normalized to B6 expression. Standard deviations are plotted.
Figure 6. Upregulation of non-coding intergenic RNAs.

Two upregulated clusters from chromosome 2 are depicted: (a) cluster 12 and (b) cluster 17, which lie in the intergenic regions. Differentially regulated probes are depicted together with positions of the PCR products, which were quantified using qRT-PCR to verify the upregulation in testicular germ cell suspension. Three biological samples were used for each comparison. The expression was related to concentration and normalized to B6 expression. Standard deviations are plotted.
G6pdx escapes postmeiotic silencing in Mus spretus
We found a single upregulated cluster on the X chromosome in Spr (Figure 3). It overlaps the exons of the G6pdx gene, which encodes glucose-6-phosphate dehydrogenase and exhibits both meiotic and postmeiotic transcriptional silencing in the mouse [28]. In order to verify its upregulation in Spretus we performed qRT-PCR with two pairs of primers (Gpdx#1, G6pdx#2) (Figure 7a). The primers match exon 13 and encompass exons 4 and 5, respectively. Partial sequencing of Mus spretus G6pdx cDNA overlapping exons 6 to 13 confirmed the absence of SNPs in G6pdx#1 primers (data not shown). Both pairs of primers used in qRT-PCR exhibited extensive transcriptional upregulation of G6pdx in the testis of Spr (>15 times) (Figure 7b). Remarkably different expression profiles between Spr and B6 were determined in isolated spermatogenic populations (Figure 7b). In strong contrast to low gene expression in all the B6 germ cell populations, the Spr G6pdx exhibited strong preferential expression in spermatids, exceeding the B6 expression more than 25 times. The upregulation was detected even in the populations of pachytene spermatocytes. However, as these isolated populations contained a proportion of spermatids (<5%), we cannot rule out the possibility that the observed upregulation was due to contaminating cells.
Figure 7. G6pdx escapes postmeiotic silencing in Mus spretus.

(a) Two pairs of primers were designed to verify expression differences of G6pdx between Spr and B6. (b) Both pairs of primers confirmed upregulation in testicular single-cell suspension. While G6pdx is meiotically and postmeiotically silenced in B6, predominant spermatid expression was discovered in Spr. (c) One pair of primers was designed for G6pdx retrogene G6pd2, which is localized on chromosome 5. G6pd2 was predominantly postmeiotically expressed in both B6 and Spr. (d) Two or three biological samples were used for each comparison. The expression was related to concentration and normalized to B6 expression. Standard deviations are plotted. Pre-pach: pre-pachytene spermatocytes; pach: pachytene spermatocytes; ST: spermatids.
The meiotic and postmeiotic silencing of G6pdx in B6 is compensated by expression of its functional retrogene G6pd2 on Chromosome 5 [28]. To verify whether G6pdx primers amplify exclusively G6pdx and not its retrogene, we performed qPCR on genomic DNA of Spr and B6 using G6pdx#2 primers (Figure S4). Both B6 and Spr samples contained a single PCR amplicon of size ∼907 nt, which corresponds to the length of the genomic G6pdx region spanning the intron 4. Remarkably, no other amplicons, especially the intronless G6pd2 (81nt), were detected. The obtained PCR products were sequenced and confirmed to match the intron 4 of G6pdx. Moreover, we performed q-PCR on genomic DNA of Spr and B6 and achieved similar relative levels of amplification, showing that G6pdx in Spr is a single-copy gene as it is in B6 (Figure S4).
To find out whether the transcriptional dysregulation of G6pdx in Spr is accompanied by different expression of its retrogene, we measured the expression of G6pd2 in the whole testis and in spermatogenic populations by qRT-PCR (Figure 7c). Comparison between Spr and B6 showed a similar pattern of this retrogene expression and demonstrated the preferential spermatid expression in both mouse species (Figure 7d). We verified the match of the G6pd2 primers by sequencing the corresponding parts of the G6pd2 gene in both Spr and B6 (data not shown).
To further elucidate the ancestral state of G6pdx expression, we explored the expression profile of the X-linked G6pd gene in rat spermatogenesis. The qRT-PCR of total RNA from rat testicular germ cells and from sorted germ cells, namely pachytene spermatocytes and spermatids, showed that the rat X-chromosomal G6pd gene was silenced in pachytene spermatocytes and reactivated postmeiotically in spermatids (Figure 8).
Figure 8. Rat X-chromosomal G6pd is postmeiotically expressed in spermatogenesis.
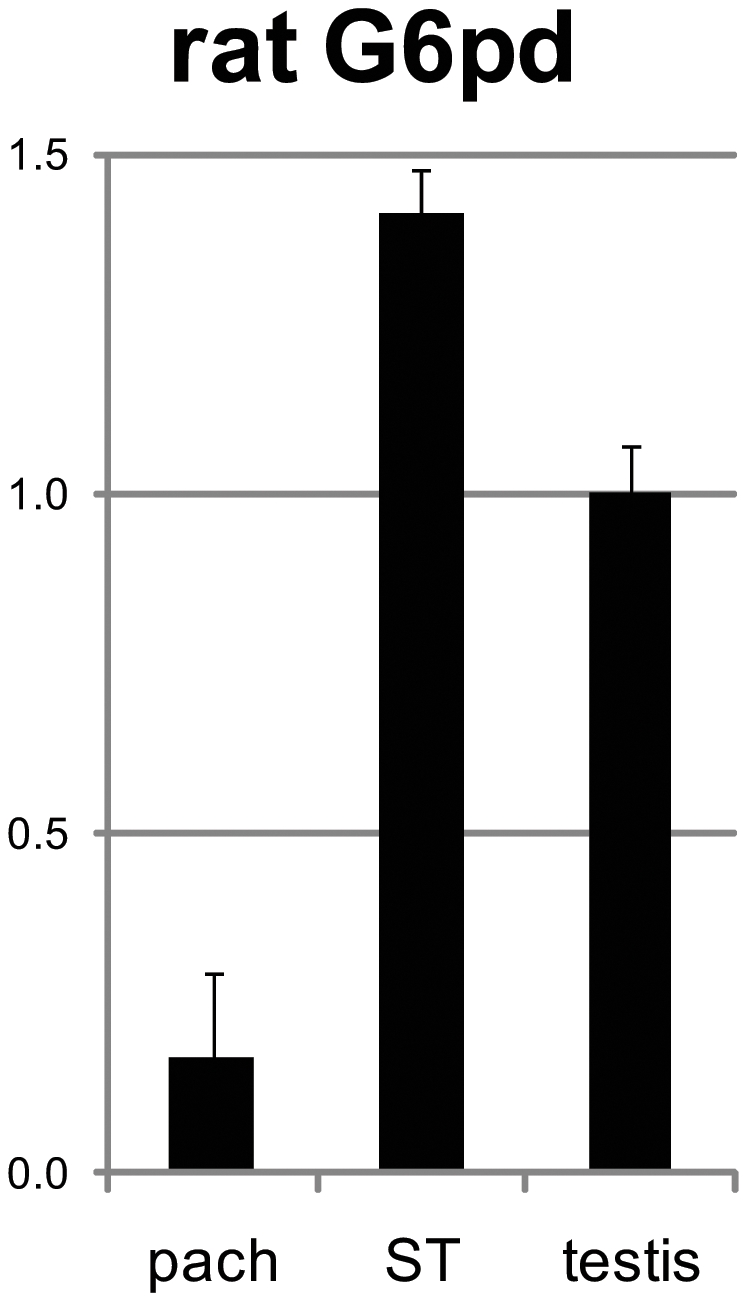
Quantitative reverse transcriptasePCR (qRT-PCR) was performed on total RNA from testicular germ cell suspension (testis) and sorted germ cell populations of pachytene spermatocytes (pach) and spermatids (ST). G6pd is silenced in pachytene spermatocytes and reactivated postmeiotically in spermatids. Two to four replicas were used for each cell type and the expression was normalized to the expression in testicular germ cells. Standard deviations are plotted.
Discussion
The rate of sequence variation between Mus spretus and laboratory strains is estimated as one variant every 50 base pairs [29] or 130 base pairs [30] which might account for part of the downregulated probes detected by tiling arrays. The bias in favor of downregulated probes was most apparent for the mitochondrial genome and Y chromosome in concordance with the expected higher differentiation rate of mitochondrial DNA and Chromosome Y loci [31]. The identified SNPs in positions of downregulated probes suggested that the observed downregulation of Spr mitochondrial genome is caused by sequence divergence.
Thus, the observed downregulated clusters in Spr might either reflect lower level of transcription or higher sequence divergence of the transcribed regions. We focused here on two such regions on Chromosome 2, which harbor “pachytene piRNAs”, whose expression start in mid-late pachytene spermatocytes and persist until spermatids [4], [5], [32]. Their role is unclear as opposed to “pre-pachytene piRNAs”, which are involved in transposon silencing [6]. A possible function of pachytene piRNAs in translational regulation was suggested based on their time-dependent differential association with polysomes and ribonucleotide particles [32], [33].
We demonstrated that the piRNAs of these two regions are transcribed as long precursors (pre-piRNAs), in agreement with the proposed model of individual piRNA clusters as single transcription units. This model is based on the profound strand asymmetry of pachytene piRNA clusters [4] flanked by inverted transposable elements [34].
The finding of almost exclusive expression of the pre-piRNAs in pachytene spermatocytes was unexpected, as it is in contrast with the postmeiotic abundance of their mature forms [4]. Possible explanations are that transcriptional regulation of these piRNAs of Chromosome 2 differs from pachytene piRNAs of other chromosomes, or that mature piRNAs, in contrast to their precursors, persist in spermatids from prior stages of spermatogenesis.
Moreover, using qRT-PCR we observed decreased expression of the pre-piRNAs in Spr, which originated from selected parts of both studied regions. Comparison to C3H, another laboratory strain representing Mus musculus species, confirmed the downregulation for one of the piRNA regions, indicating a species-specific regulation. However, more independent representatives from both species would be necessary to exclude intraspecific variation in piRNA regulation. Besides, we cannot entirely exclude the contribution of different genome architecture between the species, especially the copy number variation.
Out of 17 upregulated clusters on Chromosome 2 in Spr, 13 are not annotated to exons of known genes and are presumably long non-coding RNAs (>200 nt in length; lncRNAs). These transcripts either reside in introns of known genes in antisense orientation (5 clusters) or lie in intergenic regions (8 clusters). High complexity of mammalian transcriptome, comprising loads of lncRNAs [1], [35], [36], [37], [38], [39], was described earlier in both human and mouse using high-throughput and high-resolution techniques such as tiling arrays and RNA-seq. A regulatory function was suggested for some of these ncRNAs based on their tissue specific expression [37], [40], [41]. The overrepresentation of lncRNAs among upregulated transcripts in Spr reflects their substantial contribution to the testicular transcriptome divergence between species, and indicates their functionality in species-specific spermatogenesis regulation. Furthermore lncRNAs are likely involved in epigenetic regulation of chromatin state [42] and their general role in control of regulatory networks of differentiation and development was suggested [43].
Consequently, the acquired interspecific differences in non-coding RNA transcriptome of spermatogenic cells could also contribute to species specific barriers and might be involved in molecular pathways leading to male hybrid sterility phenomenon [44]. To assess profile of the whole genome non-coding RNA transcriptome and the overall expression of mature piRNAs along the whole piRNA clusters, deep RNA sequencing would be necessary, which would also enable characterization of the sequence divergence at a time.
The inactivation of X chromosome during spermatogenesis, known as MSCI [11] is the proposed driving force of retroposition of X-chromosome genes to autosomes [15], [17], [45] and might pose limits to the X-chromosome expression divergence. Indeed, we found the only upregulated cluster on Chromosome X in Spr, which mapped to the G6pdx gene, compared to 17 single-copy upregulated clusters on Chromosome 2. As only the probes with one perfect match to the genome were analyzed, possible differences in the expression of multi-copy genes on the X chromosome were outside the scope of this study. Retrogenes are supposed to functionally substitute their X-linked transcriptionally silenced parental genes. Indeed, a number of these retrogenes, including G6pd2 retrogene of G6pdx [28], [45], [46], were shown to be expressed during meiosis while their parental genes were silenced.
Our observation of differential spermatogenic expression profile of G6pdx between two mouse species represented by Spr and B6 illustrates such a retroposition. Move of the G6pd retro-copy from X to Chromosome 5 was an evolutionarily recent event, because the functional retrogene G6pd2 exists only in the mouse [28]. In B6, the expression profiles of G6pdx and G6pd2 conform to functional substitution of the X-chromosomal parental gene by its autosomal counterpart: G6pdx is expressed premeiotically, whereas G6pd2 is expressed in spermatids. In Spr we found a strikingly different pattern of expression with G6pdx transcribed also in spermatids. As the G6pd2 expression profile is similar in B6 and Spr, it should be capable of functional substitution of G6pdx in both species. We suggest the following order of events to explain the observed divergence of Mus musculus and Mus spretus species: G6pdx was retroposed and G6pd2 obtained its spermatid-specific expression pattern in the common ancestor of both species. After Mus musculus and Mus spretus diverged, the G6pdx became post-meiotically silenced in the Mus musculus lineage, while its expression in spermatids of Mus spretus, though functionally redundant, was still maintained. The concept of the G6pdx postmeiotic expression as an ancestral state is supported by our observation of postmeiotic expression of the X-chromosomal G6pd gene in the rat.
The different regulation of G6pdx also points out the distinct extent of postmeiotic silencing of the X chromosome between the species. Although mainly multicopy genes on X chromosome escape postmeiotic sex chromosome inactivation (PMSCI) [14], here we show that even a single-copy gene might escape the inactivation in a species-specific manner. Thus, the different postmeiotic activity of G6pdx between Mus spretus and Mus musculus emphasizes the continuous evolution of X-chromosome silencing following the successful retroposition.
In summary, Mus spretus and Mus musculus show divergence in the male germ cell expression repertoire of non-coding RNAs and in the extent of X-chromosome (post) meiotic silencing, both of which might contribute to their reproductive isolation.
Materials and Methods
Animals
The C57BL/6J inbred strain was obtained from the Jackson Laboratory in 1998 (Bar Harbor, ME), the C3H/HeJ substrain (C3Sn.BLiA-Pde6b+/DnJ) was obtained from Yann Hérault in 2007 (ICS, France). Since then both strains were maintained in the Specific Pathogen-Free barrier facility of the Institute of Molecular Genetics, AS CR. The males of Mus spretus originated from wild-derived animals caught in Montferrier-sur-Lez, Languedog (France). They underwent inbreeding by successive brother – sister mating to generation 9 by J. Pialek and were obtained from the Institute of Vertebrate Biology (Brno, Czech Republic). All male mice used in the present experiments were two months old.
The three months old male of Brown-Norway BN.lx rat strain was a gift from M. Pravenec and P. Mlejnek (Institute of Physiology, AS CR).
Animal experiments were conducted based on Animal Use Protocols approved by the Institutional Animal Care and Use Committee (IACUC) of the Institute of Molecular Genetics, Prague, (Protocol-project number: 87/2006). The principles of laboratory animal care observed the Czech Republic Act for Experimental Work with Animals (Decree No. 207/2004 Sb., and Acts Nos. 246/92 Sb. and 77/2004 Sb.) fully compatible with the corresponding EU regulations and standards, namely Council Directive 806/609/EEC and Appendix A of the Council of Europe Convention ETS123.
FACS characterization and isolation of spermatogenic populations
Populations of mouse pre-pachytene spermatocytes, pachytene spermatocytes, and spermatids and rat pachytene spermatocytes, and spermatids were isolated using fluorescence-activated cell sorting according to ref. [47] with minor modifications as described earlier [48]. Briefly, spermatogenic tubules of mice or rats euthanized by cervical dislocation were incubated in enriched Krebs-Ringer bicarbonate medium (EKRB) with collagenase (0.5 mg/ml; Sigma) for 20 min at 32°C on a shaker. The tubules were separated by a cell strainer (BD Falcon) and incubated with collagenase under the same conditions. The suspension was filtered by the cell strainer and the cells washed twice by EKRB containing 1% FCS. Finally, the cells were diluted in 1 ml of EKRB with 1% FCS and stained with Hoechst 33342 (13 µg/ml) for 1 hour at 32°C. Propidium iodide was added just before FACS analysis to concentration 2 µg/ml. Individual populations were sorted according to red and blue Hoechst emission (Bastos et al. 2005) directly into the RLT buffer Plus of the AllPrep DNA/RNA Micro Kit (Qiagen). Aliquots were sorted to EKRB medium for subsequent immunofluorescense analysis. Based on SCP3, SCP1 and γH2AX immunostaining and morphology of the cells, we determined the composition of FACS-isolated populations. The fraction of mouse pre-pachytene spermatocytes consisted of leptotene and zygotene spermatocytes (∼60%), and early pachytene spermatocytes (∼40%). The population of both mouse and rat pachytene spermatocytes displayed ∼90% of the cells at the late pachytene stage. The population of mouse and rat spermatids consisted of ∼90% of the spermatids.
RNA isolation
RNA of the spermatogenic populations was isolated using AllPrep DNA/RNA Micro Kit (Qiagen).
For the isolation of testicular RNA, the single-cell testicular suspension was prepared: spermatogenic tubules of mice or rat euthanized by cervical dislocation were incubated in enriched Krebs-Ringer bicarbonate medium (EKRB) with collagenase (0.5 mg/ml; Sigma) for 20 min at 32°C on a shaker. The tubules were filtrated with cell strainer (BD Falcon) and incubated with collagenase under the same conditions. The suspension was filtered and the cells washed twice by EKRB containing 1% FCS. Finally, the cells were resuspended in 600 µl of RLT buffer with 1% β-mercaptoethanol and RNA was isolated using RNeasy Mini isolation kit (Qiagen).
DNA isolation
DNA was isolated from B6, C3H and Spr testes, from which the tunica was removed, and from rat spleen. The tissue samples were homogenized in 5 ml Fasano A (200 mM NaCl, 20 mM EDTA, 20 mM Tris: pH = 8, 0.5% SDS) solution using a glass Wheaton homogenizer. After addition of Fasano B (0.5% SDS) and proteinase K (to concentration 0.05 mg/ml) the samples were incubated overnight at 50°C on a shaker. The DNA was then extracted by one round of phenol-chloroform-isoamylalcohol extraction and two rounds of chloroform-isoamylalcohol extraction. Finally, the genomic DNA was precipitated by ethanol and wound up onto an inoculation loop. After washing with 70% ethanol, it was dried and diluted in TE.
Tiling array analysis
Affymetrix GeneChip® Mouse Tiling 2.0R B Array was used in order to investigate differences in transcriptional activity between Mus spretus (Spr) and Mus musculus species represented by C57BL/6J strain (B6). The Tiling 2.0R B Array covers around 14% of the mouse genome involving Chromosomes X, Y, 2 and mitochondrial genome. Two µg of total testicular RNA was isolated from three independent individuals of each species and used to prepare biotinylated single-stranded target using the Affymetrix protocol (Whole Transcript (WT) Double-Stranded Target Assay Manual, 702179 Rev. 3, Affymetrix) with a slight modification: the synthesis of second-strand cDNA was omitted in the final step. Therefore, only cDNA of reverse strand transcripts was hybridized to the chips.
Sequences of the 25 nt long probes were aligned to the chromosomal positions (UCSC genome build mm9) using MUMmer (http://mummer.sourceforge.net/). Only probes with one perfect match and without any near-match (match of 23 or 24 nt) were left. We also filtered out the probes arising from the reverse strand and/or matching other chromosomes than X, Y, 2 or mitochondrial genome. Intensities of the remaining probes were quantile-normalized using R (http://www.r-project.org/). LogFC values of Spr versus B6 comparison together with P values were calculated for individual probes using limma package [49] from Bioconductor (www.bioconductor.org). The P values were adjusted using Benjamini & Hochberg correction. To find out the dysregulated clusters between Spr and B6 we constructed sliding windows of 100 probes, which were moved along the chromosomal coordinates. For each window step the proportion of significantly upregulated or downregulated probes (adjusted P<0.05) was calculated. Overlapping sliding windows with at least 10% of significantly dysregulated probes were merged to create the dysregulated clusters. The results were visualized in the UCSC browser [50].
The dataset is MIAME compliant and is deposited in the NCBI Gene Expression Omnibus (GEO) with series accession number GSE19633.
Real-time quantitative Reverse Transcriptase-PCR (qRT-PCR) and quantitative real-time PCR (q-PCR) of genomic DNA
Total RNA isolated from the sorted spermatogenic populations or testicular single-cell suspension was reverse-transcribed using Mu-MLV Reverse Transcriptase (Invitrogen).
Quantitative real-time PCR of cDNA or genomic DNA was performed with Light-Cycler DNA Fast Start Master SYBR green I kit (Roche) in a Light Cycler 2000 machine at Tm = 61°C. RT minus reactions were negative. Amplification values were calculated as (1/(2∧Cp))/input, where Cp is the crossing point value and input was the amount of DNA or reverse transcribed RNA used as a template. The sequences of primers used are listed in the Table 4.
Table 4. Summary of oligonucleotide primers used in qRT-PCR and qPCR.
| primer | direction | sequence (5′ ->3′) |
| outer | Forward | ATGTGGACAAACATACAGTAG |
| outer | reverse | TTCCCACAGAATATCCCT |
| inner | forward | TGTGGCTGTCTGCATC |
| inner | reverse | GAAAATGGTGCCTGGAG |
| piRNAcl1_rt1 | forward | AGTGGGCTAGTGATGC |
| piRNAcl1_rt1 | reverse | TCAGAAACCAGCTAAGTGT |
| piRNAcl1_rt2 | forward | TCTCAATGGGCATGGTT |
| piRNAcl1_rt2 | reverse | GCACTAATAATAATAGCGCCT |
| piRNAcl1_rt3 | forward | CAGTCAAAGCGCCTCC |
| piRNAcl1_rt3 | reverse | CTGTCTCGACACTAAAGC |
| piRNAcl1_rt4 | forward | ACCGTCCAAATAGGGC |
| piRNAcl1_rt4 | reverse | GTCAGACCATAACAATCAGTG |
| chr2minusU7_1 | forward | CGTCCACTACCTGTGAT |
| chr2minusU7_1 | reverse | CATAGCAATTACCACGACT |
| chr2minusU7_2 | forward | CAAAGTCGTGGTAATTGCT |
| chr2minusU7_2 | reverse | TCCTATCTGGGCCAAG |
| chr2minusU9_1 | forward | GCAGGTTTTAGTGAGAGC |
| chr2minusU9_1 | reverse | GGTCCCTAATACGGTCG |
| chr2minusU12_2 | forward | CAGGGTGCAATTCCAGA |
| chr2minusU12_2 | reverse | TGCAGGAGAGACATAAAGT |
| chr2minusU17_1 | forward | CAACTCATTATCGTTAGTGCC |
| chr2minusU17_1 | reverse | CCTGGGTAAGAGGTGT |
| chr2minusU17_2 | forward | GTCCACATTCATCTCTAGGT |
| chr2minusU17_2 | reverse | GCCATTCACATTTGGAGT |
| G6pdx#1 | forward | AGTGGGTGAACCCTCACAA |
| G6pdx#1 | reverse | AAAAGGGAAGATGCAGAAAGG |
| G6pdx#2 | forward | GAAAGCAGAGTGAGCCCTTC |
| G6pdx#2 | reverse | CATAGGAATTACGGGCAAAGA |
| G6pd2 | forward | CTCCTATGTAGTTGGCCAGTATGA |
| G6pd2 | reverse | TGGTGCAGGGCATTAATGTAG |
| ratG6pd | forward | GTGCAAGCGTAACGAG |
| ratG6pd | reverse | CCAGGATGAGGCGTTC |
Supporting Information
A table summarizing all Mus spretus downregulated clusters.
(PDF)
A table summarizing GenBank mitochondrial sequences of Mus spretus that were used for sequence comparison to B6.
(PDF)
DNA sequence alignment of clusters from piRNA region: chr2:150,953,000-151,257,000.
(PDF)
Quantitative real-time PCRs on genomic DNA and testicular cDNA for piRNA regions on Chromosome 2. Comparisons between Spr, B6 and C3H.
(PDF)
Summary of Mus spretus upregulated clusters on chromosome 2.
(PDF)
Copy number evaluation of G6pdx in Spretus by quantitative real-time PCR.
(PDF)
Acknowledgments
We thank Zdenek Trachtulec and Sarka Takacova for helpful comments and language revision, Jaroslav Pialek for Spretus mice, Michal Pravenec and Petr Mlejnek for BN.lx rat, and Tony Dear for language revision.
Footnotes
Competing Interests: The authors have declared that no competing interests exist.
Funding: This work was supported by the Czech Science Foundation (GACR), Grant 301/07/1383 and nos. IM6837805002 and AV0Z5052514 from the Ministry of Education, Youth and Sports of the Czech Republic. The funders had no role in study design, data collection and analysis, decision to publish, or preparation of manuscript.
References
- 1.Chan WY, Wu SM, Ruszczyk L, Law E, Lee TL, et al. The complexity of antisense transcription revealed by the study of developing male germ cells. Genomics. 2006;87:681–692. doi: 10.1016/j.ygeno.2005.12.006. [DOI] [PubMed] [Google Scholar]
- 2.Harrison PM, Zheng D, Zhang Z, Carriero N, Gerstein M. Transcribed processed pseudogenes in the human genome: an intermediate form of expressed retrosequence lacking protein-coding ability. Nucleic Acids Res. 2005;33:2374–2383. doi: 10.1093/nar/gki531. [DOI] [PMC free article] [PubMed] [Google Scholar]
- 3.Marcon E, Babak T, Chua G, Hughes T, Moens PB. miRNA and piRNA localization in the male mammalian meiotic nucleus. Chromosome Res. 2008;16:243–260. doi: 10.1007/s10577-007-1190-6. [DOI] [PubMed] [Google Scholar]
- 4.Aravin A, Gaidatzis D, Pfeffer S, Lagos-Quintana M, Landgraf P, et al. A novel class of small RNAs bind to MILI protein in mouse testes. Nature. 2006;442:203–207. doi: 10.1038/nature04916. [DOI] [PubMed] [Google Scholar]
- 5.Girard A, Sachidanandam R, Hannon GJ, Carmell MA. A germline-specific class of small RNAs binds mammalian Piwi proteins. Nature. 2006;442:199–202. doi: 10.1038/nature04917. [DOI] [PubMed] [Google Scholar]
- 6.Aravin AA, Sachidanandam R, Girard A, Fejes-Toth K, Hannon GJ. Developmentally regulated piRNA clusters implicate MILI in transposon control. Science. 2007;316:744–747. doi: 10.1126/science.1142612. [DOI] [PubMed] [Google Scholar]
- 7.Song R, Ro S, Michaels JD, Park C, McCarrey JR, et al. Many X-linked microRNAs escape meiotic sex chromosome inactivation. Nat Genet. 2009;41:488–493. doi: 10.1038/ng.338. [DOI] [PMC free article] [PubMed] [Google Scholar]
- 8.Yan W, McCarrey JR. Sex chromosome inactivation in the male. Epigenetics. 2009;4 doi: 10.4161/epi.4.7.9923. [DOI] [PMC free article] [PubMed] [Google Scholar]
- 9.Lahn BT, Page DC. Four evolutionary strata on the human X chromosome. Science. 1999;286:964–967. doi: 10.1126/science.286.5441.964. [DOI] [PubMed] [Google Scholar]
- 10.Handel MA. The XY body: a specialized meiotic chromatin domain. Exp Cell Res. 2004;296:57–63. doi: 10.1016/j.yexcr.2004.03.008. [DOI] [PubMed] [Google Scholar]
- 11.Turner JM. Meiotic sex chromosome inactivation. Development. 2007;134:1823–1831. doi: 10.1242/dev.000018. [DOI] [PubMed] [Google Scholar]
- 12.Namekawa SH, Park PJ, Zhang LF, Shima JE, McCarrey JR, et al. Postmeiotic sex chromatin in the male germline of mice. Curr Biol. 2006;16:660–667. doi: 10.1016/j.cub.2006.01.066. [DOI] [PubMed] [Google Scholar]
- 13.Turner JM, Mahadevaiah SK, Ellis PJ, Mitchell MJ, Burgoyne PS. Pachytene asynapsis drives meiotic sex chromosome inactivation and leads to substantial postmeiotic repression in spermatids. Dev Cell. 2006;10:521–529. doi: 10.1016/j.devcel.2006.02.009. [DOI] [PubMed] [Google Scholar]
- 14.Mueller JL, Mahadevaiah SK, Park PJ, Warburton PE, Page DC, et al. The mouse X chromosome is enriched for multicopy testis genes showing postmeiotic expression. Nat Genet. 2008;40:794–799. doi: 10.1038/ng.126. [DOI] [PMC free article] [PubMed] [Google Scholar]
- 15.Wang PJ. X chromosomes, retrogenes and their role in male reproduction. Trends Endocrinol Metab. 2004;15:79–83. doi: 10.1016/j.tem.2004.01.007. [DOI] [PubMed] [Google Scholar]
- 16.Shiao MS, Khil P, Camerini-Otero RD, Shiroishi T, Moriwaki K, et al. Origins of new male germ-line functions from X-derived autosomal retrogenes in the mouse. Mol Biol Evol. 2007;24:2242–2253. doi: 10.1093/molbev/msm153. [DOI] [PubMed] [Google Scholar]
- 17.Emerson JJ, Kaessmann H, Betran E, Long M. Extensive gene traffic on the mammalian X chromosome. Science. 2004;303:537–540. doi: 10.1126/science.1090042. [DOI] [PubMed] [Google Scholar]
- 18.Marques AC, Dupanloup I, Vinckenbosch N, Reymond A, Kaessmann H. Emergence of young human genes after a burst of retroposition in primates. PLoS Biol. 2005;3:e357. doi: 10.1371/journal.pbio.0030357. [DOI] [PMC free article] [PubMed] [Google Scholar]
- 19.Ting CT, Tsaur SC, Wu ML, Wu CI. A rapidly evolving homeobox at the site of a hybrid sterility gene. Science. 1998;282:1501–1504. doi: 10.1126/science.282.5393.1501. [DOI] [PubMed] [Google Scholar]
- 20.Clark AG, Eisen MB, Smith DR, Bergman CM, Oliver B, et al. Evolution of genes and genomes on the Drosophila phylogeny. Nature. 2007;450:203–218. doi: 10.1038/nature06341. [DOI] [PubMed] [Google Scholar]
- 21.Masly JP, Jones CD, Noor MA, Locke J, Orr HA. Gene transposition as a cause of hybrid sterility in Drosophila. Science. 2006;313:1448–1450. doi: 10.1126/science.1128721. [DOI] [PubMed] [Google Scholar]
- 22.Phadnis N, Orr HA. A single gene causes both male sterility and segregation distortion in Drosophila hybrids. Science. 2009;323:376–379. doi: 10.1126/science.1163934. [DOI] [PMC free article] [PubMed] [Google Scholar]
- 23.Mihola O, Trachtulec Z, Vlcek C, Schimenti JC, Forejt J. A mouse speciation gene encodes a meiotic histone H3 methyltransferase. Science. 2009;323:373–375. doi: 10.1126/science.1163601. [DOI] [PubMed] [Google Scholar]
- 24.Khaitovich P, Hellmann I, Enard W, Nowick K, Leinweber M, et al. Parallel patterns of evolution in the genomes and transcriptomes of humans and chimpanzees. Science. 2005;309:1850–1854. doi: 10.1126/science.1108296. [DOI] [PubMed] [Google Scholar]
- 25.Voolstra C, Tautz D, Farbrother P, Eichinger L, Harr B. Contrasting evolution of expression differences in the testis between species and subspecies of the house mouse. Genome Res. 2007;17:42–49. doi: 10.1101/gr.5683806. [DOI] [PMC free article] [PubMed] [Google Scholar]
- 26.Guenet JL, Bonhomme F. Wild mice: an ever-increasing contribution to a popular mammalian model. Trends Genet. 2003;19:24–31. doi: 10.1016/s0168-9525(02)00007-0. [DOI] [PubMed] [Google Scholar]
- 27.Aravin AA, Hannon GJ, Brennecke J. The Piwi-piRNA pathway provides an adaptive defense in the transposon arms race. Science. 2007;318:761–764. doi: 10.1126/science.1146484. [DOI] [PubMed] [Google Scholar]
- 28.Hendriksen PJ, Hoogerbrugge JW, Baarends WM, de Boer P, Vreeburg JT, et al. Testis-specific expression of a functional retroposon encoding glucose-6-phosphate dehydrogenase in the mouse. Genomics. 1997;41:350–359. doi: 10.1006/geno.1997.4673. [DOI] [PubMed] [Google Scholar]
- 29.Zhang J, Wheeler DA, Yakub I, Wei S, Sood R, et al. SNPdetector: a software tool for sensitive and accurate SNP detection. PLoS Comput Biol. 2005;1:e53. doi: 10.1371/journal.pcbi.0010053. [DOI] [PMC free article] [PubMed] [Google Scholar]
- 30.Mahler KL, Fleming JL, Dworkin AM, Gladman N, Cho HY, et al. Sequence divergence of Mus spretus and Mus musculus across a skin cancer susceptibility locus. BMC Genomics. 2008;9:626. doi: 10.1186/1471-2164-9-626. [DOI] [PMC free article] [PubMed] [Google Scholar]
- 31.Geraldes A, Basset P, Gibson B, Smith KL, Harr B, et al. Inferring the history of speciation in house mice from autosomal, X-linked, Y-linked and mitochondrial genes. Mol Ecol. 2008;17:5349–5363. doi: 10.1111/j.1365-294X.2008.04005.x. [DOI] [PMC free article] [PubMed] [Google Scholar]
- 32.Grivna ST, Beyret E, Wang Z, Lin H. A novel class of small RNAs in mouse spermatogenic cells. Genes Dev. 2006;20:1709–1714. doi: 10.1101/gad.1434406. [DOI] [PMC free article] [PubMed] [Google Scholar]
- 33.Grivna ST, Pyhtila B, Lin H. MIWI associates with translational machinery and PIWI-interacting RNAs (piRNAs) in regulating spermatogenesis. Proc Natl Acad Sci U S A. 2006;103:13415–13420. doi: 10.1073/pnas.0605506103. [DOI] [PMC free article] [PubMed] [Google Scholar]
- 34.Betel D, Sheridan R, Marks DS, Sander C. Computational analysis of mouse piRNA sequence and biogenesis. PLoS Comput Biol. 2007;3:e222. doi: 10.1371/journal.pcbi.0030222. [DOI] [PMC free article] [PubMed] [Google Scholar]
- 35.Bertone P, Stolc V, Royce TE, Rozowsky JS, Urban AE, et al. Global identification of human transcribed sequences with genome tiling arrays. Science. 2004;306:2242–2246. doi: 10.1126/science.1103388. [DOI] [PubMed] [Google Scholar]
- 36.Kampa D, Cheng J, Kapranov P, Yamanaka M, Brubaker S, et al. Novel RNAs identified from an in-depth analysis of the transcriptome of human chromosomes 21 and 22. Genome Res. 2004;14:331–342. doi: 10.1101/gr.2094104. [DOI] [PMC free article] [PubMed] [Google Scholar]
- 37.Birney E, Stamatoyannopoulos JA, Dutta A, Guigo R, Gingeras TR, et al. Identification and analysis of functional elements in 1% of the human genome by the ENCODE pilot project. Nature. 2007;447:799–816. doi: 10.1038/nature05874. [DOI] [PMC free article] [PubMed] [Google Scholar]
- 38.Sultan M, Schulz MH, Richard H, Magen A, Klingenhoff A, et al. A global view of gene activity and alternative splicing by deep sequencing of the human transcriptome. Science. 2008;321:956–960. doi: 10.1126/science.1160342. [DOI] [PubMed] [Google Scholar]
- 39.Cheng J, Kapranov P, Drenkow J, Dike S, Brubaker S, et al. Transcriptional maps of 10 human chromosomes at 5-nucleotide resolution. Science. 2005;308:1149–1154. doi: 10.1126/science.1108625. [DOI] [PubMed] [Google Scholar]
- 40.Ravasi T, Suzuki H, Pang KC, Katayama S, Furuno M, et al. Experimental validation of the regulated expression of large numbers of non-coding RNAs from the mouse genome. Genome Res. 2006;16:11–19. doi: 10.1101/gr.4200206. [DOI] [PMC free article] [PubMed] [Google Scholar]
- 41.Mercer TR, Dinger ME, Sunkin SM, Mehler MF, Mattick JS. Specific expression of long noncoding RNAs in the mouse brain. Proc Natl Acad Sci U S A. 2008;105:716–721. doi: 10.1073/pnas.0706729105. [DOI] [PMC free article] [PubMed] [Google Scholar]
- 42.Koziol MJ, Rinn JL. RNA traffic control of chromatin complexes. Curr Opin Genet Dev. 20:142–148. doi: 10.1016/j.gde.2010.03.003. [DOI] [PMC free article] [PubMed] [Google Scholar]
- 43.Mattick JS. A new paradigm for developmental biology. J Exp Biol. 2007;210:1526–1547. doi: 10.1242/jeb.005017. [DOI] [PubMed] [Google Scholar]
- 44.Forejt J. Hybrid sterility in the mouse. Trends Genet. 1996;12:412–417. doi: 10.1016/0168-9525(96)10040-8. [DOI] [PubMed] [Google Scholar]
- 45.McCarrey JR, Thomas K. Human testis-specific PGK gene lacks introns and possesses characteristics of a processed gene. Nature. 1987;326:501–505. doi: 10.1038/326501a0. [DOI] [PubMed] [Google Scholar]
- 46.Bradley J, Baltus A, Skaletsky H, Royce-Tolland M, Dewar K, et al. An X-to-autosome retrogene is required for spermatogenesis in mice. Nat Genet. 2004;36:872–876. doi: 10.1038/ng1390. [DOI] [PubMed] [Google Scholar]
- 47.Bastos H, Lassalle B, Chicheportiche A, Riou L, Testart J, et al. Flow cytometric characterization of viable meiotic and postmeiotic cells by Hoechst 33342 in mouse spermatogenesis. Cytometry A. 2005;65:40–49. doi: 10.1002/cyto.a.20129. [DOI] [PubMed] [Google Scholar]
- 48.Homolka D, Ivanek R, Capkova J, Jansa P, Forejt J. Chromosomal rearrangement interferes with meiotic X chromosome inactivation. Genome Res. 2007;17:1431–1437. doi: 10.1101/gr.6520107. [DOI] [PMC free article] [PubMed] [Google Scholar]
- 49.Smyth G. Limma: linear models for microarray data. In: Gentleman R, Carey V, Dudoit S, Izarry K, Huber W, editors. Bioinformatics and Computational Biology Solutions using R and Bioconductor. New York: Springer; 2005. pp. 397–420. [Google Scholar]
- 50.Kent WJ, Sugnet CW, Furey TS, Roskin KM, Pringle TH, et al. The human genome browser at UCSC. Genome Res. 2002;12:996–1006. doi: 10.1101/gr.229102. [DOI] [PMC free article] [PubMed] [Google Scholar]
Associated Data
This section collects any data citations, data availability statements, or supplementary materials included in this article.
Supplementary Materials
A table summarizing all Mus spretus downregulated clusters.
(PDF)
A table summarizing GenBank mitochondrial sequences of Mus spretus that were used for sequence comparison to B6.
(PDF)
DNA sequence alignment of clusters from piRNA region: chr2:150,953,000-151,257,000.
(PDF)
Quantitative real-time PCRs on genomic DNA and testicular cDNA for piRNA regions on Chromosome 2. Comparisons between Spr, B6 and C3H.
(PDF)
Summary of Mus spretus upregulated clusters on chromosome 2.
(PDF)
Copy number evaluation of G6pdx in Spretus by quantitative real-time PCR.
(PDF)