

Abstract
This study mapped the fine scale functional representation of tactile and noxious heat stimuli in cortical areas around the central sulcus of anesthetized squirrel monkeys by using high-resolution BOLD fMRI at 9.4T. Noxious heat (47.5 °C) stimulation of digits evoked multiple spatially distinct and focal BOLD activations. Consistent activations were observed in areas 3a, 3b, 1 and 2 while less frequent activation was present in M1. Compared to tactile activations, thermal nociceptive activations covered more area and formed multiple foci within each functional area. In general, noxious heat activations in area 3b did not colocalize with tactile responses. The spatial relationships of heat and tactile activations in areas 3a and 1/2 varied across animals. Subsequent electrophysiological mapping confirmed the evoked heat and tactile BOLD signals were somatotopically appropriate. The magnitude and temporal profiles of the BOLD signals to noxious heat stimuli differed across cortical areas. Comparatively late peaking, but stronger signals were observed in areas 3b and 2; whereas earlier peaking, but weaker signals were observed in areas 3a, 1 and M1. In sum, this study not only confirmed the involvement of somatosensory areas of 3a, 3b, and 1, but also identified the engagements of area 2 and M1 in the processing of heat nociceptive inputs. Differential BOLD response profiles of the individual cortical areas along the central sulcus suggest these areas play different roles in the encoding of nociceptive inputs. Thermal nociceptive and tactile inputs may be processed by different clusters of neurons in different areas.
Keywords: functional MRI, noxious heat, primates, primary somatosensory cortex, hand
Introduction
BOLD fMRI has been widely used in localizing neural substrates of specific human brain functions because of its noninvasiveness and reasonable spatial (millimeters) and temporal (hundred of milliseconds or second) resolution. Application of BOLD fMRI in both healthy and pain patients has lead to the identification of a widely distributed brain network that is responsible for pain perception, but the functional roles of most of these brain regions remain to be identified. Among those, a particular debatable issue is the contribution of the primary somatosensory cortex (SI) in pain perception. Although many electrophysiological and functional mapping studies have supported an important functional role of SI in the representation of sensory discriminative aspects of pain such as location, intensity, duration, and quality of pain sensation, about half of the functional imaging studies failed to show increased signal in SI during painful stimulation (see reviews [2, 37, 56]). Similarly in primates, whereas nociceptive neurons have been identified in area 3a [4, 60], area 3b and area 1 [24, 25], the small number of studies using functional optical imaging of intrinsic signals (OIS) report a somewhat inconsistent pattern of SI activation in response to noxious stimuli that implicate either area 3a alone responds to noxious heat [54, 55] or areas 3a, 3b, and 1[4]. It is well established that SI is involved in processing innocuous tactile information. However, the spatial relationships between nociceptive heat and innocuous tactile responses within individual SI subregions remain unclear. In sum, the role of SI cortex, particularly the specific functions of its subregions, in the processing of nociceptive inputs needs to be further established.
With recent advances in functional MRI (fMRI), non-invasive functional mapping of larger areas of sensory cortex is now routinely achievable in non-human primates with sub-millimeter spatial resolution [7, 13, 14, 32, 34]. Our previous study on anesthetized squirrel monkeys at 9.4T has demonstrated the ability of detecting BOLD signal changes at submillimeter scale during innocuous tactile stimulation of fingers [7, 61]. To form a critical bridge between animal and human pain studies our strategy is to directly relate human fMRI to a combination of single unit electrophysiology and fMRI of nociceptive processing in primates. As a first step, this study examines the functional role of SI in primates in the representation of heat nociception. We used high-resolution fMRI to map the fine scale functional responses to noxious heat and tactile stimuli in cortical areas along the central sulcus including SI in the same animal. Our goals were to identify those SI sub-regions activated by noxious heat and characterize their fMRI response properties, compare the spatial location of those activated regions with innocuous tactile activations, and finally confirm the cortical identities of these sub-regions electrophysiologically and histologically.
2. Methods
2.1 Animal Preparation
Eleven squirrel monkeys and a total of twenty-four imaging sessions (thirteen noxious heat and eleven tactile imaging sessions) were included in this study. For the fMRI experiments each animal was initially sedated with ketamine hydrochloride (10 mg/kg)/atropine (0.05 mg/kg) and then maintained on mechanical ventilation with isoflurane anesthesia (0.5–1.1%) delivered in a 70:30 O2:NO2 mixture. After intubation, the animal was placed in a custom-designed MR cradle and the head secured with ear and head bars. 2.5% dextrose in saline was infused intravenously (3 ml/kg/hr) throughout the imaging session to prevent dehydration and provide caloric energy. SpO2 and heart rate (Nonin, Plymouth, MN), ECG, ET-CO2 (22–26 mmHg; Surgivet, Waukesha, WI), and respiratory pattern (SA instruments, Stony Brook, NY) were externally monitored. Rectal temperature was monitored (SA instruments) and maintained at 37.5–38.5 °C by means of a circulating water blanket (Gaymar Industries, Orchard Park, NY). Vital signs were monitored throughout the procedure from induction of anesthesia until full recovery. Standard procedures were used in the fMRI and electrophysiological studies as have been published previously [4, 7]. All procedures were in compliance with and approved by the Institutional Animal Care and Use Committee of Vanderbilt University.
2.2 Stimulus Protocol
Fingers were secured by gluing small pegs to the fingernails and fixing these pegs firmly in plasticine, leaving the glabrous surfaces available for thermal stimulation. A 30×30 CHEPS thermode (Medoc, Israel, ramp rate 70 °C/s) was used to deliver noxious heat stimulus, and was positioned over all fingers. To map the neural responses of noxious thermal stimulation of the fingertips, we alternated blocks of a baseline temperature (32 °C, 30 sec in duration) and a noxious heat temperature (47.5 °C, 24 sec in duration). Contact thermode remained in contact with the skin during temperature changes. An innocuous vibrotactile stimulus was delivered on distal finger pads by indentation of a rounded plastic probe (in 2 mm diameter) mounted on a piezoceramic actuator (Noliac, Denmark) that was driven by a Grass stimulator. At a rate of 8 Hz the probe was indented 0.48 mm in 30 sec on blocks. During off blocks, the probe was lightly touching the skin. Typically, each stimulus condition was repeated 7 (for tactile) or 9 (for heat) times within one run, and multiple imaging runs were performed within one imaging session. The MR scanner controlled the stimulus timing by sending trigger pulses to the Grass stimulator and Medoc system to start each stimulus epoch within one run.
2.3 MR Methods
All scans were performed on a 9.4T 21-cm narrow-bore Varian Inova magnet (Varian Medical Systems, Palo Alto, CA) using a 3 cm surface transmit-receive coil centered over the contralateral SI cortex of the stimulated hand. Scout coronal images (15 slices) using a gradient-echo sequence were used to plan oblique structural and functional slices. Because the goal of this study was to identify cortical areas around the central sulcus that are involved in the processing of heat nociceptive inputs, to maximize the mapping power, one 2 mm thick oblique image slice (the top one of the four imaging slices) with an in-plan resolution of 0.55 × 0.55 mm2 was centered over the central sulcus so as to include SI cortex (Fig. 1A). A high resolution T2* weighted gradient echo structural image (repetition time (TR), 200 ms; echo time (TE), 14 ms, 512 × 512 matrix; 78 × 78 × 2000 μm3 resolution) was acquired to visualize blood vessel features such as surface and transcortical veins (arrows and color dots in Fig. 1D), which were used for coregistration of MRI maps with surface blood vessel maps obtained during electrode recording sessions (Fig. 1F) and for MRI maps obtained across imaging sessions conducted on different days (Fig. 1E). In this top oblique slice (Fig. 1D), large- and medium- sized surface veins as well as the penetrating trans-cortical veins (small black dots, some highlighted by color dots in Fig. 2D and E) were clearly visible on the T2* weighted structural image. Figure 1B & C show anatomically and electrophysiologically determined maps of the hand area of SI [22] for localizing region of interests in fMRI activation maps. FMRI data were acquired from the same slice using a gradient echo planar imaging (GE-EPI) sequence (TE = 16 ms; 64 × 64 matrix; 0.55 × 0.55 × 2 mm3 resolution). A TR of either 1.5 s or 2.0 s on individual scans was adjusted to match the ventilation rate to minimize respiration induced signal variations in BOLD signal timecourses. Typically one experiment lasted 6 hours, so functional images acquired within the same experiment (e.g. in response to the same temperature stimulus) could be several hours apart.
Figure 1. Placement of imaging slice and imaging coregistration.
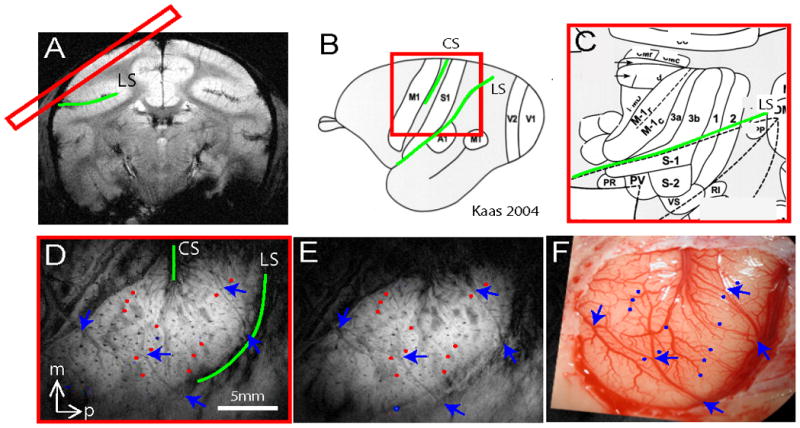
(A) One oblique image slice (red rectangle) was positioned to cover SI and M1 contralateral to stimulated fingers. (D) T2* weighted oblique structural image revealed central (CS) and lateral (LS) sulci (green lines) as well as other blood vessel features as indicated by blue arrows and red dots. (E) T2 weighted oblique structural image taken on different day revealing very similar blood vessel landmarks (arrows and dots). (F) Blood vessel map of the same region showing corresponding landmarks in D and E. Landmarks highlighted in D, E and F were used to coregister activations across image session and modality. (B & C) Brain schematic maps adapted from Kaas 2004 [22] illustrate the anterior to posterior organization of M1 to SI cortices in monkeys. (C) Zoomed-in view shows the detailed topographic organization of areas M1, 3a, 3b, 1 and 2 and their relative territory ratio. Note: the topographic organization and the territory span were determined electrophysiologically and anatomically.
Figure 2. Across-run nociceptive heat activations in two representative monkeys (M1 and M2).
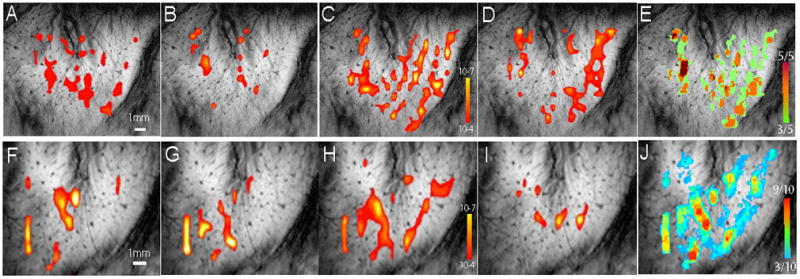
(A–D, F–I): Individual run nociceptive activation maps. Thresholded at p≤10−4 except activation in D was thresholded at p ≤ 10−6 (peak at 10−9) based in the method described in Zhang et al 2010 [62]. (E & J): Frequency maps generated in these two animals. Color bars indicate the frequency of activation incidence. E range: 3 out of 5 to 5 out of 5 runs. J range: 3 out of 10 to 8 out of 10 runs.
2.4 FMRI Data Analysis
Reconstructed images were imported into Matlab (Mathworks, Natick, MA) for analysis. The timecourses of the EPI data were drift corrected using a linear model fitted to each timecourse and temporally smoothed with a low-pass filter whose cut-off frequency was set at 0.25 Hz. No spatial smoothing was applied. The voxel-wise correlation of the functional timecourses to a boxcar function was calculated. The boxcar predictor was temporally shifted (two image frames) to compensate for the hemodynamic response delay. In line with our previous observations [61], 300–340 image volumes comprising 7 or 9 epochs of stimulus/baseline blocks were sufficient to detect activations at a statistical threshold of p≤10−4 (as a t value of 3.76) in a single run (uncorrected for multiple comparisons). This threshold was reasonable as we were focusing on an ROI covering approximately 20 × 20 × 1 voxels in volume, which amounts to a false negative rate of 2.5*10−3. We have previously quantified the relationship between threshold and activation pattern [62], and found that p threshold of ≤10−4 was appropriate to delineate digit activations, and provided repeatable activations in SI cortex at 9.4T [7, 62]. Activation maps were interpolated to the native structural resolution (512 × 512 matrix), and overlaid on high-resolution structural images for display. All maps are displayed as single condition activation maps.
2.5 Quantification of activation maps
To generalize an activation pattern and assess the reliability of activation in each location within one imaging session, which typically included three to ten runs, we generated convergence (or frequency) activation map. To illustrate this process, Figure 2 shows representative noxious heat activation patterns from four out of five activation runs (thresholded at ≤10−4) in case 1 (Fig. 2A–D, Monkey 1), and four out of 10 activation runs in case 2 (Fig. 2F–I, Monkey 2). After thresholding the activation maps, a convergence map (Fig. 2E&J) was generated to indicate the frequency of activation observed at each location across runs. The frequency of activation was color-coded: cold blue represented low frequency whereas hot red indicated more frequent activation. For example, at the dark red location in Fig. 2E, activation was observed in five out of all five runs. Several other locations coded as orange show the activation was observed in four out of five runs. For display, frequency maps were thresholded at 30% or above and overlaid on structural images. The same procedure was applied to all imaging sessions in all animals. We have previously observed inter-individual variations in the fine-grained topographic organization of SI mapped at high spatial resolution. Thus, in this study, we did not co-register activations across animals to maintain the highest spatial resolution possible and retain the unique activation pattern in each animal. The convergent activation map obtained for each imaging session was overlaid on the structural image for display.
We also calculated the timecourse and amplitude of BOLD signal changes at multiple spatially distinct region of interest (ROI), which were defined by their location on the average activation map within a session. BOLD signal profiles of each ROI were calculated for each run or session as appropriate. To assess the level of uncorrelated fluctuations in BOLD signal, control ROIs were randomly selected from nearby cortical areas that showed no significant positive or negative BOLD signal changes across runs. According to the categorization of activated voxels as determined by each individual cortical area’s neuronal response property and histological features, a timecourse of activation in each area was averaged across all eleven animals. To ensure all active voxels in a cluster were included in the timecourse analysis, we also examined activation maps in the oblique and coronal image planes in a 3D space (in SPM5). By revealing activated clusters in a 3D view, we could detect activation clusters that were ‘sliced’ into adjacent image slices. When this occurred, a complete set of voxels in a cluster that was located on different image slices was included in timecourse analysis. To parameterize the temporal profile of BOLD signals in each area, we fitted the averaged raw timecourses with a double gamma function. Details of the fitting were described in our previous paper [61].
2.7 Alignment of BOLD fMRI and blood vessel maps
These studies required image registration among three types of images: structural MRI images to structural MRI images across imaging sessions (MRI-MRI), structural MRI images to digital blood vessel images, and histology slices to blood vessel images. For the first two types of registration, we identified corresponding anatomical and blood vessel landmarks in each structural image such as the visible surface vessels (arrows in Fig. 2) and trans-cortical veins (color dots in Fig. 2); these coordinates were then put into a point-based registration algorithm (implemented in MATLAB, detail ref. [7]). The registration transformation between these two sets of coordinates was then applied to one activation image, thereby co-registering the functional MRI activation map to the structural MRI image (cf. [6, 16]). The same principles were applied to MRI - blood vessel coregistration. These landmarks in both structural MRI and blood vessel images were selected without a priori knowledge of the location of functional activations. A similar procedure was used to coregister blood vessel map to histology, but this was done manually in Adobe Photoshop software.
2.8. Identification of cortical areas: intracortical microelectrode mapping
Electrophysiological and histological information were used to identify subregions of SI. After the completion of fMRI sessions, a brief electrophysiological mapping procedure was used to locate the finger pad region of SI (Brodmann areas 3a, 3b, 1/2). The central sulcus was the anatomical landmark for approximately locating areas 3b and 1. Tungsten microelectrodes were inserted into superficial cortical layers. The responsive skin area of the unit activity was identified by initially palpating areas on the contralateral arm and hand while listening to the audio amplifier for spiking activity. Area 3b was identified by single and multiunit response properties on the basis of small receptive field size (restricted to a single finger), brisk responsiveness to light touch, and a lateral to medial topography of digits D1–D5. Area 1 was identified based on location, being found caudal to area 3b, and finding units typically with large receptive fields covering more than 1 finger [20, 52]. Area 3a units usually responded to deep pressure or proprioceptive stimulation (such as joint movement), and often have large undefined receptive fields. Area 3b was typically found slightly posterior to the central sulcus (see Fig. 4E Case 1 left), and Area 3a was located anterior to Area 3b. Cortical representations of the distal finger pads in area 3b and area 1 were segregated by the representations of the middle phalanges and palm (Sur et al. 1982) as a reversal of somatotopic organization [36, 38]. Topographically, distal finger pad regions in area 3b transition to distal finger pad region in area 3a, forming a tip-to-tip organization. The rostral areas 3a/3b border is characterized by a change in activation from cutaneous receptors to predominantly deep receptors. While also forming a tip-to-tip organization area 1 and area 2 border was indicated by a sharp reduction in responsiveness to cutaneous stimuli [39, 40]. Area 2 neurons often have large receptive fields that can encompass the entire hand. Many area 2 neurons responded to touch stimuli while other neurons responded only to stimulation of deeper receptors. Because of the large receptive fields of neurons, the somatotopic organization of digits in area 2 (and area 3a) is less well defined [17–19].
Figure 4. Comparison of nociceptive heat and tactile activations within SI in four representative monkeys (M1, M2, M5 and M6).

(A, E, I, M, Q): Color-coded activation convergence maps from four animals illustrate the frequency of detected activations (in each run) to noxious heat stimulation within each imaging session (five total, M and Q were repeats from the same animal). (B, F, J, N): Composite digit tactile activation maps of the same animals. Letters indicate the stimulated digits associated with the activation. (C, G, K, O): Color-coded digit representation maps as determined electrophysiologically by microelectrode mapping. Dotted lines indicate the estimated inter-areal borders. (D, H, L, P, R): Composite maps of heat and tactile fMRI activation patterns and electrophysiological maps in each animal. P and R were repeats across imaging sessions of the same animal. Color coded scale bars indicate the number of activated runs out of total of scanned runs (far right). Receptive field properties of each penetration were color-coded for different digits. A: anterior; p: posterior; m: middle; l: lateral. Scale bars: 1mm.
2.9. Identification of cortical areas through image coregistration with tissue histology
Upon the completion of the functional experiments, in four out of eleven animals, the brain tissue including somatosensory cortex and part of motor cortex around central sulcus was flattened, cut parallel to the pial surface, and processed for cytochrome oxidase (CO) and myelin fiber stains. CO stain (e.g. Fig. 5F) was used on the top thicker slices (100 μm) for visualizing blood vessel pattern of the cortex surface whereas the Myelin stain (Fig. 5E and H) of 40 μm slices was used to reveal digits regions in areas 3b and 1 (dense staining), area 3a and M1 border, and the hand-face border [44]. Large blood vessels were used as landmarks for coregistering MRI, electrophysiology and histology.
Figure 5. Localization of noxious heat and tactile activations with electrophysiology and histology in two monkeys (M7 and M8).

FMRI activation maps to noxious heat (A & G) and tactile (B & H) stimulation were aligned with electrophysiological blood vessel maps (C & I), and fiber Myelin stains (E & K) for determining activation locations. Color bars next to A and G represent the color-coded activation frequency observed in these two animals. In E and K, different Myelin stain features were present in different areas. These features include dense stain in areas 3b and 1 digit region separated by lightly stained palm region and dense stain in M1 but light stain in posterior nearby area 3a. The staining pattern was used to determine inter-areal borders (r.f. [44]). Arrows indicate the light myelin stain feature of the hand-face border in area 3b. For localization purposes, the inter-areal border lines were coregistered with other maps (C–D, I–J).
Standard tissue staining protocols were followed, with details described in [21, 44]. The processed brain sections were first examined with a projection microscope, and then digital images of representative sections were taken. Slice contours and blood vessels of the sequential sections were all used for alignment across sections. This alignment information also was used to coregister the histology with the fMRI and electrophysiology maps.
3. Results
FMRI data from eleven animals (twenty four imaging sessions total) are presented here. BOLD activation patterns evoked by heat and/or tactile stimulation in eight animals are illustrated in Figures 2–6. All animals are included in the timecourse analysis. Histology data obtained in two animals are presented in Figure 5.
Figure 6. Single trial BOLD signal timecourse during noxious heat stimulation of the fingers.

Statistical activation map to 47.5 °C stimulation was thresholded at p≤10−4 for displaying spatially distinct multiple activation foci (A). Color scale bar indicates the p value ranges. Single trial timecourses were plotted from six selected regions of interest (indicated by small color coded boxes and stars). (C–G). Yellow bars along the X-axis indicate the repeated 24 sec heat stimulation while the white space between bars indicate the 30 sec inter-stimulus interval without stimulus. Y-axis is the percentage BOLD signal change. Electrophysiological map was aligned to structural MRI image for the determination of cortical area, and the estimated inter-areal borders (dotted black lines in B). Neuronal receptive field properties at each penetration site were color coded as D1-green; D2-light blue; D3-red; D4-yellow; and D5-dark blue. Scale bar: 1mm.
3.1 Multiple noxious heat and tactile BOLD responsive foci in areas around central sulcus
Presentation of a noxious heat stimulus of 47.5 °C to the fingers evoked similar BOLD activations in multiple spatially distinct cortical regions. Four representative functional runs of monkeys 1 (M1) and 2 (M2) obtained within one imaging session were illustrated in Figure 2. Single run activations were similar in general, but variations also were apparent. By overlapping all the runs together, the common activation patterns shown in the convergence maps (Fig. 2E & J) in these two animals as well as in others (Fig. 4–6) highlighted the feature of widely distributed activation foci around the central sulcus. Highly frequent activations occurred in areas 3a, 3b, and 1/2 as indicated by the hot colors in these cases (r.f. color frequency bars on right next to Fig. 2E & J, Fig. 4D, H, L, P, R, and Fig. 5A & G). In contrast, tactile stimulation of individual fingers elicited fewer focal BOLD responses in relatively restricted areas close to the central sulcus (Fig. 3–5). Typically, digit activations of D2 (pink patch), D3 (blue patch), and D4 (red patch) organized in a lateral to medial manner. To compare with noxious heat responses, composite maps of single digit activations were generated and illustrated as pink outlines (Fig. 3–5).
Figure 3. Single digit tactile activations in two representative monkeys (M3 and M4).
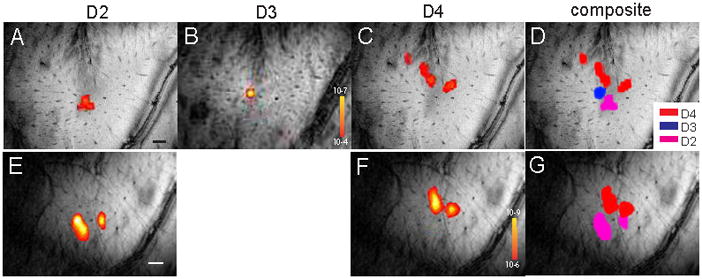
(A–C, E–F): Single condition tactile activation maps to individual digit stimulation (D2, D3 or D4). (D & G): Composite activation maps of D2–D4 (pink, blue, and red patches) in M3, and of D2 (pink) and D4 (red) in M4. Black and white bars in A and E indicate 1 mm spatial scale bar.
In order to localize the noxious heat and tactile activations, we also mapped this region by using microelectrode electrophysiology. Brodmann areas were determined based on neuronal receptive fields sizes, preferred stimulus, and the somatotopic organization pattern. On blood vessel maps (Fig. 4C, G, K, O, and Fig. 5C & I), individual digit response regions were color-coded at each penetration site. Based on this electrophysiological information along with the observed tactile activation pattern (Fig. 4B, F, J, N, and Fig. 5B & H) of each animal, we estimated the inter-areal borders. Additionally, in three animals (two cases were shown in Fig. 5), cytoarchitectonic feature of myelin stain were also used to define SI subregions and the inter-area borders. By taking into account of all the available information about cortical area identification, we determined that noxious heat responses were located in areas 3a, 3b, 1 and possibly in area 2. By referring to the established functional structure of this region in this species (review see [22, 23]), we also estimated that some activations may belong to the primary motor area (M1, we did not map this region). Across animals (13 noxious heat-imaging sessions), we found that the most consistently activated regions were in areas 3b and 1 (13/13 cases), followed by areas 2 (12/13, 92%) and 3a (11/13, 85%). While variable, activation in M1 was observed in 7/13 cases (54%). Consistent with our previous observations, tactile activations were observed in areas 3b 1, and in area 3a in some cases. Even with limited electrode penetrations sites, the tactile activations of the digits as obtained by fMRI matched fairly well with the electrophysiological maps (compare the colored dots with pink outlines in Figures 4 & 5). Most importantly, Brodmann areas identified by histological Myelin stain features showed agreement with the functional areas identified electrophysiologically.
3.2 Comparison of noxious heat and tactile activations within each functional area
To explore the spatial relationships between noxious heat and tactile responses in each area, we coregistered and overlaid fMRI activations (heat and tactile), electrophysiological and histological maps (in some cases), and compared them directly on an individual subject basis. For example, in case 1 (Fig. 4A–D) convergence map of heat activation (Fig. 4A), composite map of D2 (pink patch), D3 (blue patch), and D4 (red) tactile activations (Fig. 4B), and selected microelectrode electrophysiology (Fig. 4C, color coded dots represent receptive field properties at each penetration site) were overlaid together for direct comparison (Fig. 4D). To better illustrate their spatial relationships, tactile activations of D2–D4 were presented as pink outlines (Fig. 4D). Black dotted lines indicate the estimated inter-areal borders according to neuronal receptive field properties and organization of tactile activation. At D2 activation (lower pink patch in Fig. 4D) location, several penetrations obtained neurons that have D2 receptive fields (light blue dots). The spatial extent of fMRI D2 activation and penetration map correlated fairly well. At the bottom left corner of D3 activation (middle pink outline in Fig. 4D), two penetrations (pink dots) showed responses to D3 stimulation, confirming that this region is the representation of D3 in area 3b. Interestingly, within area 3b (the middle strip) pink outlines do not overlay with the color-coded heat activations (D). Similar spatial relationships were observed in all cases. In areas 3a or 1, however, extent of overlay varied (e.g. Fig. 4H versus L and P). In sum, close examination of these overlaid activation maps (Fig. 4D, H, L, P, R, and Fig. 5D & J) revealed several features. First of all, in comparison to the fewer focal tactile activations (pink outlines, composite maps of multiple digits activations), many noxious heat responsive foci were observed within each cortical area and across areas. Whereas tactile activation located mainly in the centers of areas 3b and 1, heat activations tend to spread in both the centers and the inter-areal borders in areas 3a, 3b and 1/2 (some in area M1). Secondly, with respect to the relative spatial relationship, tactile activations did not align with noxious heat responses, and were often located in between heat foci in area 3b. In areas 3a and 1/2, the spatial relationship between tactile and heat responses varied; it was colocalized in some cases (Fig. 4H, L and R, Fig 5D & J) and mismatched in others. Thirdly, M1 activation was only observed in noxious heat conditions. Finally, noxious heat activations in areas 3b and 1/2 appeared to extend beyond the finger representation areas as assessed by the tactile BOLD responses and electrophysiological maps.
3.3 Differential temporal and magnitude profiles of BOLD signals across cortical areas
To evaluate the possible response differences across cortical areas, we also measured BOLD signal timecourses at each individual cortical area. Single trial timecourses derived from multiple regions of interest of one sample run (Fig. 6) showed robust and strong correlations between the noxious heat stimulus (orange boxes in Fig. 6C–G) and BOLD signal changes. Averaged event-related BOLD signal changes illustrated significant differences in amplitude and temporal profile of BOLD signals in the sub-areas of SI and M1 in this animal (Fig. 7). BOLD responses were about 70% stronger in areas 2 and 3b (peak amplitudes of 1.43% and 0.91%, respectively, Fig. 7B, red and green lines) than in areas 3a, 1 and M1 (0.35%, 0.28%, 0.33%; blue, yellow, and orange lines, respectively in Fig. 7B). The mean signal difference between groups of areas 3b/2 and areas 3a/1//M1 was statistically significant (p<0.0001, t-test, 9 repeats for each area). Second, BOLD signals in different areas peaked at different times: areas 2 and 3b peaked several seconds later than the weaker responses in areas 1, 3a, and M1. Third, the duration of BOLD response was more sustained in areas 2 and 3b, in areas that responded strongly, while in areas 1, 3a and M1 the responses peaked earlier and then began to decline before the end of the stimulus presentation.
Figure 7. Temporal profiles of noxious heat evoked BOLD signal changes in subregions of SI and M1 in monkey 1.

(A) Timecourses of BOLD signals in six-selected response clusters in areas 3a, 3b, 1, 2, M1, and one control region during 24 sec 47.5°C heat stimulation (red line). Error bars indicate the standard deviations of signal change. (B) Plot of signal magnitudes and temporal profiles across cortical areas. Y-axis: % signal change; X-axis: time in sec.
These response profiles, and the differences in response between areas, were consistent and reproducible across runs and sessions within and across animals (Fig. 8), and were larger than the fluctuations in BOLD signal observed in control “non-stimulated/non-activated” locations (e.g. the more lateral face representation region). Signals in areas 3b and 2 were of greater amplitude and of longer duration, and had longer time-to-peak measures, than signals in areas 3a, 1 and M1, which were weaker and were shorter in duration where the signals began to decline before the end of the stimulus. Peak percentage BOLD signal changes in M1, area 3a, area 3b, area 1 and area 2 were 0.21% ± 0.04%, 0.27% ± 0.07%, 0.46% ± 0.09%, 0.28% ± 0.16%, 0.41% ± 0.35% (mean ± se), respectively. The across-areas temporal differences of BOLD signals are apparent in Fig. 8C where the BOLD timecourses were normalized to their peak response. To parameterize the BOLD response profiles, we fitted the raw timecourse from each area to a classic two-gamma function (Fig. 8B). Table 1 summarized the derived values of peak responses (% signal changes), and time to peak (TTP). In sum, these data illustrated that noxious heat elicited spatially distinct, resolvable activations in all four subregions of SI, and in M1. Areas 3b and 2 and areas 3a and M1 shared similar profiles of noxious heat responses, respectively.
Figure 8. Comparison of average BOLD timecourses and two gamma fittings across animals in different cortical areas.

(A). Plot of average timecourses of BOLD signal changes in each area. (B) Two gamma curve fits of raw average BOLD timecourses from all cases. (C) Plot of normalized BOLD signal changes across areas. Grey bars: stimulus presentation period.
Table 1. Comparison of gamma fitting parameters across areas.
Two gamma fitting results
| area 3b | area 1 | area 2 | area 3a | m1 | |
|---|---|---|---|---|---|
| Fit (r2) | 0.88 | 0.65 | 0.96 | 0.97 | 0.58 |
| Peak (%) | 0.45 | 0.32 | 0.40 | 0.26 | 0.24 |
| TTP (sec) | 15.1 | 9.45 | 15.2 | 12.4 | 9.1 |
4. Discussion
4.1 Involvement of SI subregions in thermal nociceptive information processing
In primates the involvement of individual areas within SI in nociceptive processing, and if it is so, their specific functional roles have not been established. As a first step toward addressing this issue, by measuring BOLD signal changes evoked by nociceptive heat stimuli, we provided evidence supporting the involvement of areas 3a, 3b, 1/2 as well as M1 in the processing of nociceptive heat stimuli. This finding not only confirmed our previous optical imaging findings of areas 3a, 3b and 1 involvement in mechanical nociceptive information processing, but also identified engagements of M1 and possibly area 2. In contrast to mechanical nociceptive stimulation, noxious heat activations did not colocalize with tactile responses in area 3b, and to various degree in areas 3a and 1. One should note that during noxious mechanical stimulation simultaneous excitation of innocuous mechanoreceptive neurons was unavoidable. The segregation of heat and tactile activation suggests that noxious heat versus innocuous mechanical inputs may be processed differently in different clusters of neurons.
Notably, noxious heat activations were larger in spatial extent than tactile activations as well as the corresponding digit regions identified electrophysiologically. This spatial mismatch could be explained partially by the nature of BOLD signal and incompleteness of microelectrode mapping, which in this study serves mainly as an independent reference of somatotopy. BOLD is a hemodynamic signal related to neuronal activities of a population of neurons residing within one imaging voxel [9]. Under this condition, a cluster of neurons with the same function (e.g. nociceptive specific) or neurons with mixed functions (e.g. nociceptive and mechanoreceptive) could give comparable BOLD signal changes. While the underlying neuronal basis of nociceptive heat activation needs to be further examined [31, 33, 48], BOLD signals still provide a means for evaluating activation patterns and quantifying response magnitudes and timecourses. Due to a technical limitation (a 30×30 mm2 sized thermal versus 2 mm dia. probes), the larger heat probe may have contributed to heat activations being spatially larger than tactile activations. However, because tactile and heat stimulating sites overlapped, the spatially shifted and mismatched centers of heat and tactile activation cannot be explained by the difference of stimulus size alone.
4.2 Possible roles of areas 3a, 3b, 1, 2 and M1 in nociception
The differential BOLD signal changes in magnitude and latency across areas suggest each area may have different roles in nociceptive processing. Areas 3b and 2 exhibited stronger responses than areas 3a, 1 and M1. This finding is in line with our previous optical imaging study where area 3b exhibited stronger responses to mechanical nociceptive stimulus than areas 3a and 1 [4]. The exact role of area 3b, however, in the encoding of thermal versus mechanical nociceptive inputs needs further examination.
With respect to the discrepancy in functional imaging reports on nociceptive activations in area 3a alone versus multiple areas (e.g. in areas 3b, 1 and 2) [4, 54, 55], we suspect that signal differences between the near infrared optical signal, intrinsic signal, and BOLD signal may have contributed at least partially to the difference. Functional imaging signals reflect metabolic and/or hemodynamic changes related to neuronal activity. Optical signals captured by 630 nm illumination (used in this study) have a tighter spatial relationship with underlying neuronal electrical activities whereas signals detected by near infrared light (e.g. 830nm) reflect mainly light scattering signals originated from cell swelling [43]. Furthermore, compared to the evidence supporting that some changes in optical signal are related to increases in neural activity, a neuronal basis for optical signal changes in the opposite direction (reduction of signal) has not been fully established, even though there is some evidence suggesting it is related to reduced neural activity [49, 55].
The finding of a stronger nociceptive response in area 2 than that in areas 3a and 1 was somewhat unexpected. Areas 3b and 1 participate in fine touch whereas areas 2 and 3a are involved in proprioception. Anatomical and electrophysiological evidences support functional hierarchical relationships from 3b to area 1, from area 1 to area 2, and from area 3a to area 2 [8, 15, 40–42]. In contrast, the functional hierarchical relationship for nociception within SI subregions is unknown. Our imaging studies in anesthetized monkeys suggest that sensitivity of cortical areas to anesthetics may somehow reflect their functional hierarchical position within the circuitry. For example, we have revealed stronger tactile response in area 3b than that in area 1 [5, 7, 12] in anesthetized experiments, however, area 1 response was greater than area 3b in awake state [5]. Similarly, stronger area 1 tactile response was also observed in awake humans (unpublished observation). We interpreted this inter-areal response pattern shift as an effect, at least partially, of differential sensitivity of cortical areas to anesthetics since it has long been recognized that higher order cortical areas are more sensitive to anesthesia. Therefore, if a hierarchical principle holds true in the processing of nociceptive information we would speculate that area 2 together with area 3b might serve as early processing areas in nociception. It is worth noting that from the somatotopic mapping point of view, finger representations in area 2 are often hard to determine because they are organized in a tip-to-tip mirror manner to area 1 in monkeys [39, 40]. Thus far, it is still an open question whether new world monkeys have an area 2 [22, 23]. Based on available measurements, in this study we assigned activations posterior to area 1 to area 2. While we are not completely confident about its location, at least it appears that there is more than one functional strip within the area1/area2 region.
The temporal differences of noxious heat evoked BOLD signals in different areas could be attributed to differences in the underlying neuronal activities, neural-vascular coupling, temporal features of hemodynamic response, and sensitivity to anesthetic. Weaker fittings of the hemodynamic response in areas 1 and M1 (r2 ~ 0.5) than other areas (r2>0.8) suggest different hemodynamic response functions among SI subregions and M1 cortex. The time to peak differences across areas may suggest some sort of directional temporal information flow, but BOLD signal acquisition at a much higher temporal rate (e.g. 250–500 ms per volume) and/or unit firing and local field potential measures would be needed to probe the inter-areal flow of information. Finally, there was a possibility that the image slice(s) prescribed for mapping SI cortex may have resulted the reduced total areas observed in some subregions due to the geometry difference between the image slice and brain curvature. In practice, when this situation occurred, the ‘sliced-out’ voxels in the deeper slice were included in the timecourse analysis. In summary, our fMRI mapping data not only support the involvement of areas 3a, 3b, 1, 2 and M1 in nociception, but also suggest different areas may play different roles.
4.3 Role of the primary motor cortex (M1) in nociceptive processing
Involvement of M1 cortex in pain perception has been reported in human imaging studies (see review [2, 37]). However, the specific function of M1 in pain perception (or modulation) is still unclear. Functional imaging, MEG, EEG, TMS studies in both normal and chronic pain patients [11, 46] suggest inhibitory interactions between pain and motor cortices [28]. Painful stimulation inhibits motor cortex excitability [45, 46]. After nociceptive stimulation, M1 area cerebral blood flow increases suggesting that motor cortical activity was influenced by painful stimuli [3, 59]. In chronic neuropathic pain patients, stimulation of M1 cortex show promising analgesia effects [26]. Similarly transcranial magnetic and electrical stimulation of motor cortex can apparently reduce intractable central pain [10, 51], complex regional pain syndrome, reviews see [1, 58], neuropathic pain [27, 29, 30, 35, 47, 50, 53], thalamic pain [57], and experimental pain [46]. These studies support an inhibitory interaction between sensory and motor areas. In this study, the M1 BOLD response to noxious heat stimulus further demonstrated the engagement of M1 in nociception. We were not able to determine the nature of the sensory-motor interaction we observed because BOLD signal measures hemodynamic changes related to neural activity that could be either excitatory or inhibitory. Since the animals were anesthetized, we can at least conclude that voluntary movement (or intention) is not required to generate BOLD signals in M1.
In conclusion by using combined high-resolution fMRI, microelectrode mapping, and histology on subsets of animals, this study not only confirmed the involvement of areas 3a, 3b, and 1 in nociceptive information processing, but also identified nociceptive responses in area 2 and M1 cortices. Within area 3b, noxious heat activations did not colocalize with tactile responses, suggesting different clusters of neurons in different areas may process thermal nociceptive and tactile inputs. Differential BOLD noxious heat responses in signal magnitude and temporal profile across areas 3a, 3b, 1, 2 and M1 suggest individual areas may play different roles in encoding of nociceptive inputs. We hypothesize that a perceived quality of a nociceptive stimulus is represented by inter-areal activation patterns within SI cortex.
Acknowledgments
We thank Chaohui Tang for her excellent technical assistance on animal preparation and tissue histology and Dr. Allen Newton for providing Matlab script for generating activation frequency maps. This work is supported by NIH grant R21 DA024831 to LMC. We declare that our research was conducted in accordance with the ‘statement of ethical standards’. Vanderbilt University IACUC approved all the procedures described in this manuscript.
Footnotes
Conflict of interest statement: There is no financial conflict of interest in publishing this manuscript.
Publisher's Disclaimer: This is a PDF file of an unedited manuscript that has been accepted for publication. As a service to our customers we are providing this early version of the manuscript. The manuscript will undergo copyediting, typesetting, and review of the resulting proof before it is published in its final citable form. Please note that during the production process errors may be discovered which could affect the content, and all legal disclaimers that apply to the journal pertain.
References
- 1.Alappat JJ. Motor cortex stimulation for chronic pain: systematic review and meta-analysis of the literature. Neurology. 2009;72(6):577. doi: 10.1212/01.wnl.0000344169.51931.e5. author reply 77. [DOI] [PubMed] [Google Scholar]
- 2.Apkarian AV, Bushnell MC, Treede RD, Zubieta JK. Human brain mechanisms of pain perception and regulation in health and disease. Eur J Pain. 2005;9(4):463–84. doi: 10.1016/j.ejpain.2004.11.001. [DOI] [PubMed] [Google Scholar]
- 3.Casey KL, Minoshima S, Morrow TJ, Koeppe RA. Comparison of human cerebral activation pattern during cutaneous warmth, heat pain, and deep cold pain. J Neurophysiol. 1996;76(1):571–81. doi: 10.1152/jn.1996.76.1.571. [DOI] [PubMed] [Google Scholar]
- 4.Chen LM, Friedman RM, Roe AW. Area-specific representation of mechanical nociceptive stimuli within SI cortex of squirrel monkeys. Pain. 2009;141(3):258–68. doi: 10.1016/j.pain.2008.11.018. [DOI] [PMC free article] [PubMed] [Google Scholar]
- 5.Chen LM, Friedman RM, Roe AW. Optical imaging of SI topography in anesthetized and awake squirrel monkeys. J Neurosci. 2005;25(33):7648–59. doi: 10.1523/JNEUROSCI.1990-05.2005. [DOI] [PMC free article] [PubMed] [Google Scholar]
- 6.Chen LM, Heider B, Williams GV, Healy FL, Ramsden BM, Roe AW. A chamber and artificial dura method for long-term optical imaging in the monkey. J Neurosci Methods. 2002;113(1):41–9. doi: 10.1016/s0165-0270(01)00475-7. [DOI] [PubMed] [Google Scholar]
- 7.Chen LM, Turner GH, Friedman RM, Zhang N, Gore JC, Roe AW, Avison MJ. High-resolution maps of real and illusory tactile activation in primary somatosensory cortex in individual monkeys with functional magnetic resonance imaging and optical imaging. J Neurosci. 2007;27(34):9181–91. doi: 10.1523/JNEUROSCI.1588-07.2007. [DOI] [PMC free article] [PubMed] [Google Scholar]
- 8.Cusick CG, Steindler DA, Kaas JH. Corticocortical and collateral thalamocortical connections of postcentral somatosensory cortical areas in squirrel monkeys: a double-labeling study with radiolabeled wheatgerm agglutinin and wheatgerm agglutinin conjugated to horseradish peroxidase. Somatosens Res. 1985;3(1):1–31. doi: 10.3109/07367228509144574. [DOI] [PubMed] [Google Scholar]
- 9.Davis KD. Neurophysiological and anatomical considerations in functional imaging of pain. Pain. 2003;105(1–2):1–3. doi: 10.1016/s0304-3959(03)00174-x. [DOI] [PubMed] [Google Scholar]
- 10.Defrin R, Grunhaus L, Zamir D, Zeilig G. The effect of a series of repetitive transcranial magnetic stimulations of the motor cortex on central pain after spinal cord injury. Arch Phys Med Rehabil. 2007;88(12):1574–80. doi: 10.1016/j.apmr.2007.07.025. [DOI] [PubMed] [Google Scholar]
- 11.Farina S, Tinazzi M, Le Pera D, Valeriani M. Pain-related modulation of the human motor cortex. Neurol Res. 2003;25(2):130–42. doi: 10.1179/016164103101201283. [DOI] [PubMed] [Google Scholar]
- 12.Friedman RM, Chen LM, Roe AW. Responses of areas 3b and 1 in anesthetized squirrel monkeys to single- and dual-site stimulation of the digits. J Neurophysiol. 2008;100(6):3185–96. doi: 10.1152/jn.90278.2008. [DOI] [PMC free article] [PubMed] [Google Scholar]
- 13.Fukuda M, Moon CH, Wang P, Kim SG. Mapping iso-orientation columns by contrast agent-enhanced functional magnetic resonance imaging: reproducibility, specificity, and evaluation by optical imaging of intrinsic signal. J Neurosci. 2006;26(46):11821–32. doi: 10.1523/JNEUROSCI.3098-06.2006. [DOI] [PMC free article] [PubMed] [Google Scholar]
- 14.Fukuda M, Rajagopalan UM, Homma R, Matsumoto M, Nishizaki M, Tanifuji M. Localization of activity-dependent changes in blood volume to submillimeter-scale functional domains in cat visual cortex. Cereb Cortex. 2005;15(6):823–33. doi: 10.1093/cercor/bhh183. [DOI] [PubMed] [Google Scholar]
- 15.Garraghty PE, Florence SL, Kaas JH. Ablations of areas 3a and 3b of monkey somatosensory cortex abolish cutaneous responsivity in area 1. Brain Res. 1990;528(1):165–9. doi: 10.1016/0006-8993(90)90213-u. [DOI] [PubMed] [Google Scholar]
- 16.Hill DL, Hawkes DJ, Crossman JE, Gleeson MJ, Cox TC, Bracey EE, Strong AJ, Graves P. Registration of MR and CT images for skull base surgery using point-like anatomical features. Br J Radiol. 1991;64(767):1030–5. doi: 10.1259/0007-1285-64-767-1030. [DOI] [PubMed] [Google Scholar]
- 17.Iwamura Y. Bilateral receptive field neurons and callosal connections in the somatosensory cortex. Philos Trans R Soc Lond B Biol Sci. 2000;355(1394):267–73. doi: 10.1098/rstb.2000.0563. [DOI] [PMC free article] [PubMed] [Google Scholar]
- 18.Iwamura Y, Iriki A, Tanaka M. Bilateral hand representation in the postcentral somatosensory cortex. Nature. 1994;369(6481):554–6. doi: 10.1038/369554a0. [DOI] [PubMed] [Google Scholar]
- 19.Iwamura Y, Tanaka M. Postcentral neurons in hand region of area 2: their possible role in the form discrimination of tactile objects. Brain Res. 1978;150(3):662–6. doi: 10.1016/0006-8993(78)90834-x. [DOI] [PubMed] [Google Scholar]
- 20.Iwamura Y, Tanaka M, Sakamoto M, Hikosaka O. Rostrocaudal gradients in the neuronal receptive field complexity in the finger region of the alert monkey’s postcentral gyrus. Exp Brain Res. 1993;92(3):360–8. doi: 10.1007/BF00229023. [DOI] [PubMed] [Google Scholar]
- 21.Jain N, Florence SL, Kaas JH. Reorganization of Somatosensory Cortex After Nerve and Spinal Cord Injury. News Physiol Sci. 1998;13:143–49. doi: 10.1152/physiologyonline.1998.13.3.143. [DOI] [PubMed] [Google Scholar]
- 22.Kaas JH. Evolution of somatosensory and motor cortex in primates. Anat Rec A Discov Mol Cell Evol Biol. 2004;281(1):1148–56. doi: 10.1002/ar.a.20120. [DOI] [PubMed] [Google Scholar]
- 23.Kaas JH, Collins CE. Anatomic and functional reorganization of somatosensory cortex in mature primates after peripheral nerve and spinal cord injury. Adv Neurol. 2003;93:87–95. [PubMed] [Google Scholar]
- 24.Kenshalo DR, Iwata K, Sholas M, Thomas DA. Response properties and organization of nociceptive neurons in area 1 of monkey primary somatosensory cortex. J Neurophysiol. 2000;84(2):719–29. doi: 10.1152/jn.2000.84.2.719. [DOI] [PubMed] [Google Scholar]
- 25.Kenshalo DR, Jr, Isensee O. Responses of primate SI cortical neurons to noxious stimuli. J Neurophysiol. 1983;50(6):1479–96. doi: 10.1152/jn.1983.50.6.1479. [DOI] [PubMed] [Google Scholar]
- 26.Landau WM, Thach WT., Jr Motor cortex stimulation for chronic pain: systematic review and meta-analysis of the literature. Neurology. 2009;72(23):2055–6. doi: 10.1212/01.wnl.0000349657.76899.6c. author reply 56. [DOI] [PubMed] [Google Scholar]
- 27.Lefaucheur JP, Drouot X, Cunin P, Bruckert R, Lepetit H, Creange A, Wolkenstein P, Maison P, Keravel Y, Nguyen JP. Motor cortex stimulation for the treatment of refractory peripheral neuropathic pain. Brain. 2009;132(Pt 6):1463–71. doi: 10.1093/brain/awp035. [DOI] [PubMed] [Google Scholar]
- 28.Lefaucheur JP, Drouot X, Menard-Lefaucheur I, Keravel Y, Nguyen JP. Motor cortex rTMS restores defective intracortical inhibition in chronic neuropathic pain. Neurology. 2006;67(9):1568–74. doi: 10.1212/01.wnl.0000242731.10074.3c. [DOI] [PubMed] [Google Scholar]
- 29.Lefaucheur JP, Jarry G, Drouot X, Menard-Lefaucheur I, Keravel Y, Nguyen JP. Motor cortex rTMS reduces acute pain provoked by laser stimulation in patients with chronic neuropathic pain. Clin Neurophysiol. doi: 10.1016/j.clinph.2009.12.028. [DOI] [PubMed] [Google Scholar]
- 30.Leung A, Donohue M, Xu R, Lee R, Lefaucheur JP, Khedr EM, Saitoh Y, Andre-Obadia N, Rollnik J, Wallace M, Chen R. rTMS for suppressing neuropathic pain: a meta-analysis. J Pain. 2009;10(12):1205–16. doi: 10.1016/j.jpain.2009.03.010. [DOI] [PubMed] [Google Scholar]
- 31.Logothetis NK. The underpinnings of the BOLD functional magnetic resonance imaging signal. J Neurosci. 2003;23(10):3963–71. doi: 10.1523/JNEUROSCI.23-10-03963.2003. [DOI] [PMC free article] [PubMed] [Google Scholar]
- 32.Logothetis NK, Guggenberger H, Peled S, Pauls J. Functional imaging of the monkey brain. Nat Neurosci. 1999;2(6):555–62. doi: 10.1038/9210. [DOI] [PubMed] [Google Scholar]
- 33.Logothetis NK, Pauls J, Augath M, Trinath T, Oeltermann A. Neurophysiological investigation of the basis of the fMRI signal. Nature. 2001;412(6843):150–7. doi: 10.1038/35084005. [DOI] [PubMed] [Google Scholar]
- 34.Malach R, Amir Y, Harel M, Grinvald A. Relationship between intrinsic connections and functional architecture revealed by optical imaging and in vivo targeted biocytin injections in primate striate cortex. Proc Natl Acad Sci U S A. 1993;90(22):10469–73. doi: 10.1073/pnas.90.22.10469. [DOI] [PMC free article] [PubMed] [Google Scholar]
- 35.Meyerson BA, Lindblom U, Linderoth B, Lind G, Herregodts P. Motor cortex stimulation as treatment of trigeminal neuropathic pain. Acta Neurochir Suppl (Wien) 1993;58:150–3. doi: 10.1007/978-3-7091-9297-9_34. [DOI] [PubMed] [Google Scholar]
- 36.Nelson RJ, Sur M, Felleman DJ, Kaas JH. Representations of the body surface in postcentral parietal cortex of Macaca fascicularis. J Comp Neurol. 1980;192(4):611–43. doi: 10.1002/cne.901920402. [DOI] [PubMed] [Google Scholar]
- 37.Peyron R, Laurent B, Garcia-Larrea L. Functional imaging of brain responses to pain. A review and meta-analysis. Neurophysiol Clin. 2000;30(5):263–88. doi: 10.1016/s0987-7053(00)00227-6. [DOI] [PubMed] [Google Scholar]
- 38.Pons TP, Garraghty PE, Cusick CG, Kaas JH. A sequential representation of the occiput, arm, forearm and hand across the rostrocaudal dimension of areas 1, 2 and 5 in macaque monkeys. Brain Res. 1985;335(2):350–3. doi: 10.1016/0006-8993(85)90492-5. [DOI] [PubMed] [Google Scholar]
- 39.Pons TP, Garraghty PE, Cusick CG, Kaas JH. The somatotopic organization of area 2 in macaque monkeys. J Comp Neurol. 1985;241(4):445–66. doi: 10.1002/cne.902410405. [DOI] [PubMed] [Google Scholar]
- 40.Pons TP, Kaas JH. Corticocortical connections of area 2 of somatosensory cortex in macaque monkeys: a correlative anatomical and electrophysiological study. J Comp Neurol. 1986;248(3):313–35. doi: 10.1002/cne.902480303. [DOI] [PubMed] [Google Scholar]
- 41.Porter LL. Patterns of connectivity in the cat sensory-motor cortex: a light and electron microscope analysis of the projection arising from area 3a. J Comp Neurol. 1991;312(3):404–14. doi: 10.1002/cne.903120308. [DOI] [PubMed] [Google Scholar]
- 42.Porter LL, Izraeli R. The effects of localized inactivation of somatosensory cortex, area 3a, on area 2 in cats. Somatosens Mot Res. 1993;10(4):399–413. doi: 10.3109/08990229309028846. [DOI] [PubMed] [Google Scholar]
- 43.Pouratian N, Toga AW. Optical Imaging Based on Intrinsic Signal. Academic Press; 2002. pp. 97–137. [Google Scholar]
- 44.Qi HX, Kaas JH. Myelin stains reveal an anatomical framework for the representation of the digits in somatosensory area 3b of macaque monkeys. J Comp Neurol. 2004;477(2):172–87. doi: 10.1002/cne.20247. [DOI] [PubMed] [Google Scholar]
- 45.Raij TT, Forss N, Stancak A, Hari R. Modulation of motor-cortex oscillatory activity by painful Adelta- and C-fiber stimuli. Neuroimage. 2004;23(2):569–73. doi: 10.1016/j.neuroimage.2004.06.036. [DOI] [PubMed] [Google Scholar]
- 46.Restuccia D, Valeriani M, Barba C, Le Pera D, Tonali P, Mauguiere F. Different contribution of joint and cutaneous inputs to early scalp somatosensory evoked potentials. Muscle Nerve. 1999;22(7):910–9. doi: 10.1002/(sici)1097-4598(199907)22:7<910::aid-mus15>3.0.co;2-v. [DOI] [PubMed] [Google Scholar]
- 47.Saitoh Y, Hirano S, Kato A, Kishima H, Hirata M, Yamamoto K, Yoshimine T. Motor cortex stimulation for deafferentation pain. Neurosurg Focus. 2001;11(3):E1. doi: 10.3171/foc.2001.11.3.2. [DOI] [PubMed] [Google Scholar]
- 48.Sereno ME, Trinath T, Augath M, Logothetis NK. Three-dimensional shape representation in monkey cortex. Neuron. 2002;33(4):635–52. doi: 10.1016/s0896-6273(02)00598-6. [DOI] [PubMed] [Google Scholar]
- 49.Simons SB, Chiu J, Favorov OV, Whitsel BL, Tommerdahl M. Duration-dependent response of SI to vibrotactile stimulation in squirrel monkey. J Neurophysiol. 2007;97(3):2121–9. doi: 10.1152/jn.00513.2006. [DOI] [PubMed] [Google Scholar]
- 50.Smith H, Joint C, Schlugman D, Nandi D, Stein JF, Aziz TZ. Motor cortex stimulation for neuropathic pain. Neurosurg Focus. 2001;11(3):E2. doi: 10.3171/foc.2001.11.3.3. [DOI] [PubMed] [Google Scholar]
- 51.Son BC, Lee SW, Choi ES, Sung JH, Hong JT. Motor cortex stimulation for central pain following a traumatic brain injury. Pain. 2006;123(1–2):210–6. doi: 10.1016/j.pain.2006.02.028. [DOI] [PubMed] [Google Scholar]
- 52.Sur M, Nelson RJ, Kaas JH. Representations of the body surface in cortical areas 3b and 1 of squirrel monkeys: comparisons with other primates. J Comp Neurol. 1982;211(2):177–92. doi: 10.1002/cne.902110207. [DOI] [PubMed] [Google Scholar]
- 53.Thomas L, Bledsoe JM, Stead M, Sandroni P, Gorman D, Lee KH. Motor cortex and deep brain stimulation for the treatment of intractable neuropathic face pain. Curr Neurol Neurosci Rep. 2009;9(2):120–6. doi: 10.1007/s11910-009-0020-y. [DOI] [PMC free article] [PubMed] [Google Scholar]
- 54.Tommerdahl M, Delemos KA, Favorov OV, Metz CB, Vierck CJ, Jr, Whitsel BL. Response of anterior parietal cortex to different modes of same-site skin stimulation. J Neurophysiol. 1998;80(6):3272–83. doi: 10.1152/jn.1998.80.6.3272. [DOI] [PubMed] [Google Scholar]
- 55.Tommerdahl M, Delemos KA, Vierck CJ, Jr, Favorov OV, Whitsel BL. Anterior parietal cortical response to tactile and skin-heating stimuli applied to the same skin site. J Neurophysiol. 1996;75(6):2662–70. doi: 10.1152/jn.1996.75.6.2662. [DOI] [PubMed] [Google Scholar]
- 56.Tracey I. Imaging pain. Br J Anaesth. 2008;101(1):32–9. doi: 10.1093/bja/aen102. [DOI] [PubMed] [Google Scholar]
- 57.Tsubokawa T, Katayama Y, Yamamoto T, Hirayama T, Koyama S. Chronic motor cortex stimulation in patients with thalamic pain. J Neurosurg. 1993;78(3):393–401. doi: 10.3171/jns.1993.78.3.0393. [DOI] [PubMed] [Google Scholar]
- 58.Velasco M, Velasco F, Romo R, Almanza X. Subcortical correlates of the auditory brain stem potentials in the monkey: bipolar EEG and multiple unit activity responses. Int J Neurosci. 1984;22(3–4):235–51. doi: 10.3109/00207458408990681. [DOI] [PubMed] [Google Scholar]
- 59.Weibull A, Bjorkman A, Hall H, Rosen B, Lundborg G, Svensson J. Optimizing the mapping of finger areas in primary somatosensory cortex using functional MRI. Magn Reson Imaging. 2008;26(10):1342–51. doi: 10.1016/j.mri.2008.04.007. [DOI] [PubMed] [Google Scholar]
- 60.Whitsel BL, Favorov OV, Li Y, Quibrera M, Tommerdahl M. Area 3a neuron response to skin nociceptor afferent drive. Cereb Cortex. 2009;19(2):349–66. doi: 10.1093/cercor/bhn086. [DOI] [PMC free article] [PubMed] [Google Scholar]
- 61.Zhang N, Gore JC, Chen LM, Avison MJ. Dependence of BOLD signal change on tactile stimulus intensity in SI of primates. Magn Reson Imaging. 2007;25(6):784–94. doi: 10.1016/j.mri.2007.05.002. [DOI] [PubMed] [Google Scholar]
- 62.Zhang N, Wang F, Turner GH, Gore JC, Avison MJ, Chen LM. Intra- and inter-subject variability of high field fMRI digit maps in somatosensory area 3b of new world monkeys. Neuroscience. 2010;165(1):252–64. doi: 10.1016/j.neuroscience.2009.09.066. [DOI] [PMC free article] [PubMed] [Google Scholar]