Abstract
We report on the use of photonic crystal surfaces as a high-sensitivity platform for detection of a panel of cancer biomarkers in a protein microarray format. The photonic crystal surface is designed to provide an optical resonance at the excitation wavelength of cyanine-5 (Cy5), thus providing an increase in fluorescent intensity for Cy5-labeled analytes measured with a confocal microarray scanner, compared to a glass surface. The sandwich enzyme-linked immunosorbent assay (ELISA) is undertaken on a microarray platform to undertake a simultaneous, multiplex analysis of 24 antigens on a single chip. Our results show that the resonant excitation effect increases the signal-to-noise ratio by 3.8- to 6.6-fold, resulting in a decrease in detection limits of 5–90%, with the exact enhancement dependent upon the antibody-antigen interaction. Dose-response characterization of the photonic crystal antibody microarrays shows the capability to detect common cancer biomarkers in the < 2 pg/ml concentration range within a mixed sample.
Introduction
Antibody microarray technology is a powerful platform for the detection of circulating biomarkers because it combines multiplexed detection, minimal reagent usage, and high sensitivity. Antibody microarrays have proven to be a valuable tool for studying cellular protein production and protein-protein interaction networks, and thus have potential applications as a clinical tool in disease diagnosis1–4, and drug discovery4. Through the use of calibration standards, protein microarrays provide measurements of analyte concentration that are highly quantitative5, 6, and sandwich assay protocols have been developed that demonstrate extremely low levels of nonspecific detection through the use of fluorophore-tagged secondary antibodies that enable multiplexed detection of cancer biomarkers in serum7, 8. In many clinically relevant applications, such as for detection of biomarker proteins that are expressed by cancer cells at a tumor site and subsequently diluted by the total blood volume of a person, a target protein may only be present at concentrations in the 1 – 100 pg/ml range9–12. There is substantial interest in extending limits of detection and generally increasing signal-to-noise ratio (SNR) in order to diagnose disease at the earliest possible stage and to quantify biomarker levels at concentrations that were below previous limits of detection (LOD).
Label-free biosensor transducer technologies have been used for direct detection of proteins with immobilized capture antibodies13–17 and application of various types of nanometer-scale particles can be used to enhance biosensor sensitivity18. However, fluorescence-based detection of chemically tagged analytes has been demonstrated as a robust, highly specific, and easily multiplexed method for achieving high sensitivity. As a result, several successful techniques have been used to enhance the fluorescence intensity and to extend fluorescence-based assays to lower concentrations. These methods include chemical enhancements (such as rolling circle amplification19 and tyramide amplification8), as well as special assay substrates that can increase the electromagnetic exposure of surface-bound fluorophores20–22.
Recently, we demonstrated that Photonic Crystal (PC) surfaces can achieve large enhancements for detection of fluorophore-tagged DNA and protein molecules through the use of narrow bandwidth optical resonances that are designed to occur at specific combinations of excitation wavelength and incident angle21, 23. PC Enhanced Fluorescence (PCEF) surfaces are engineered to provide a resonance at the same wavelength as a laser that is used to excite a fluorescent dye, resulting in elevated electric field magnitude in an evanescent field region ~100–200 nm above the PC surface (enhanced excitation). Simultaneously, the PC surface can be engineered to provide a second resonance at the wavelength of fluorophore emission, resulting in increased photon collection efficiency (enhanced extraction). The effects of the two phenomena are multiplicative, and have been used to obtain up to 588-fold overall signal enhancement compared to an ordinary glass substrate24.
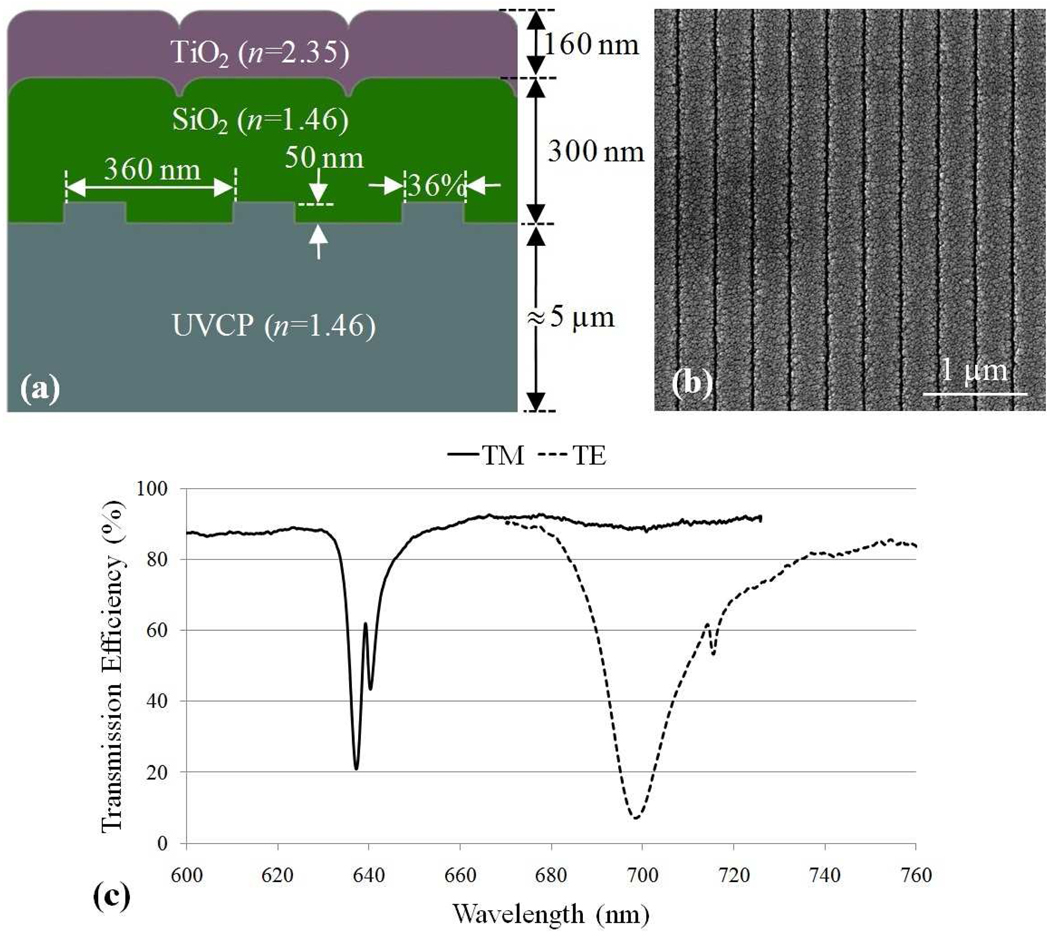
The PC is comprised of a surface structure that alternates between high and low regions in one dimension in a periodic fashion, as shown in Figure 1a–b. The surface structure for the PCs used in this report is formed from a polymer material on flexible plastic substrate (see Methods) using a large area replica molding process25. The periodic surface structure is subsequently coated with dielectric coatings of SiO2 and TiO2, where the high refractive index of the TiO2 is necessary to establish the formation of guided mode resonances that are confined to the PC surface and the media (air) directly in contact with it. As the PC resonator is comprised solely of dielectric materials, high quality-factor resonances with substantially higher electric field enhancement than achievable with surfaces based upon metals, and does so without the quenching effects that are observed for fluorophores in close proximity to metal26, 27. Because the PC surfaces are produced over large surface areas, they can be attached to standard glass microscope slides, so an entire 25×75 mm surface is entirely comprised of PC, and the devices can be measured using commercially available confocal microarray scanners. In recent reports, we have demonstrated the use of PCEF in the context of a 19,200-spot gene expression microarray23 and for detection of a single cancer biomarker in buffer21. This report extends our previous work to the first demonstration of a PCEF antibody microarray with simultaneous analysis of 24 cancer biomarkers.
Figure 1.
(a) A schematic cross section of the PC design that was used in this research. The grating period =360 nm, grating depth=50 nm, SiO2 thickness=300 nm, TiO2 thickness=160 nm, and duty cycle=36%. (b) Top view of a scanning electron micrograph of the grating structure. (c) Transmission spectrum of the photonic crystal at normal incidence. The resonance wavelength for the transverse magnetic polarization (TM, solid curve) is λ=629 nm and the resonance for transverse electric polarization (TE, dashed curve) occurs at λ=690 nm.
Materials and Methods
Reagents
(3-Glycidoxypropyl)trimethoxysilane (GPTS), phosphate buffered saline (PBS) powder, and Tween-20 were purchased from Sigma-Aldrich. Blocking solution containing 1% casein in PBS was purchased from Bio-Rad Laboratories. Streptavidin-conjugated Cy5 (SA-Cy5) was purchased from Amersham Bioscience. Antigens, primary capture antibodies, and secondary detection antibodies were purchased from R&D Systems unless otherwise noted. All detection antibodies were biotinylated when purchased. The antigens and antibodies used in this work are listed in Table S-1 (Supporting Information).
PC fabrication and characterization
The PC surface was fabricated by nanoreplica molding25. In brief, A Si wafer with a linear grating pattern (period = 360 nm, depth = 50 nm) permanently etched into its surface was fabricated by deep-UV photolithography followed by reactive ion etching. The grating pattern is created over a 150×75 mm area. The silicon wafer was used as a reusable mold by dispensing a thin liquid layer of ultraviolet curable polymer (UVCP) between a flexible sheet of polyethylene-terephthalate (PET) and the Si wafer. The liquid UVCP was cured to a solid state by exposure to high intensity UV light, after which the polymer replica was peeled away from the Si wafer. A layer of low refractive index SiO2 (thickness = 300 nm, n=1.45) was deposited on top of the UVCP grating layer by sputtering to spatially separate the resonant evanescent field from UVCP material, which displays a measurable autofluorescent output. Finally, a high refractive index layer of TiO2 (thickness= 160 nm, n=2.35) was deposited by sputtering. Microscope-slide-sized rectangles (25×75 mm) were cut from the plastic sheet and attached to a commercial microscope slide with clear adhesive film (3M) to create the finished PC slide.
The device resonance condition is observed by measuring the dip in the transmission spectrum when the PC is subjected to a broadband illumination, as shown in Figure 1c, for both TE-polarized (electric field parallel to the grating structure) and TM-polarized (electric field perpendicular to the grating structure) with illumination at 0° incidence. The resonance angle/wavelength and transmission efficiency are determined by the PC dimensions (such as grating period, grating depth, and duty cycle) as well as the refractive indices of the materials used. One can design a device to have a target resonance angle/wavelength by optimizing these parameters. Cy5 is a commonly used fluorescence dye due to its strong quantum yield and a readily available Helium-Neon excitation laser source. In this work since we have used a Cy5 labeling system, the PC was designed to have a TM-polarized resonance at the Cy5 excitation wavelength to achieve enhanced excitation and a TE-polarized resonance at the Cy5 emission wavelength for enhanced extraction.
Surface chemistry
An epoxysilane-based surface chemistry was selected for its high binding capacity28 and low background autofluorescence29. Before silane deposition, each slide was cleaned by sonication in vertical staining jars of isopropanol and deionized (DI) water for two minutes each. The slides were then dried under a stream of N2 and subjected to a 100W oxygen plasma for 10 minutes at a pressure of 0.75 mTorr. Next, a vapor-deposition of 3-glycidoxypropyl-trimethoxysilane was performed in a 500 ml glass staining dish by transferring 1 ml of the silane to the dish and then placing a glass rack loaded with the slides inside the dish. The dish was placed overnight in a vacuum oven at a temperature of 80°C and pressure of 30 Torr. The slides were removed from the glass rack and sonicated in vertical staining jars of toluene, methanol, and DI water for two minutes each and then dried under a stream of N2. Slides were stored in a vacuum desiccator until use.
Immunoassay protocol
Each slide was divided into 7 identical arrays by drawing ~2 mm wide hydrophobic barriers between arrays with a hydrophobic pen (Super HT Pap Pen, Research Products International Corp.). Capture antibodies were diluted in PBS to a concentration of 0.8 mg/ml and 8 replicate spots per assay were printed in each array on PC slides using a noncontact printer (GeSiM NanoPlotter 2.1, Quantum Analytics, Foster City, CA, USA). Following printing, the slides were incubated overnight at room temperature and 70% humidity. The slides were then blocked in a solution of 1% casein in PBS for 1 h at room temperature. After washing in PBS with 0.05% Tween (PBS-T), the slides were incubated overnight with a mixture of antigens and 0.1% casein in PBS at room temperature with gentle agitation. Standard curves were generated using a seven-fold dilution series of the antigen mix for a total of six antigen concentrations and a blank (only dilution buffer). The maximum concentration for each antigen is listed in Table S-1. The slides were then washed in PBS-T and followed by incubation with a mixture of biotinylated secondary detection antibodies at 25 ng/ml in PBS-T for 2 h. The slides were then washed with PBS-T to remove excess detection antibodies and were incubated in a solution of 1 µg/ml SA-Cy5 in PBS-T for 30 min. Finally, the slides were washed in PBS-T, centrifuged to remove standing liquid, and dried under house vacuum (~22 mm Hg) for 30 min.
Fluorescence detection and analysis
A confocal microarray scanner (LS Reloaded, Tecan) equipped with a λ=633 nm laser and user-adjustable incident angle was used to image the Cy5 fluorescent signal on the slide. ScanArray Express software (Perkin-Elmer) was used to quantify the spot and slide background intensities. ProMAT software, developed by Pacific Northwest National Laboratory specifically for the analysis of ELISA microarray data, was used to generate standard curves by fitting the fluorescence data to a four-parameter logistic curves5, 6. In cases where the data did not converge to this model, the standard curves were fit using a spline model. The LOD was also calculated by ProMAT as the concentration point on the standard curve corresponding to the mean plus three standard deviations of the log-transformed fluorescence intensities of the blank. ProMAT is freely available at www.pnl.gov/statistics/ProMAT.
Results and Discussions
Missing spots and printer issues
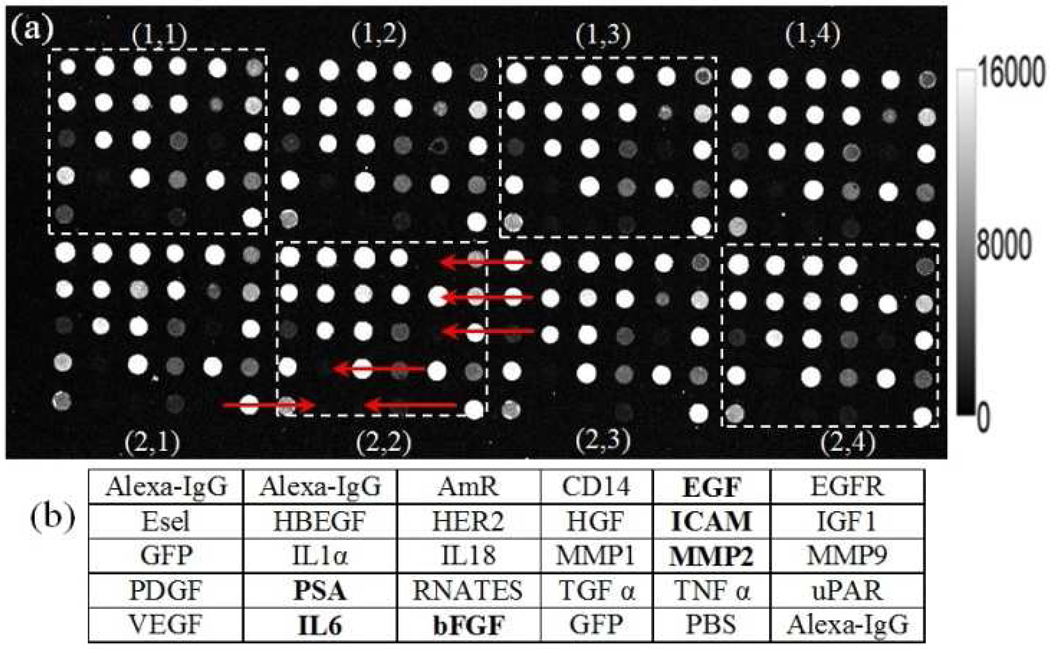
It is well known that antibodies deposited onto solid surfaces display distinct characteristics due to antibody-specific differences in charge, molecular structure, acidity, specificity, affinity, hydrophobicity, and stability. The diversity of protein structures poses a challenge for identifying a universal assay surface that maintains capture protein functionality equally for all the capture probes in a microarray, as discussed in the literature29–31. In this work, the fluorescent image of the array that was incubated with the highest concentration of the antigen mixture (Figure 2a) was used to identify any failed assays which might result from missing spots during the printing process or nonfunctional reagents which may have diminished binding capability due to denaturation during storage. Figure 2a consists of 8 blocks within a single array labeled as (1,1) – (1,4) and (2,1) – (2,4). Figure 2b shows the layout of the printed capture antibodies on each array. Alexa 633-labeled anti-sheep IgG was used to provide orientation spots in the upper left and lower right corners of every block. An antibody for green fluorescent protein (GFP) was printed within each block. GFP was also spiked into each antigen mixture, and a separate detection antibody for GFP was included in the detection antibody mixture. The signal from this GFP sandwich ELISA was used to normalize signal intensity across chips for the other assays32, 33. As a negative control, a spot of PBS buffer were printed within each block.
Figure 2.
(a) A fluorescent image of the highest antigen concentration is used to identify missing spots or nonfunctional assays. An array is comprised of eight replicate blocks. The scale bar is shown in the left with the unit in fluorescent signal. (b) Layout of the capture antibodies within one block. See Table S-1 for a list of assay abbreviations. Problematic assays are indicate by red arrows in Panel A, and by bold font in Panel B.
The assay abbreviations in boldface font in Figure 2b represent spots that displayed erratic assay responses. From the fluorescence image of Figure 2a, it can clearly be seen that: (i) EGF is missing on two replicates in blocks (2,2) and (2,4), (ii) ICAM has an abnormally high intensity on two spots in blocks (2,2) and (2,4) compared to the rest of the blocks, and (iii) MMP2, PSA, IL6 and bFGF have relatively low intensities in all the blocks. Issues (i) and (ii) occurred due to an error in the printer programming that resulted in the EGF antibody being printed on top of the ICAM spot, resulting in both assays being unusable. Issue (iii) is apparently related to problems with the antigens or detection antibodies, such as degradation during storage. For the following analysis, these 6 assays were excluded.
Raw fluorescence intensity
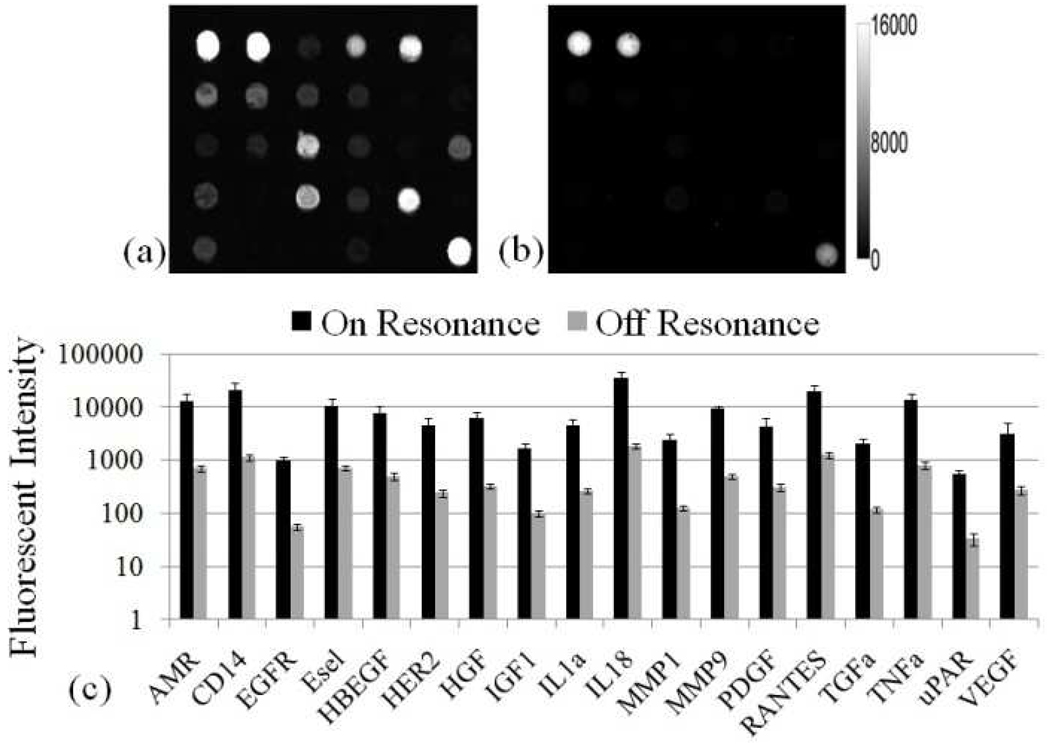
The PC is designed to increase the fluorescence intensity of Cy5 dyes through the enhanced excitation and extraction mechanisms described previously. The enhanced extraction effect is always present, regardless of the illumination conditions. In previous reports using the identical PC surface and detection instrument, we have demonstrated that enhanced extraction results in a ~4.8-fold increase in fluorescence intensity compared to detection on an unpatterned glass surface34. The effects of PC enhanced excitation can be determined by comparing the fluorescence output under the following two conditions: (a) when the excitation laser incident angle is adjusted to illuminate the PC at the resonant angle ("on-resonance"), and (b) when the excitation angle of incidence is selected to not coincide with the resonant coupling condition ("off-resonance"). Here, the on-resonant angle of illumination is ~0°, while the off-resonant angle is 20°. The fluorescent image of one block selected from the array exposed to the first dilution (maximum concentration divided by seven) is used to illustrate the observed signal enhancement when the PC is imaged on-resonance. The fluorescent images shown in Figure 3a–b are obtained using identical photomultiplier tube (PMT) gain settings. It can be observed in Figure 3c that by scanning the PC at its resonant angle, the fluorescence intensity is enhanced by factors of 11- to 20-fold.
Figure 3.
Fluorescence images of (a) PC on-resonance and (b) PC off-resonance for one block of the array exposed to the second highest analyte concentration. Both have the same fluorescent intensity scale shown in the left of (b). (c) Comparison of on-resonance and off-resonance measurements for each functional assay in the array for the second highest analyte concentration Error bars represent the standard deviation of eight replicate spots, taken across eight blocks in the array.
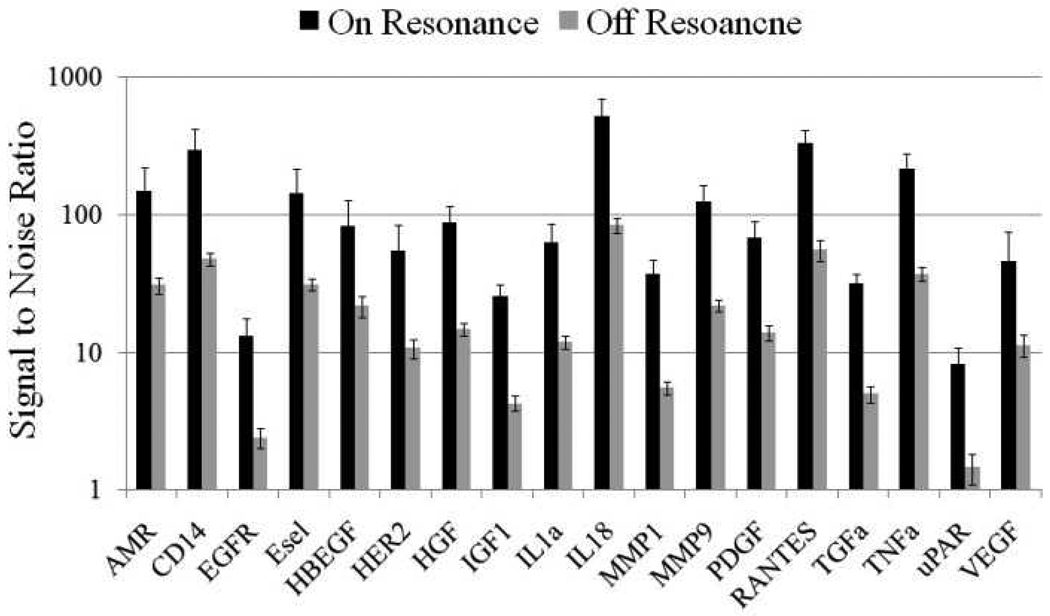
In order to determine the limits of detection, it is necessary to characterize the noise in terms of the magnitude of background fluorescence and the standard deviation of slide background intensity. The slide background intensity is defined as the fluorescent intensity outside of the printed antibody spots. The PC will enhance the output of any fluorophore within the evanescent field region, regardless of whether the source of the fluorescence is the Cy5 tag, autofluorescent material within the device structure, or autofluorescence from the chemical functionalization layer. Likewise, any nonspecific attachment of the SA-Cy5 tag to regions outside the capture spots will increase the level of background fluorescent intensity. When the PC is on-resonance, the background intensity is ~4-5-fold higher compared to the off-resonance condition. Due to the enhanced electric field on the PC surface, at resonance, the PC enhances both the spot intensity as well as the background intensity. We observe that the magnitude of the PC enhancement is greater within the capture spots than in the regions between the spots, and thus the PC provides an overall gain in the signal-to-background ratio. We define the SNR as the slide background-substracted net spot intensity divided by the standard deviation of slide background intensity. This metric represents how easily a spot can be distinguished from noise. As shown in Figure 4, the SNR is 3.8- to 6.6-fold higher for the functioning assays when the PC is on-resonance compared to off-resonance at the first dilution. As an example, we found that the increase in SNR is particularly important for detecting antigens EGFR and uPAR at concentrations as low as 3.6 and 7.1 ng/ml, respectively. When the PC is off-resonance, the spot signals for EGFR and uPAR at these same concentrations were noise-limited (SNR <3), which is to say that their spot intensities cannot be differentiated from the noise of the fluorescence in regions between spots. In contrast, these same spots were easily detectable (SNR >8) when the PC was at resonance. The ability to detect reduced concentrations of such antigens is extremely important to the early detection of disease biomarkers, which in general are present at very low concentrations in biological fluids such as plasma or serum.
Figure 4.
When on-resonance, the PC shows a 3.8- to 6.6-fold enhancement of SNR for all functional assays at first dilution.
Standard curves and limit of detection
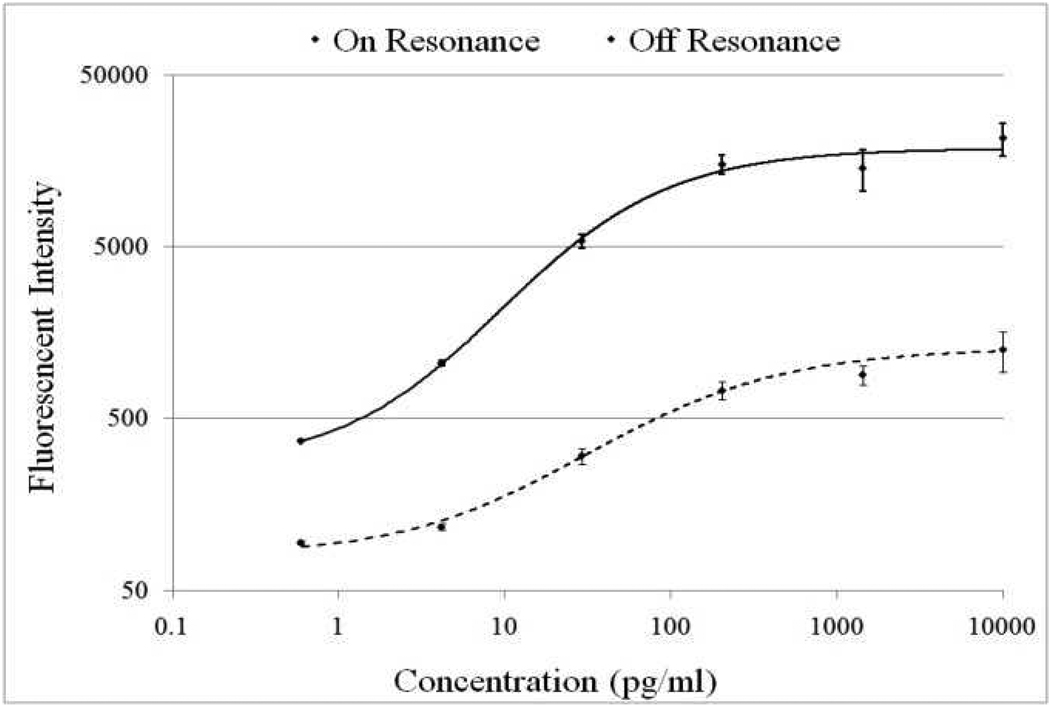
The signal intensities from each dilution in the concentration series were used to generate a standard curve using ProMat software. As an example, Figure 5 shows the standard curves for TNFα when the PC is on-resonance and off-resonance. The sensitivity is defined as the change in signal per unit change in concentration. A more pronounced change in the output signal for a given change in the concentration is desirable, as such a system can more accurately detect small changes in the concentration. We found that on-resonance, the PC demonstrated higher sensitivity as indicated by the steeper slope in the linear region of the standard curves. The sensitivity is 141 Fluorescent Intensity/(pg/ml) when the PC is on-resonance opposed to 5.31 Fluorescent Intensity/(pg/ml) when it is off-resonance, a resulting 26.5-fold enhancement.
Figure 5.
Standard curves for the TNFα assay when the PC slide is scanned at on-resonance (solid line) and off-resonance (dashed line) laser angles.
The LOD is defined at the concentration corresponding to the blank intensity (i.e., the intensity of the negative control spot of PBS buffer) plus three standard deviations from all assay spots. The LOD for functional assays for both off- and on-resonance are listed in Table 1. The LODs obtained in this work when the PC was on-resonance is between 1.9 ng/ml to 1.3 pg/ml. The LOD percentage change when the PC is on-resonance as compared to off-resonance as defined by Equation 1, and is also listed in Table 1.
Table 1.
The LOD (unit: pg/ml) obtained in the experiment for off- and on-resonance. The LOD values are improved by 5–90% when the PC is on-resonance, with the exception of PGDF.
| Assay | LOD (pg/ml) |
LOD % change |
|
|---|---|---|---|
| Off- Resonance |
On- Resonance |
||
| AmR | 320.0 | 206.8 | −35.6 |
| CD14 | 75.4 | 40.0 | −48.4 |
| EGFR | 3858.6 | 846.4 | −76.4 |
| Esel | 49.4 | 46.2 | −6.5 |
| HBEGF | 10.4 | 6.9 | −33 |
| HER2 | 214.7 | 43.7 | −79.6 |
| HGF | 108.3 | 11.8 | −89.1 |
| IGF1 | 1498 | 437.6 | −70.7 |
| IL1α | 50.0 | 16.0 | −68.0 |
| IL18 | 6.5 | 2.7 | −58.6 |
| MMP1 | 764.3 | 107.6 | −85.9 |
| MMP9 | 130.1 | 19.2 | −85.3 |
| PDGF | 8.3 | 9.9 | 19.3 |
| RANTES | 5.4 | 1.3 | −75.4 |
| TGFα | 7.2 | 1.3 | −81.5 |
| TNFα | 4.5 | 1.9 | −57.3 |
| uPar | 7519.1 | 1954.5 | −74.0 |
| (1) |
Negative values indicate a reduced (improved) LOD. We found that the LODs were improved by 5–90% for 17 of the 18 different assays when the PC was on-resonance. We did not observe an improvement in the LOD for the PDGF assay due to an unusually high spot intensity standard deviation when the PC was on-resonance.
Conclusion
In this work, a PC surface designed to provide optical resonances for the excitation wavelength (enhanced excitation) and emission wavelength (enhanced extraction) of Cy5 was used to amplify the fluorescence signal intensity measured from a multiplexed protein microarray for detection of a panel of breast cancer biomarkers. A surface-based sandwich assay was used in which a cocktail of secondary antibodies are exposed to the array after analyte hybridization to eliminate nonspecific interactions between the assays, while a SA-Cy5 label is used to tag the secondary antibodies. Comparison of fluorescent intensities measured with a commercially available confocal microarray laser scanner clearly demonstrates the signal gain obtained by illuminating the PC at the resonant condition. Compared to off-resonance illumination, the PC surface provides improvements in both the signal-to-noise ratio and the limits of detection. Dose-response characterization of the assays demonstrates detection limits in the range of 1.3 pg/ml - 1.9 ng/ml without chemical amplications, dependent upon the assay. PCEF is a promising technology for both reducing the detection limits for cancer biomarkers in serum to potentially enable disease diagnosis at an earlier stage, while at the same time providing greater resolution between similar biomarker concentrations.
Supplementary Material
Acknowledgement
This work was supported by the National Institutes of Health (Grant No. GM086382A), and the National Science Foundation (Grant No. CBET 07-54122). Any opinions, findings, conclusions, or recommendations expressed in this material are those of the authors and do not necessarily reflect the views of the National Institutes of Health or the National Science Foundation.
Footnotes
Supporting Information Available
Table S-1 with the maximum concentration for each antigen used in this work and the catalog number for each antigen, capture antibody and detection antibody. The material is available free of charge via the Internet at http://pubs.acs.org.
References
- 1.Brennan DJ, O'Connor DP, Rexhepaj E, Ponten F, Gallagher WM. Nat. Rev. Cancer. 2010;10:605–617. doi: 10.1038/nrc2902. [DOI] [PubMed] [Google Scholar]
- 2.Zhu H, Snyder M. Curr. Opin. Chem. Biol. 2003;7:55–63. doi: 10.1016/s1367-5931(02)00005-4. [DOI] [PubMed] [Google Scholar]
- 3.Haab BB. Proteomics. 2003;3:2116–2122. doi: 10.1002/pmic.200300595. [DOI] [PubMed] [Google Scholar]
- 4.Gloekler J, Angenendt P. J. Chromatogr. B. 2003;797:229–240. doi: 10.1016/j.jchromb.2003.08.034. [DOI] [PubMed] [Google Scholar]
- 5.Daly DS, White AM, Varnum SM, Anderson KK, Zangar RC. Bmc Bioinf. 2005;6(Article No.: 17) doi: 10.1186/1471-2105-6-17. [DOI] [PMC free article] [PubMed] [Google Scholar]
- 6.White AM, Daly DS, Varnum SM, Anderson KK, Bollinger N, Zangar RC. Bioinformatics. 2006;22:1278–1279. doi: 10.1093/bioinformatics/btl093. [DOI] [PubMed] [Google Scholar]
- 7.Gonzalez RM, Seurynck-Servoss SL, Crowley SA, Brown M, Omenn GS, Hayes DF, Zangar RC. J. Proteome Res. 2008;7:2406–2414. doi: 10.1021/pr700822t. [DOI] [PubMed] [Google Scholar]
- 8.Woodbury RL, Varnum SM, Zangar RC. J. Proteome Res. 2002;1:233–237. doi: 10.1021/pr025506q. [DOI] [PubMed] [Google Scholar]
- 9.Mannello F, Gazzanelli G. Breast Cancer Res. 2001;3:R238–R243. doi: 10.1186/bcr302. [DOI] [PMC free article] [PubMed] [Google Scholar]
- 10.Drukier AK, Ossetrova N, Schors E, Krasik G, Grigoriev I, Koenig C, Sulkowski M, Holcman J, Brown LR, Tomaszewski JE, Schnall MD, Sainsbury R, Lokshin AE, Godovac-Zimmermann J. J. Proteome Res. 2006;5:1906–1915. doi: 10.1021/pr0600834. [DOI] [PubMed] [Google Scholar]
- 11.Granato AM, Nanni O, Falcini F, Folli S, Mosconi G, De Paola F, Medri L, Amadori D, Volpi A. Breast Cancer Res. 2004;6:R38–R45. doi: 10.1186/bcr745. [DOI] [PMC free article] [PubMed] [Google Scholar]
- 12.Kim BK, Lee JW, Park PJ, Shin YS, Lee WY, Lee KA, Ye S, Hyun H, Kang KN, Yeo D, Kim Y, Ohn SY, Noh DY, Kim CW. Breast Cancer Res. 2009;11:R22–R34. doi: 10.1186/bcr2247. [DOI] [PMC free article] [PubMed] [Google Scholar]
- 13.Cunningham BT, Laing L. Expert Rev. Proteomics. 2006;3:271–281. doi: 10.1586/14789450.3.3.271. [DOI] [PubMed] [Google Scholar]
- 14.Washburn AL, Gunn LC, Bailey RC. Anal. Chem. 2009;81:9499–9506. doi: 10.1021/ac902006p. [DOI] [PMC free article] [PubMed] [Google Scholar]
- 15.Luchansky MS, Bailey RC. Anal. Chem. 2010;82:1975–1981. doi: 10.1021/ac902725q. [DOI] [PMC free article] [PubMed] [Google Scholar]
- 16.Homola J, Yee SS, Gauglitz G. Sens. Actuators, B. 1999;54:3–15. [Google Scholar]
- 17.Zhao XW, Liu ZB, Yang H, Nagai K, Zhao YH, Gu ZZ. Chem. Mater. 2006;18:2443–2449. [Google Scholar]
- 18.Zhang W, Kim SM, Ganesh N, Block ID, Mathias PC, Wu HY, Cunningham BT. J. Vac. Sci. Technol., A. 2010;28:996–1001. [Google Scholar]
- 19.Schweitzer B, Roberts S, Grimwade B, Shao WP, Wang MJ, Fu Q, Shu QP, Laroche I, Zhou ZM, Tchernev VT, Christiansen J, Velleca M, Kingsmore SF. Nat. Biotechnol. 2002;20:359–365. doi: 10.1038/nbt0402-359. [DOI] [PMC free article] [PubMed] [Google Scholar]
- 20.Yamaguchi T, Kaya T, Takei H. Anal. Biochem. 2007;364:171–179. doi: 10.1016/j.ab.2007.02.026. [DOI] [PubMed] [Google Scholar]
- 21.Mathias PC, Ganesh N, Cunningham BT. Anal. Chem. 2008;80:9013–9020. doi: 10.1021/ac801377k. [DOI] [PubMed] [Google Scholar]
- 22.Ganesh N, Block ID, Mathias PC, Zhang W, Chow E, Malyarchuk V, Cunningham BT. Opt. Express. 2008;16:21626–21640. doi: 10.1364/oe.16.021626. [DOI] [PubMed] [Google Scholar]
- 23.Mathias PC, Jones SI, Wu HY, Yang F, Ganesh N, Gonzalez DO, Bollero G, Vodkin LO, Cunningham BT. Anal. Chem. 2010;82:6854–6861. doi: 10.1021/ac100841d. [DOI] [PMC free article] [PubMed] [Google Scholar]
- 24.Wu H-Y, Zhang W, Mathias PC, Cunningham BT. Nanotechnology. 2010;21:125203. doi: 10.1088/0957-4484/21/12/125203. [DOI] [PubMed] [Google Scholar]
- 25.Block ID, Chan LL, Cunningham BT. Microelectron. Eng. 2007;84:603–608. [Google Scholar]
- 26.Glass AM, Liao PF, Bergman JG, Olson DH. Opt. Lett. 1980;5:368–370. doi: 10.1364/ol.5.000368. [DOI] [PubMed] [Google Scholar]
- 27.Kummerlen J, Leitner A, Brunner H, Aussenegg FR, Wokaun A. Mol. Phys. 1993;80:1031–1046. [Google Scholar]
- 28.Zhu H, Klemic JF, Chang S, Bertone P, Casamayor A, Klemic KG, Smith D, Gerstein M, Reed MA, Snyder M. Nat. Genet. 2000;26:283–289. doi: 10.1038/81576. [DOI] [PubMed] [Google Scholar]
- 29.Kusnezow W, Jacob A, Walijew A, Diehl F, Hoheisel JD. Proteomics. 2003;3:254–264. doi: 10.1002/pmic.200390038. [DOI] [PubMed] [Google Scholar]
- 30.Seurynck-Servoss SL, White AM, Baird CL, Rodland KD, Zangar RC. Anal. Biochem. 2007;371:105–115. doi: 10.1016/j.ab.2007.07.010. [DOI] [PMC free article] [PubMed] [Google Scholar]
- 31.Angenendt P, Glokler J, Sobek J, Lehrach H, Cahill DJ. J. Chromatogr. A. 2003;1009:97–104. doi: 10.1016/s0021-9673(03)00769-6. [DOI] [PubMed] [Google Scholar]
- 32.Daly DS, Anderson KK, Seurynck-Servoss SL, Gonzalez RM, White AM, Zangar RC. Stat. Appl. Genet. Mol. Biol. 2010;9(Article No.: 14) doi: 10.2202/1544-6115.1506. [DOI] [PubMed] [Google Scholar]
- 33.Zangar RC, Daly DS, White AM, Servoss SL, Tan RM, Collett JR. J. Proteome Res. 2009;8:3937–3943. doi: 10.1021/pr900247n. [DOI] [PubMed] [Google Scholar]
- 34.Mathias PC, Wu HY, Cunningham BT. Appl. Phys. Lett. 2009;95:021111–021113. doi: 10.1063/1.3184573. [DOI] [PMC free article] [PubMed] [Google Scholar]
Associated Data
This section collects any data citations, data availability statements, or supplementary materials included in this article.


