

Abstract
Background
Higher levels of inter-region functional coordination can facilitate emergence of neural activity as conscious percepts. We consequently tested the hypothesis that auditory/verbal hallucinations (AVHs) arise from elevated functional coordination within a speech processing network.
Methods
Functional coordination was indexed using functional connectivity (FC) computed from functional magnetic resonance imaging data. Thirty-two patients with schizophrenia reporting AVHs, 24 similarly diagnosed patients without hallucinations, and 23 healthy controls were studied. FC was seeded from a bilateral Wernicke’s region delineated according to activation detected during AVHs in a prior study.
Results
Wernicke’s-seeded FC with Brodmann Area 45/46 of the left IFG was significantly greater for hallucinating patients compared to nonhallucinating patients, but not compared to healthy controls. In contrast, Wernicke’s-seeded FC with a large subcortical region that included the thalamus, midbrain and putamen was significantly greater for the combined patient group compared with healthy controls after false discovery rate correction, but not when comparing the two patient groups. Within that subcortical domain, the putamen demonstrated significantly greater FC relative to a secondary left IFG seed region when hallucinators were compared to nonhallucinating patients. A follow-up analysis found that FC summed along a loop linking the Wernicke’s and IFG seed regions and the putamen was robustly greater for hallucinating patients compared to nonhallucinating patients and healthy controls.
Conclusions
These findings suggest that higher levels of functional coordination intrinsic to a corticostriatal loop comprise a causal factor leading to AVHs in schizophrenia.
Keywords: auditory verbal hallucinations, Wernicke’s area, putamen, schizophrenia, functional magnetic resonance imaging, functional connectivity
Between 60–80% of patients with schizophrenia experience auditory verbal hallucinations (AVHs) of spoken speech (1,2). These hallucinations often produce high levels of distress, and functional disability. Understanding the mechanism of AVHs may shed light on the pathophysiology of schizophrenia overall, and lead to more specific treatments.
A leading hypothesis is that AVHs are instances of inner speech misidentified as nonself due to a disruption of frontotemporal efference copy projections that ordinarily curtail activation of sensory systems arising from self-generated actions (3–7). This hypothesis is supported by studies showing non-suppression of the N100 event-related potential and impaired pre-speech inter-trial electroencephalographic (EEG) coherence in patients with AVHs (6,7). The efference copy mechanistic model is consistent with studies suggesting partial frontal disconnection in schizophrenia (8), and predicts that AVHs are distinguished from ordinary inner speech by virtue of excess experiential vividness or loudness.
A phenomenological study found, however, that patients rely on other aspects of AVH experience to distinguish them from their typical inner speech (9). For instance, AVHs generally are cast in distinct, nonself speaking voices, whereas inner speech is typically cast in the first-person voice. A second distinguishing feature of AVHs is verbal content experienced as uncharacteristic of the patient’s own inner speech. These experiential features of AVHs are not readily explained by disrupted efferent copy projections during inner speech.
An alternative and possibly complementary hypothesis accounting for these experiential features of AVHs is suggested by studies demonstrating that inter-region functional coordination plays an important role in determining whether neural activity is experienced consciously as percepts (10–13). AVHs consequently may arise from exaggerated functional coordination between frontal and bitemporal cortical sites that underlie perception of verbal content and voice characteristics of external speech (14–16). Spontaneous speech percepts “sounding” like distinct, nonself speakers could consequently emerge with unusual, unexpected or undesirable verbal content that ordinarily would inaccessible to consciousness.
Network coordination involving inferior frontal and temporal regions during speech perception has been detected as elevated functional connectivity (FC) computed from interregional correlations of functional magnetic resonance imaging (fMRI) activity (17–20). To test our model, FC was seeded from pooled sites in Wernicke’s and right homologous temporal regions found to activate during AVHs in a prior study by our group (21). This approach was designed to maximize chances of accessing speech processing areas directly involved in generating AVHs. Wernicke’s-seeded FC was computed for subregions of the left IFG based on studies highlighting the critical involvement of the latter during self-generated auditory imagery of spoken speech (22,23), perception of external speech (24,25), and AVHs themselves (26,27). Our prediction was that Wernicke’s-seed FC with subregions of IFG would be elevated in patients with AVHs compared to similarly diagnosed patients without AVHs and psychiatrically healthy control subjects. An exploratory, voxel-based analysis was also undertaken to identify other sites hyperconnected to the Wernicke’s seed region that may contribute to genesis of AVHs.
Methods
Subjects
Fifty-six symptomatically stable patients meeting DSM-IV criteria for schizophrenia or schizoaffective disorder based on the Structured Clinical Interview for DSM-IV Axis I Disorders (SCID – I/P; ref. 28) were enrolled. Twenty-three persons without histories of psychiatric disorders confirmed by assessment with the SCID–NP (29) were enrolled via advertisement. Subjects’ consent was obtained in accord with procedures established by the Yale School of Medicine Investigational Review Board, who approved this protocol. All participants were right-handed without histories of significant head trauma or neurological disorder, substance abuse during the prior month, substance dependence at any time, or estimated IQ<85. Patient belonged to two groups: those reporting AVHs of spoken speech for the prior 4 weeks at least once daily (N=32), and patients who never experienced AVHs or had not experienced them within 5 years prior to scanning (N=24). All but 3 patients (2 hallucinators and 1 non-hallucinator) received antipsychotic drugs when studied. Chlorpromazine (CPZ) equivalent dosages were calculated for second- and first-generation antipsychotic drugs (30–32). The Positive and Negative Symptom Scale (33) was used to match patient groups in terms of composite positive and negative symptom severity. The WAIS-III vocabulary score was used to estimate verbal intelligence.
Neuroimaging methods
Magnetic resonance imaging employed a Siemens 3T Trio scanner. Twenty-two 4 mm T1-weighted images were acquired parallel to the AC-PC line with 0.8 mm skip between images. Blood-oxygen-level dependent (BOLD) activity data were collected at the same slice locations in runs lasting four minutes, six seconds (164 gradient recalled, single shot echo planar images for each slice: TR = 1500 ms, TE = 30 ms, flip angle = 80 degrees, 64 × 64 acquisition matrix, 3.125 mm × 3.125 mm × 4.8 mm).
Patients were identified exhibiting high rates of intermittent AVHs (> once every three minutes) combined with sufficiently extended inter-hallucination intervals (majority of intervals greater than 15 seconds) to permit detection of corresponding waxing and waning neural co-activation as hemodynamically delayed and smoothed BOLD signal. Selection was based on extended hallucination monitoring prior to scanning using a mechanical counter. These patients (N=11) were instructed to depress/release a button to signal onset/offset of these events during functional runs. Their scan data were used to characterize time-course of BOLD activation associated with hallucination events that is reported separately (27). In order to control for effects of motorically depressing a button during scanning, some nonhallucinating patients (N=9) and normal control subjects (N=11) were instructed to depress a button spontaneously at random intervals approximating button depression rates and durations generated by hallucinating patients. Otherwise, no task was performed during scan runs. The nonhallucinating patients and healthy controls selected to generate random button-press behavior matched gender and age of hallucinating patients who motorically signaled hallucination events.
Computing FC
Functional pathways critical to vision, motor function, audition, language, reading, and attention are detectable as enhanced FC computed from at rest inter-region oscillatory synchronization determined via functional magnetic resonance imaging (34–42). Network coordination facilitating perceptual processing, including speech comprehension, has been detected as elevated FC (17,20,43–47). To compute FC for this study, BOLD time-course data were first corrected for displacement movement and rotational movement using the SPM algorithm. A spatial Gaussian filter was then applied to the data considered in 3D space with a width of 2 voxels at its half maximum. Voxels with a median value over the time-course that fell below 5% of the maximum were set to zero, and data were low-pass filtered with a cutoff frequency of 0.1 Hz as is the convention for FC analysis (35,40); for functional pathways; inter-region BOLD signal oscillatory synchronization is expressed almost entirely below this frequency cut-off (48).
A bilateral Wernicke’s seed region comprised of sites in left posterior BA22 and a right homologous site in BA21/22 (Figure 1A) was delineated based on an earlier fMRI study showing activation in these sites concurrent with AVH events in a non-overlapping patient group (21). For each subject, this seed region was mapped into the space of the individual subject using an inverse Talairach transform, and its mean time-course for each run was computed as the average of all voxels in the region defined in the subject space. The mean time-course of data within each slice was also determined for each run by averaging the time-course across all nonzero voxels. For each run, the partial correlation between the BOLD signal time-course of each voxel and that of the seed region was found after removing effects of slice mean time-course, thereby filtering out broadly shared, non-specific covariance such as arising from respiration and heart rate (40). These correlations were transformed to a Gaussian distribution via Fisher’s transformation (49):
where r is the partial correlation at each voxel. This transformation produced an approximately Gaussian distribution for each subject, which was adjusted to a standard normal z-distribution using a method previously described (34). For each voxel in each slice, z-values were then averaged across runs to compute FC relative to the seed region.
Figure 1.

(A) Bilateral Wernicke’s seed region based on prior fMRI activation study of AVHs occurrences utilizing a non-overlapping patient sample (21) shown in red. (B) The secondary seed region in the left IFG in maroon showing greater FC relative to the bilateral Wernicke’s seed region when comparing hallucinators with nonhallucinating patients according to an uncorrected p=0.005. Z-values reflect zed stereotaxic level.
Left IFG Regions of Interest (ROIs)
Bilateral Wernicke’s seeded FC was computed with the left IFG subdivided into BA44, BA45, BA46 and BA47 as ROIs delineated using the Talairach atlas (50). Although BA46 is typically viewed as a middle frontal region, its ventral aspect lies in IFG and participates in language processes (51–53) and has been implicated in the genesis of AVHs (26,54). Consequently, this IFG subregion was included in our ROI analysis.
A linear mixed model was employed for the ROI analysis, and included group (healthy controls, hallucinators and nonhallucinating patients) as a between-subjects explanatory factor and left IFG subregion as a within-subjects factor. Subject was used as the clustering factor. Post hoc pairwise group comparisons employed error variance from the overall ANOVA model.
Exploratory, voxel-based analysis of bilateral Wernicke’s seeded FC
An exploratory, voxel-based analysis was undertaken to ascertain other regions hyperconnected to the bilateral Wernicke’s seed region that therefore could contribute to the genesis of AVHs. After false discovery rate (FDR) correction (55) with cut-off set at p=0.05, no region expressed FC differences when comparing hallucinators and nonhallucinating patients. We therefore sought to identify hyperconnected pathways characteristic of schizophrenia overall that could contribute to hallucination vulnerability by linking with other pathways exhibiting relatively greater FC for hallucinators compared to nonhallucinating patients. This possibility was investigated by retaining the same Wernicke’s seed region and pooling the two patient subgroups. A large, bilateral subcortical cluster was detected in the combined patient group relative to healthy controls after FDR correction (Figure 2, and Table S1 in the Supplement). This cluster was divided into three subcortical ROIs. The first two were in the putamen and thalamus, which are involved in initiating and organizing language representations ordinarily (56–58), and have been shown to be activated coincident with AVH occurrences in two reports (26,59). The third region was in the midbrain, and incorporated monoamine neuronal centers implicated in the pathophysiology of schizophrenia (60,61).
Figure 2.
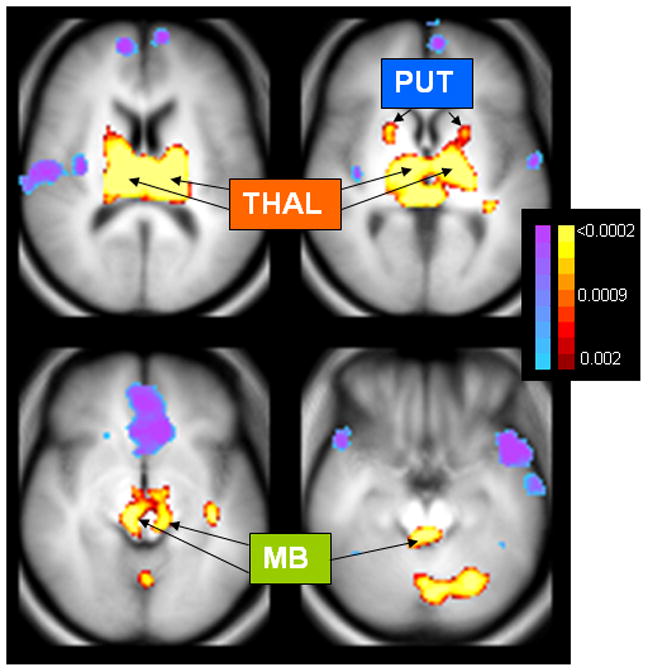
Altered FC relative to the Wernicke’s seed region when comparing data from both patient groups pooled together to healthy controls. MB = midbrain regions appearing to encompass monoamine neuroregulatory centers, including substantia nigra and ventral tegmental area, locus coeruleus and dorsal raphe nuclei; PUT = putamen; THAL = thalamus. Voxels shown are those where FC differences survive false discovery rate (FDR) correction thresholded at p < 0.05, which corresponded to an uncorrected p value of 0.0011 (see color scale right of figures; blue→ purple shows reduced FC, while maroon→yellow shows elevated FC). Table S1 in the Supplement provides detailed information regarding clusters exhibiting FC differences calculated relative to the bilateral Wernicke’s seed region for patients versus healthy controls.
Delineating a cortico-subcortical loop possibly underlying the mechanism of AVHs
To delineate a functional loop possibly underlying AVHs, a second seed region was defined as the left IFG cluster showing greater FC relative to the Wernicke’s seed region comparing hallucinators with non-hallucinating patients at an uncorrected cut-off level of p=0.005 (Figure 1B). FC linking this seed region with each of the three subcortical ROIs was assessed. One of these regions, the putamen, demonstrated elevated IFG-seeded FC in hallucinators comparing to nonhallucinating patients after Bonferroni correction.
This finding prompted a follow-up analysis of FC summed along a loop incorporating the bilateral Wernicke’s seed region, the left IFG seed region, and the putamen (Figure S1 in the Supplement). A univariate linear model was employed with group (healthy controls, hallucinators and nonhallucinating patients) as the between-subjects explanatory factor. This analysis was repeated using button-pressing as a second (binary) fixed factor. Duncan pairwise comparisons were utilized.
It is possible that elevated FC between regions could be due to on/off co-activation accompanying discrete hallucination events rather than a pre-emergent causal factor. Moreover, the act of monitoring one’s own hallucinations and motorically pressing a button could alter FC determination. To assess these possibilities, effects of subject group on corticostriatal loop FC were re-assessed after eliminating hallucinators who signaled hallucinations events during scanning. These were the only hallucinators reporting hallucination frequencies and inter-hallucination intervals in ranges suggesting that coactivation accompanying hallucinations could significantly elevate corresponding FC. In addition, button-press frequency and duration during scanning were utilized as covariates in assessing group effects.
Prior to group comparisons, approximately normal distributions for the FC variables described above were confirmed using normal probability plots and Kolmogorov-Smirnov test statistics. All statistical tests were two-tailed.
Results
Group characteristics are profiled in Table 1. The three groups were well-matched in terms of age, gender and education. Hallucinators and nonhallucinating patients had near identical levels of delusions, disorganization, and composite positive symptoms, while differing at a trend level (p =0.09) for composite negative symptoms.
Table 1.
Demographic, psychopathological, and scanning characteristics of the two patient subgroups and healthy controls
| Variable | Hallucinating patients (N=32) | Nonhallucinating patients (N=24) | Healthy controls (N=23) | Statistical tests1 |
|---|---|---|---|---|
| Demographic | ||||
| Gender (M/F) | 18/14 | 13/11 | 13/10 | χ2 (2) = .03 (.98) |
| Race/ethnicity (Non-HisW/Af-Am/Other) | 27/5/0 | 21/2/1 | 16/6/1 | χ2 (6) = 7.5 (.27) |
| Age (yr)2 | 37.2 (8.8) | 41.1 (10.7) | 35.9 (9.7) | F(2,76)= 1.9 (.16) |
| Education (grades completed)2 | 13.8 (2.3) | 13.8 (2.0) | 14.1 (2.0) | F(2,76)= 0.2 (.80) |
| Clinical, behavioral and data acquisition characteristics | ||||
| Diagnosis (PS/SA-D/SA-B/UN)3 | 14/13/3/2 | 4/14/3/3 | * | χ2 (3) = 4.7 (.19) |
| No. of hospitalizations2 | 8.6 (9.0) | 8.6 (6.9) | * | t(54)= .01 (1.0) |
| PANSS Composite Positive Symptoms2 | 16.5 (4.9) | 16.6 (4.9) | * | t(54)= .07 (.94) |
| PANSS Delusion2 | 2.9 (1.6) | 3.3 (1.8) | * | t(54) = .77 (.44) |
| PANSS Disorganization2 | 1.5 (0.8) | 1.7 (1.2) | * | t(54) =.51 (.61) |
| PANSS Suspiciousness/persecution2 | 2.7 (1.3) | 3.3 (1.5) | * | t(54) =1.4 (.16) |
| PANSS Composite Negative Symptoms2 | 13.7 (5.0) | 16.1 (5.6) | * | t(54)= 1.7 (.09) |
| PANSS Composite General Psychopathology Symptoms2 | 33.0 (9.2) | 34.8 (8.6) | * | t(54)= .8 (.75) |
| Antipsychotic medication type (A/T/T+A/ND)4 | 20/3/7/2 | 17/4/2/1 | * | χ2(6)=2.4 (.49) |
| Chlorpromazine equivalent2 | 634 (457) | 474 (377) | * | t(54) = 1.4 (.17) |
| WAIS vocabulary scaled score2 | 10.8 (3.5) | 12.2 (2.9) | 12.0 (3.0) | F(2,76)= 1.5 (.23) |
| Edinburgh Handedness Inventory Score2,5 | 73.3 (21.5) | 63.5 (19.6) | 75.7 (19.5) | F(2,73) = 2.4 (.10) |
| Subjects depressing button during scanning (yes/no)6 | 11/21 | 9/15 | 11/12 | χ2(2)=1.1 (.59) |
| Number of scan runs (6/> 6)7 | 28/4 | 23/1 | 21/2 | χ2(2)=1.2 (.55) |
degrees of freedom and p-values in parentheses
data presented as mean (standard deviation)
PS=paranoid schizophrenia; SA-D=schizoaffective disorder, depressed; SA-B=schizoaffective disorder, bipolar; UN=undifferentiated schizophrenia
A=atypical; T=typical; T+A=typical plus atypical; ND=no drug
scale from Oldfield (71); data from three subjects not available (2 hallucinators and 1 nonhallucinating patient)
for subjects depressing button during runs, group comparison of rate of button depressions not significant different (F(2,28)=2.1, p=0.13)
One hallucinator had 7 runs, two hallucinators had 8 runs, and one hallucinator had 9 runs to collect additional hallucination event data for our parallel activation time-course analysis (ref 27); 1 nonhallucinating patient had 7 runs and 2 healthy control subjects had 7 runs in order to match frequency and duration of button presses in the hallucinator group.
Bilateral Wernicke’s FC with the left IFG ROIs
Wernicke’s-seeded FC with the four left IFG ROIs averaged within the three subject groups is shown in Figure 3. These data yielded a main effect for group (F(2,76) = 5.04, p = .009) and subregion (F(3,76)=15.08, p <.0001) with a significant group x subregion interaction (F(6,76)=2.87, p =.014). Both hallucinators and healthy controls demonstrated greater Wernicke’s-seeded FC with left BA45 and BA46 compared to nonhallucinating patients, but were not significantly different from each other (Table 2). Healthy controls demonstrated greater Wernicke’s FC with left BA47 compared to both patient groups, who were not different from each other for this measure (Table 2). To control for possible effects of cognitive monitoring and negative symptoms, an analysis of covariance (ANCOVA) was computed after eliminating hallucinators who signaled AVHs during scanning and including negative symptoms as a covariate. Significantly greater Wernicke’s-seeded FC for remaining hallucinators compared to nonhallucinating patients was confirmed (for FC with left BA45, F(2,53)=4.4, p=.018; for FC with left BA46, F(2,53)=7.6, p=.001).
Figure 3.

FC data for each of the ROIs in the left IFG. Data are FC z-scores averaged across all voxels in the ROI. Voxel-specific z-scores are FC values scaled against normalized distributions of FC values for all voxels assessed across the brain of each subject. Consequently a negative z-score for a given subject and voxel does not imply a negative inter-region BOLD correlation, but only that the FC value for that voxel and subject fell below the mean of FC’s assessed across all voxels in that subject’s brain. Error bars=standard error.
Table 2.
Pairwise group comparisons of bilateral Wernicke’s FC with subregions of the left IFG
| Comparison | F value (df =1,76) | P-value | Direction of difference1 |
|---|---|---|---|
| Controls vs. Hallucinators averaged over left IFG | 2.31 | .13 | * |
| Controls vs. Nonhallucinators averaged over left IFG | 10.0 | .002 | HC > NH |
| Hallucinators vs. Nonhallucinators averaged over left IFG | 3.55 | .06 | HAL > NH |
| Controls vs. Hallucinators in BA44 of left IFG | 0.15 | .69 | * |
| Controls vs. Nonhallucinators in BA44 of left IFG | 0.35 | .55 | * |
| Hallucinators vs Nonhallucinators in BA44 of left IFG | 0.06 | 0.81 | * |
| Controls vs. Hallucinators in BA45 of left IFG | 0.44 | 0.51 | * |
| Control vs. Nonhallucinators in BA45 of left IFG | 7.02 | 0.01 | HC > NH |
| Hallucinators vs. Nonhallucinators in BA45 of left IFG | 4.82 | 0.03 | HAL > NH |
| Controls vs. Hallucinators in BA46 of left IFG | 0 | 0.98 | * |
| Controls vs. Nonhallucinators in BA46 of left IFG | 9.68 | 0.003 | HC > NH |
| Hallucinators vs. Nonhallucinators in BA46 of left IFG | 11.1 | 0.001 | HAL > NH |
| Control vs. Hallucinators in BA47 of left IFG | 7.13 | 0.009 | HC > HAL |
| Control vs. Nonhallucinators in BA47 of left IFG | 4.18 | 0.04 | HC > NH |
| Hallucinators vs. Nonhallucinators in BA47 of left IFG | .24 | .63 | * |
HC=Healthy controls, HAL = hallucinating patients, NH=nonhallucinating patients
Follow-up analysis of a corticostriatal loop
An exploratory, voxel-based analysis did not reveal any differences in Wernicke’s-seeded FC comparing hallucinating and nonhallucinating patients after FDR correction. However, a voxel-based analysis revealed a large cluster of subcortical voxels exhibiting excessive FC relative to the Wernicke’s seed region when comparing the combined patient group to healthy controls following FDR correction. This cluster incorporated major components of the thalamus, midbrain and putamen bilaterally; diverse cortical regions, moreover, exhibited reduced FC (Figure 2; and Table S1 in the Supplement). FC relative to a left IFG seed region (see methods for definition) was then computed for these three subcortical regions. One of these regions, the putamen, demonstrated excessive IFG-seeded FC when hallucinators were contrasted with non-hallucinating patients (t(52) = 2.7, p=.009 × 3 = .027 after Bonferroni correction).
IFG-seeded FC with the putamen, Wernicke’s-seeded FC with the putamen, and Wernicke’s-seeded FC with the IFG seed region were summed together to trace a corticostriatal loop (Figure S1 in the Supplement). This composite FC measure demonstrated a significant group effect (F(2,76)=9.84, p= 0.0002), with hallucinators greater than nonhallucinating patients and healthy controls, who were not different from each (Duncan pairwise comparisons with α=0.05; Figure 4). Using a corticostriatal FC cut-off score of 0.5, sensitivity in classifying patients correctly as hallucinators was 0.78, while specificity was 0.67 relative to nonhallucinating patients and 0.65 relative to healthy controls.
Figure 4.
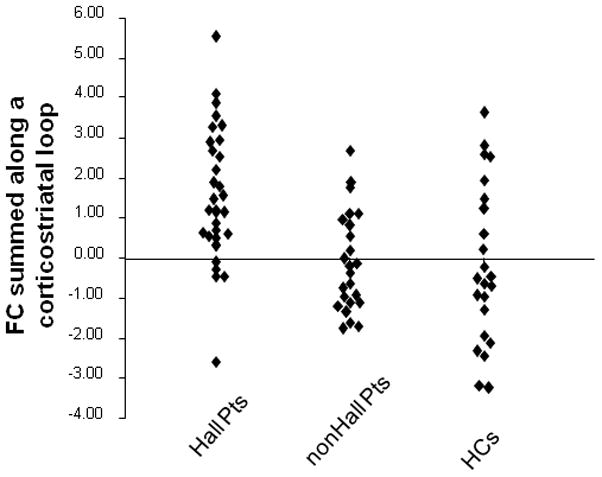
Scatterplots of FC summed along the corticostriatal loop defined according to Figure S1 section (see Supplement) comparing hallucinating patients, nonhallucinating patients and healthy controls. Y-axis reflects summed FC scaled as z-scores. An analysis of variance followed by Duncan pairwise comparisons with cut-off of p=0.05 demonstrated that hallucinators had significantly greater corticostriatal FC compared to both nonhallucinating patients and healthy controls.
Since the putamen is also involved in initiating hand movement (62), a pairwise comparison of the two patient groups was conducted using an ANCOVA with frequency and duration of button-pressing during scanning plus negative symptoms considered as covariates. Corticostriatal FC for hallucinators remained robustly greater than for nonhallucinating patients after these adjustments (F(1,51)=18.9, p=0.00007). An ANCOVA comparing hallucinators and healthy controls controlling for button-press frequency and duration revealed a parallel group difference (F(1,51)=12.9, p=0.001).
As discussed in the methods section, elevated FC between regions could arise from on/off co-activation accompanying discrete hallucination events rather than a pre-emergent causal factor. Moreover, the act of monitoring one’s own hallucinations and motoring pressing a button could alter FC determination. To assess these possibilities, effects of group on corticostriatal loop FC were re-assessed after eliminating hallucinators who signaled hallucinations events during scanning. These were the only hallucinators reporting hallucination frequencies and inter-hallucination intervals in ranges whereby accompanying coactivation could significantly elevate corresponding FC. A significant group effect was again detected (F(2,65) = 7.54, p = 0.001), with remaining hallucinating patients demonstrating statistically greater corticostriatal FC compared to both nonhallucinating patients and healthy controls, who were not significantly different from each other (pairwise Duncan post hoc tests with α=0.05).
To further gauge effects of button-pressing on corticostriatal FC, an analysis of variance was computed after adding button-pressing during fMRI as a second categorical fixed effect. A similar group effect remained (F(2,73) = 9.9, p = 0.0002, with hallucinating patients significantly greater than nonhallucinating patients and healthy controls (pairwise Duncan post hoc tests with α=0.05). There was no main effect of button-pressing (F(1,73)=2.61, p=0.11), but trend-level evidence of a group × button-pressing interaction (F(2,73)=2.55, p=0.085).
The correlation between corticostriatal FC and frequency of hallucination events among patients who signaled these events during scanning was found to be positive although not significant due to small sample size (N=11, Spearman rho=0.50, p=0.11).
Pooling data from the two patient groups, correlations between corticostriatal FC and antipsychotic drug dose (tallied as chlorpromazine equivalents) was found to be nonsignificant (R=0.08). To determine if chronicity of illness contributed to findings, correlation between network FC and number of hospitalizations was computed and found to be nonsignificant (R= −0.21).
Discussion
Although Wernicke’s seeded FC with some subregions of left IFG was, as predicted, greater in hallucinators compared to nonhallucinating patients, we failed to detect a parallel group difference when hallucinators were compared to healthy controls, suggesting the need for a more complex mechanistic model. This prompted a voxel-based analysis to search for other sources of hyperconnectivity anchored to the same seed region that may contribute to the genesis of AVHs. After FDR correction, this analysis revealed supranormal FC in a large, subcortical domain for the combined group of hallucinating and nonhallucinating patients. Within that subcortical domain, the putamen exhibited greater FC relative to a secondary left IFG seed region when contrasting hallucinating patients with nonhallucinating patients. FC summed along a loop linking this striatal site, the IFG seed region, and the original Wernicke’s seed region was robustly elevated for hallucinators compared to both nonhallucinating patients and healthy controls, suggesting that this combined FC measure is an indicator of AVH vulnerability.
A primate study has demonstrated widespread anatomic connectivity linking the putamen and temporal cortices (63). Insofar as the putamen plays a critical role in initiating language representations (58), excessive functional coordination linking this region with the bilateral Wernicke’s seed region in patients with schizophrenia overall may produce an overabundance of language representations that can become hallucinogenic. Our findings suggest that AVHs are blocked in a patient subgroup, however, by partial disconnection of frontotemporal and frontostriatal pathways that ordinarily underlie speech generation, imagery and perception (22–25,56,58). It is generally assumed that disconnection leads to greater disturbance. However, our data support a more complex view whereby hyperconnectivity intrinsic to one component in a functional loop may be counterbalanced by hypoconnectivity in other components of that loop.
Relevant to this model is a study of spontaneous fluctuations of resting fMRI activity comparing treatment-naïve patients with schizophrenia and healthy control subjects. Greater regional fluctuations in the patient group were detected only in the bilateral putamen (64). Functional lability in the former could therefore induce higher functional coordination with these temporal regions. A physical analogy is shaking a tree branch – more vigorous rhythmic shaking will elicit oscillatory movement correlations in other tree branches physically connected to the source branch; these correlations will be reduced or absent with less vigorous shaking.
Three other studies have recently reported cortical fMRI FC data to investigate brain mechanisms leading to AVHs.
Vercammen et al (65) utilized resting FC relative to a bilateral seed region located at the temporoparietal junction to compare patients with active AVHs and healthy controls. A nonhallucinating patient comparison group was not studied. Their patients demonstrated subnormal temporoparietal FC linking to the right IFG. Within the patient group, severity of AVHs was correlated with the degree of reduction of temporoparietal FC to the anterior cingulate cortex. Relevant to the Vercammen et al. findings, we also detected reduced FC between our seed region and the anterior cingulate in patients compared to controls (Figure 2); however, this finding was not specific to hallucinators.
Gavrilescu et al. (66) examined cross-hemisphere resting FC linking the primary and secondary auditory cortices and reported reductions in hallucinating patients when compared with nonhallucinating patients and healthy controls. We consequently computed cross-hemisphere FC linking left and right components of our more posterior Wernicke’s seed region. Cross-hemisphere FC linking these two locations was significantly greater for healthy controls compared to nonhallucinating patients, with hallucinators intermediate and not significantly different than either group.
Raij et al. reported that subjective ratings of the reality of AVHs were positively correlated with enhanced coupling linking left IFG to bilateral auditory cortices and posterior temporal lobes elicited by AVHs (67). Although their findings implicated circuitry similar with ours, our study attempted to characterize FC elevations as predisposing factors leading to AVHs rather than arising from hallucination events themselves. However, it is plausible that hyperconnectivity within this circuitry both predisposes subjects to hallucinations and increases during hallucination events in a manner related to hallucination salience.
Also relevant to our mechanistic model is the efference copy model of AVHs (3–7). Heightened functional coordination across a corticostriatal loop in hallucinators that incorporates posterior temporal regions could render these regions less responsive to suppressive efferent copy projections during internally-generated language, thereby amplifying sensory attributes.
Our methods have noteworthy limitations.
First, intensive learning can enhance inter-region FC (68). Therefore, we cannot rule out the possibility that elevated corticostriatal FC in hallucinators, at least in part, is secondary to repeated experience of AVHs over months to years, rather than a causal factor.
Second, our method for computing FC does not specify whether lower FC values are due to absent positive BOLD correlations versus greater BOLD anti-correlation, which may have different physiological origins. However, it should be stressed that we not claiming one versus the other physiological mechanism to account for the group differences detected in this study, but only that group differences exist.
Third, the partial overlap of corticostriatal FC between groups suggests that other factors not identified in this study contribute to the genesis of AVHs. It is also worth noting that the localization of normal language processes in cortical areas is quite divergent across subjects (69). Therefore the Wernicke’s seed region delineated according to BOLD activation associated with AVHs averaged across a prior subject group is likely to have been suboptimal on a subject-by-subject basis in accessing that subject’s hallucinogenic network. This approach was necessary, however, since most patients do not hallucinate at a frequency range that permits patient-specific delineation of regional fMRI activation coincident with these experiences.
Fourth, a positive albeit non-significant correlation was detected between frequency of hallucinations and corticostriatal FC among the eleven patients who signaled these events motorically during scanning. This finding is consistent with the hypothesis that higher corticostriatal FC increases hallucination vulnerability. However, this finding could also reflect the impact of heightened coactivation due to hallucination events themselves that enhances inter-regional correlations. The two hypotheses are not mutually exclusive. Higher levels of functional coordination, if mediated by excitatory inter-region projections, could lead to episodic coactivation that further increases FC.
We addressed this uncertainty by repeating group comparisons after eliminating from the analysis those patients who signaled AVH events with button-presses. These were the patients whose hallucination frequency and inter-hallucination intervals were in ranges where waxing/waning neural co-activation due to hallucinations could possibly increase inter-region correlations of BOLD signal -- and corresponding FC (see methods). Remaining hallucinators still demonstrated significantly greater corticostriatal FC compared to the other two groups. Most importantly, mean corticostriatal FC for high-frequency, button-pressing hallucinators was virtually identical compared with remaining hallucinators. These findings, considered together, suggest that elevated corticostriatal FC in hallucinators reflects primarily a factor associated with hallucination vulnerability rather than a downstream consequence of hallucination events. It is possible, however, that some patients with low-frequency hallucinations outside the scanner may have experienced higher hallucination rates during scanning, although debriefing after scanning did not suggest that this was the case. This possibility cannot be ruled out since many hallucinating patients were not instructed to signal hallucinations with button-presses during scanning. To do so could have introduced a bias unique to that group since there is no comparable internal monitoring condition for nonhallucinating subjects. Therefore conclusions based on the equivalence of FC observed for the button-pressing vs. non-button-pressing hallucinators must remain tentative.
Further study of the role of elevated corticostriatal FC in the genesis of AVHs is indicated. One approach would be to target the bilateral Wernicke’s seed area with suppressive, low frequency rTMS (70) in hallucinators. One could then ascertain if degree of subsequent improvement in hallucination severity was better predicted by rTMS-induced curtailment of FC within components of the functional loop shown in Figure S1 (see Supplement) versus curtailment of activation variability in the targeted cortical areas.
Supplementary Material
Acknowledgments
This work was supported by National Institute of Mental Health Grant R01MH067073, a Dana Foundation grant, a National Alliance for Research on Schizophrenia and Depression Independent Investigator Award, Peterson 50th Anniversary Research Partner, and the Department of Mental Health and Addiction Services of the State of Connecticut through its support of the Abraham Ribicoff Research Center at the Connecticut Mental Health Center.
Footnotes
FINANCIAL DISCLOSURES
All authors report no biomedical financial interests or potential conflicts of interest.
Publisher's Disclaimer: This is a PDF file of an unedited manuscript that has been accepted for publication. As a service to our customers we are providing this early version of the manuscript. The manuscript will undergo copyediting, typesetting, and review of the resulting proof before it is published in its final citable form. Please note that during the production process errors may be discovered which could affect the content, and all legal disclaimers that apply to the journal pertain.
References
- 1.Sartorious N, Shapiro R, Jablonsky A. The international pilot study of schizophrenia. Schizophr Bull. 1974;1:21–35. doi: 10.1093/schbul/1.11.21. [DOI] [PubMed] [Google Scholar]
- 2.Andreasen NC, Flaum M. Schizophrenia: The characteristic symptoms. Schizophr Bull. 1991;17:27–50. doi: 10.1093/schbul/17.1.27. [DOI] [PubMed] [Google Scholar]
- 3.Feinberg I. Efference copy and corollary discharge: Implications for thinking and its disorders. Schizophr Bull. 1978;4:636–640. doi: 10.1093/schbul/4.4.636. [DOI] [PubMed] [Google Scholar]
- 4.Frith CD, Done CJ. Toward a neuropsychology of schizophrenia. Br J Psychiatry. 1988;153:437–443. doi: 10.1192/bjp.153.4.437. [DOI] [PubMed] [Google Scholar]
- 5.Shergill SS, Brammer MJ, Fukuda R, Williams SCR, Murray RM, et al. Engagement of brain areas implicated in processing inner speech in people with auditory hallucinations. Br J Psychiatry. 2003;182:525–531. doi: 10.1192/bjp.182.6.525. [DOI] [PubMed] [Google Scholar]
- 6.Heinks-Maldonado TH, Mathalon DH, Houde JF, Gray M, Faustman WO, et al. Relationship of imprecise corollary discharge in schizophrenia to auditory hallucinations. Arch Gen Psychiatry. 2007;64:286–96. doi: 10.1001/archpsyc.64.3.286. [DOI] [PubMed] [Google Scholar]
- 7.Ford JM, Roach BJ, Faustman WO, Mathalon DH. Synch before you speak: auditory hallucinations in schizophrenia. Am J Psychiatry. 2007;164:458–66. doi: 10.1176/ajp.2007.164.3.458. [DOI] [PubMed] [Google Scholar]
- 8.Karlsgodt KH, van Erp TG, Poldrack RA, Bearden CE, Nuechterlein KH, et al. Diffusion tensor imaging of the superior longitudinal fasciculus and working memory in recent-onset schizophrenia. Biol Psychiatry. 2008;63:512–518. doi: 10.1016/j.biopsych.2007.06.017. [DOI] [PubMed] [Google Scholar]
- 9.Hoffman RE, Varanko M, Gilmore J, Mishara AL. Experiential features used by patients with schizophrenia to differentiate voices from ordinary verbal thought. Psychol Med. 2008;38:1167–76. doi: 10.1017/S0033291707002395. [DOI] [PubMed] [Google Scholar]
- 10.Cosmelli D, David O, Lachaux JP, Martinerie J, Garnero L, Renault B, et al. Waves of consciousness: ongoing cortical patterns during binocular rivalry. Neuroimage. 2004;23:128–40. doi: 10.1016/j.neuroimage.2004.05.008. [DOI] [PubMed] [Google Scholar]
- 11.Sergent C, Dehaene S. Neural processes underlying conscious perception: experimental findings and a global neuronal workspace framework. J Physiology Paris. 2004;98:374–84. doi: 10.1016/j.jphysparis.2005.09.006. [DOI] [PubMed] [Google Scholar]
- 12.Melloni L, Molina C, Pena M, Torres D, Singer W, et al. Synchronization of neural activity across cortical areas correlates with conscious perception. J Neurosci. 2007;27:2858–65. doi: 10.1523/JNEUROSCI.4623-06.2007. [DOI] [PMC free article] [PubMed] [Google Scholar]
- 13.John ER. The neurophysics of consciousness. Brain Res - Brain Res Rev. 2002;39:1–28. doi: 10.1016/s0165-0173(02)00142-x. [DOI] [PubMed] [Google Scholar]
- 14.Benson RR, Whalen DH, Richardson M, Swainson B, Clark VP, et al. Parametrically dissociating speech and nonspeech perception in the brain using fMRI. Brain Language. 2001;78:364–396. doi: 10.1006/brln.2001.2484. [DOI] [PubMed] [Google Scholar]
- 15.Lattner S, Meyer ME, Friederici AD. Voice perception: Sex, pitch, and the right hemisphere. Hum Brain Mapp. 2005;24:11–20. doi: 10.1002/hbm.20065. [DOI] [PMC free article] [PubMed] [Google Scholar]
- 16.Mathiak K, Menning H, Hertrich I, Mathiak KA, Zvyagintsev M, Ackermann H. Who is telling what from where? A functional magnetic resonance imaging study. Neuroreport. 2007;18:405–9. doi: 10.1097/WNR.0b013e328013cec4. [DOI] [PubMed] [Google Scholar]
- 17.Obleser J, Wise RJ, Alex Dresner M, Scott SK. Functional integration across brain regions improves speech perception under adverse listening conditions. J Neurosci. 2007;27:2283–9. doi: 10.1523/JNEUROSCI.4663-06.2007. [DOI] [PMC free article] [PubMed] [Google Scholar]
- 18.Tyler LK, Marslen-Wilson W. Fronto-temporal brain systems supporting spoken language comprehension. Phil Trans Royal Soc London - Series B: Biol Sci. 2008;363:1037–1054. doi: 10.1098/rstb.2007.2158. [DOI] [PMC free article] [PubMed] [Google Scholar]
- 19.Peelle JE, Troiani V, Wingfield A, Grossman M. Neural processing during older adults’ comprehension of spoken sentences: age differences in resource allocation and connectivity. Cereb Cortex. 2010;20(4):773–82. doi: 10.1093/cercor/bhp142. [DOI] [PMC free article] [PubMed] [Google Scholar]
- 20.Londei A, D’Ausilio A, Basso D, Sestieri C, Gratta CD, et al. Sensory-motor brain network connectivity for speech comprehension. Hum Brain Mapp. 2010;31:567–80. doi: 10.1002/hbm.20888. [DOI] [PMC free article] [PubMed] [Google Scholar]
- 21.Hoffman RE, Anderson A, Varanko M, Gore J, Hampson M. The time course of regional brain activation associated with onset of auditory/verbal hallucinations. Br J Psychiatry. 2008;193:424–425. doi: 10.1192/bjp.bp.107.040501. [DOI] [PMC free article] [PubMed] [Google Scholar]
- 22.McGuire PK, Silbersweig DA, Murray RM, David AS, Frackowiak RS, et al. Functional anatomy of inner speech and auditory verbal imagery. Psychol Med. 1996;26:9–38. doi: 10.1017/s0033291700033699. [DOI] [PubMed] [Google Scholar]
- 23.Shergill SS, Bullmore ET, Brammer MJ, Williams SCR, Murray RM, et al. A functional study of auditory verbal imagery. Psychol Med. 2001;31:241–253. doi: 10.1017/s003329170100335x. [DOI] [PubMed] [Google Scholar]
- 24.Friederici AD. Toward a neural basis of auditory sentence processing. Tr Cognitive Sci. 2002;6:78–84. doi: 10.1016/s1364-6613(00)01839-8. [DOI] [PubMed] [Google Scholar]
- 25.Peelle JE, McMillan C, Moore P, Grossman M, Wingfield A. Dissociable patterns of brain activity during comprehension of rapid and syntactically complex speech: evidence from fMRI. Brain Language. 2004;91:315–25. doi: 10.1016/j.bandl.2004.05.007. [DOI] [PubMed] [Google Scholar]
- 26.Shergill SS, Brammer MJ, Williams SCR, Murray RM, McGuire PK. Mapping auditory hallucinations in schizophrenia using functional magnetic resonance imaging. Arch Gen Psychiatry. 2000;57:1033–1038. doi: 10.1001/archpsyc.57.11.1033. [DOI] [PubMed] [Google Scholar]
- 27.Hoffman RE, Pittman B, Constable RT, Bhagwagar Z, Hampson M. Time-course of regional hemodynamic activation accompanying auditory/verbal hallucinations in patients with schizophrenia-spectrum disorders. doi: 10.1192/bjp.bp.110.086835. Under review. [DOI] [PMC free article] [PubMed] [Google Scholar]
- 28.First MB, Spitzer RL, Gibbon M, Williams JBW. Structured Clinical Interview for DSM-IV Axis I Disorders – Patient Edition, Version 2.0. Biometrics Research Department, New York Psychiatric Institute; New York: 1995. [Google Scholar]
- 29.First MB, Spitzer RL, Gibbon M, Williams JBW. Structured clinical interview for the DSM-IV-TR Axis I Disorders. Biometrics Research Department, New York Psychiatric Institute; 2002. Non-patient edition (SCD-I/NP) [Google Scholar]
- 30.Davis JM. Dose equivalence of the antipsychotic drugs. J Psychiatric Res. 1974;11:65–69. doi: 10.1016/0022-3956(74)90071-5. [DOI] [PubMed] [Google Scholar]
- 31.Woods SW. Chlorpromazine equivalent dosages for the newer atypical antipsychotics. J Clin Psychiatry. 2003;64:663–667. doi: 10.4088/jcp.v64n0607. [DOI] [PubMed] [Google Scholar]
- 32.Centorrino F, Eakin M, Bahk W-M, Kelleher JP, Goren J, et al. Inpatient antipsychotic drug use in 1998, 1993, and 1989. Am J Psychiatry. 2002;159:1932–1935. doi: 10.1176/appi.ajp.159.11.1932. [DOI] [PubMed] [Google Scholar]
- 33.Kay SR, Fiszbein A, Opler LA. The Positive and Negative Syndrome Scale (PANSS) for schizophrenia. Schizophr Bull. 1987;13:261–276. doi: 10.1093/schbul/13.2.261. [DOI] [PubMed] [Google Scholar]
- 34.Biswal BB, Yetkin FZ, Haughton VM, Hyde JS. Functional connectivity in the motor cortex of resting human brain using echo-planar MRI. Magn Reson Med. 1995;34:537–541. doi: 10.1002/mrm.1910340409. [DOI] [PubMed] [Google Scholar]
- 35.Lowe MJ, Mock BJ, Sorenson JA. Functional connectivity in single and multislice echoplanar imaging using resting-state fluctuations. NeuroImage. 1998;7:119–132. doi: 10.1006/nimg.1997.0315. [DOI] [PubMed] [Google Scholar]
- 36.Xiong J, Parsons LM, Gao JH, Fox PT. Interregional functional connectivity to primary motor cortex revealed using MIR resting state images. Hum Brain Mapp. 1999;8:151–156. doi: 10.1002/(SICI)1097-0193(1999)8:2/3<151::AID-HBM13>3.0.CO;2-5. [DOI] [PMC free article] [PubMed] [Google Scholar]
- 37.Cordes D, Haughton VM, Arfanakis K, Wendt GJ, Turski PA, et al. Mapping functionally related regions of brain with functional connectivity MR imaging. Am J Neuroradiology. 2000;21:1636–44. [PMC free article] [PubMed] [Google Scholar]
- 38.Hampson M, Peterson B, Skudlarski P, Gatenby C, Gore J. Detection of functional connectivity using temporal correlations in MR images. Hum Brain Mapp. 2002;15:247–262. doi: 10.1002/hbm.10022. [DOI] [PMC free article] [PubMed] [Google Scholar]
- 39.Fox MD, Corbetta M, Snyder AZ, Vincent JL, Raichle ME. Spontaneous neuronal activity distinguishes human dorsal and ventral attention systems. Proc Natl Acad Sci USA. 2006;103:10046–10051. doi: 10.1073/pnas.0604187103. [DOI] [PMC free article] [PubMed] [Google Scholar]
- 40.Hampson M, Tokoglu F, Sun Z, Schafer RJ, Skudlarski P, Gore JC, et al. Connectivity-behavior analysis reveals that functional connectivity between left BA39 and Broca’s area varies with reading ability. Neuroimage. 2006;31:513–9. doi: 10.1016/j.neuroimage.2005.12.040. [DOI] [PubMed] [Google Scholar]
- 41.Seeley WW, Menon V, Schatzberg AF, Keller J, Glover GH, Kenna H, et al. Dissociable intrinsic connectivity networks for salience processing and executive control. J Neurosc. 2007;27:2349–56. doi: 10.1523/JNEUROSCI.5587-06.2007. [DOI] [PMC free article] [PubMed] [Google Scholar]
- 42.Shmuel A, Leopold DA. Neuronal correlates of spontaneous fluctuations in fMRI signals in monkey visual cortex: Implications for functional connectivity at rest. Human Brain Mapp. 2008;29:751–61. doi: 10.1002/hbm.20580. [DOI] [PMC free article] [PubMed] [Google Scholar]
- 43.Sergent C, Dehaene S. Neural processes underlying conscious perception: experimental findings and a global neuronal workspace framework. J Physiology Paris. 2004;98:374–84. doi: 10.1016/j.jphysparis.2005.09.006. [DOI] [PubMed] [Google Scholar]
- 44.von Kriegstein K, Giraud AL. Implicit multisensory associations influence voice recognition. Plos Biology. 2006;4:e326. doi: 10.1371/journal.pbio.0040326. [DOI] [PMC free article] [PubMed] [Google Scholar]
- 45.McNamara A, Buccino G, Menz MM, Glascher J, Wolbers T, et al. Neural dynamics of learning sound-action associations. PLoS ONE. 2008;3:e3845. doi: 10.1371/journal.pone.0003845. [DOI] [PMC free article] [PubMed] [Google Scholar]
- 46.Arnal LH, Morillon B, Kell CA, Giraud AL. Dual neural routing of visual facilitation in speech processing. J Neurosci. 2009;29:13445–53. doi: 10.1523/JNEUROSCI.3194-09.2009. [DOI] [PMC free article] [PubMed] [Google Scholar]
- 47.van de Ven V, Esposito F, Christoffels IK. Neural network of speech monitoring overlaps with overt speech production and comprehension networks: a sequential spatial and temporal ICA study. Neuroimage. 2009;47:1982–91. doi: 10.1016/j.neuroimage.2009.05.057. [DOI] [PubMed] [Google Scholar]
- 48.Cordes D, Haughton VM, Arfanakis K, Carew JD, Turski PA, et al. Frequencies contributing to functional connectivity in the cerebral cortex in “resting-state” data. Am J Neuroradiology. 2001;22:1326–1333. [PMC free article] [PubMed] [Google Scholar]
- 49.Hays WL. Statistics. 3. CBS College Publishing; New York, NY: 1981. [Google Scholar]
- 50.Tailarach J, Tournoux P. Co-planar stereotaxic atlas of the human brain. Thieme Medical Publishers; NY: 1988. [Google Scholar]
- 51.Muller RA, Rothermel RD, Behen ME, Muzik O, Mangner TJ, et al. Receptive and expressive language activations for sentences: a PET study. Neuroreport. 1997;8:3767–3770. doi: 10.1097/00001756-199712010-00022. [DOI] [PubMed] [Google Scholar]
- 52.Klein D, Milner B, Zatorre RJ, Meyer E, Evans AC. The neural substrates underlying word generation: a bilingual functional-imaging study. Proc Natl Acad Sci USA. 1995;92:2899–903. doi: 10.1073/pnas.92.7.2899. [DOI] [PMC free article] [PubMed] [Google Scholar]
- 53.Dronkers NF, Wilkins DP, Van Valin RD, Jr, Redfern BB, Jaeger JJ. Lesion analysis of the brain areas involved in language comprehension. Cognition. 2004;92(1–2):145–77. doi: 10.1016/j.cognition.2003.11.002. [DOI] [PubMed] [Google Scholar]
- 54.Lennox BR, Park SBG, Medley I, Morris PG, et al. The functional anatomy of auditory hallucinations in schizophrenia. Psychiatry Res Neuroimaging Sec. 2000;100:13–20. doi: 10.1016/s0925-4927(00)00068-8. [DOI] [PubMed] [Google Scholar]
- 55.Genovese CR, Lazar N, Nichols TE. Thresholding of statistical maps in functional neuroimaging using the false discovery rate. NeuroImage. 2005;15:870–878. doi: 10.1006/nimg.2001.1037. [DOI] [PubMed] [Google Scholar]
- 56.Booth JR, Wood L, Lu D, Houk JC, Bitan T. The role of the basal ganglia and cerebellum in language processing. Brain Res. 2007;1133:136–44. doi: 10.1016/j.brainres.2006.11.074. [DOI] [PMC free article] [PubMed] [Google Scholar]
- 57.Bhatnagar SC, Mandybur GT. Effects of intralaminar thalamic stimulation on language functions. Brain Lang. 2005;92(1):1–11. doi: 10.1016/j.bandl.2004.05.002. [DOI] [PubMed] [Google Scholar]
- 58.Price CJ. The anatomy of language: a review of 100 fMRI studies published in 2009. Ann NY Acad Sci. 2010;1191:62–88. doi: 10.1111/j.1749-6632.2010.05444.x. [DOI] [PubMed] [Google Scholar]
- 59.Silbersweig DA, Stern E, Frith C, Cahill C, Holmes A, et al. A functional neuroanatomy of hallucinations in schizophrenia. Nature. 1995;378:176–179. doi: 10.1038/378176a0. [DOI] [PubMed] [Google Scholar]
- 60.Harrison PJ. The neuropathology of schizophrenia. A critical review of the data and their interpretation. Brain. 1999;122:593–624. doi: 10.1093/brain/122.4.593. [DOI] [PubMed] [Google Scholar]
- 61.Kapur S. Psychosis as a state of aberrant salience: a framework linking biology, phenomenology, and pharmacology in schizophrenia. Am J Psychiatry. 2003;160:13–23. doi: 10.1176/appi.ajp.160.1.13. [DOI] [PubMed] [Google Scholar]
- 62.Toxopeus CM, de Vries PM, de Jong BM, Johnson KA, George MS, et al. Cerebral activation patterns related to initiation and inhibition of hand movement. Neuroreport. 2007;18:1557–60. doi: 10.1097/WNR.0b013e3282efa0a2. [DOI] [PubMed] [Google Scholar]
- 63.Yeterian EH, Pandya DN. Corticostriatal connections of the superior temporal region in rhesus monkeys. J Comp Neurology. 1998;399:384–402. [PubMed] [Google Scholar]
- 64.Huang XQ, Lui S, Deng W, Chan RC, Wu QZ, et al. Localization of cerebral functional deficits in treatment-naive, first-episode schizophrenia using resting-state fMRI. Neuroimage. 2010;49(4):2901–6. doi: 10.1016/j.neuroimage.2009.11.072. [DOI] [PubMed] [Google Scholar]
- 65.Vercammen A, Knegtering H, den Boer JA, Liemburg EJ, Aleman A. Auditory hallucinations in schizophrenia are associated with reduced functional connectivity of the temporo-parietal area. Biol Psychiatry. 2010;67:912–8. doi: 10.1016/j.biopsych.2009.11.017. [DOI] [PubMed] [Google Scholar]
- 66.Gavrilescu M, Rossell S, Stuart GW, Shea TL, Innes-Brown H, et al. Reduced connectivity of the auditory cortex in patients with auditory hallucinations: a resting state functional magnetic resonance imaging study. Psychol Med. doi: 10.1017/S0033291709991632. in press. [DOI] [PubMed] [Google Scholar]
- 67.Raij TT, Valkonen-Korhonen M, Holi M, Therman S, Lehtonen J, et al. Reality of auditory verbal hallucinations. Brain. 2009;132:2994–3001. doi: 10.1093/brain/awp186. [DOI] [PMC free article] [PubMed] [Google Scholar]
- 68.Lewis CM, Baldassarre A, Committeri G, Romani GL, Corbetta M. Learning sculpts the spontaneous activity of the resting human brain. Proc Natl Acad Sci USA. 2009;106:17558–17563. doi: 10.1073/pnas.0902455106. [DOI] [PMC free article] [PubMed] [Google Scholar]
- 69.Ojemann G, Ojemann J, Lettich E, Berger M. Cortical language localization in left, dominant hemisphere. An electrical stimulation mapping investigation in 117 patients. J Neurosurgery. 2008;108:411–21. doi: 10.3171/JNS/2008/108/2/0411. [DOI] [PubMed] [Google Scholar]
- 70.Hoffman RE, Hampson M, Wu K, Anderson A, Gore J, et al. Probing the pathophysiology of auditory hallucinations by combining functional magnetic resonance imaging and transcranial magnetic stimulation. Cerebral Cortex. 2007;17:2733–2743. doi: 10.1093/cercor/bhl183. [DOI] [PMC free article] [PubMed] [Google Scholar]
- 71.Oldfield RC. The assessment and analysis of handedness: the Edinburgh inventory. Neuropsychologia. 1971;9:97–113. doi: 10.1016/0028-3932(71)90067-4. [DOI] [PubMed] [Google Scholar]
Associated Data
This section collects any data citations, data availability statements, or supplementary materials included in this article.