Abstract
Links between frequency tuning and timing were explored in the responses to sound of auditory-nerve fibers. Synthetic transfer functions were constructed by combining filter functions, derived via minimum-phase computations from average frequency-threshold tuning curves of chinchilla auditory-nerve fibers with high spontaneous activity (A. N. Temchin et al., J. Neurophysiol. 100: 2889–2898, 2008), and signal-front delays specified by the latencies of basilar-membrane and auditory-nerve fiber responses to intense clicks (A. N. Temchin et al., J. Neurophysiol. 93: 3635–3648, 2005). The transfer functions predict several features of the phase-frequency curves of cochlear responses to tones, including their shape transitions in the regions with characteristic frequencies of 1 kHz and 3–4 kHz (A. N. Temchin and M. A. Ruggero, JARO 11: 297–318, 2010). The transfer functions also predict the shapes of cochlear impulse responses, including the polarities of their frequency sweeps and their transition at characteristic frequencies around 1 kHz. Predictions are especially accurate for characteristic frequencies < 1 kHz.
1. INTRODUCTION
Several magnitude and timing features of the responses of chinchilla auditory-nerve fibers (ANFs) are correlated and undergo transitions in cochlear regions with the same characteristic frequencies (CFs), 1 and 3–4 kHz. At the region with CF of 1 kHz, transitions occur in the direction of the asymmetry of frequency-threshold tuning curves, FTCs (Temchin et al., 2008), the asymmetrical level-dependent shifts of rate-vs.-frequency curves (Temchin and Ruggero, 2010), the curvature of phase-vs.-frequency curves (Temchin and Ruggero, 2010), and the direction of the onset frequency glides in impulse responses (Recio-Spinoso et al., 2005;Temchin et al., 2005). At the cochlear region with CFs of 3–4 kHz, transitions occur for the shapes of FTCs, including the slopes of their lower limbs and the associated tip-to-tail ratios, and of phase-frequency curves (Temchin et al., 2008). The present investigation explores whether linear transfer functions derived from ANF FTCs can predict the timing features of cochlear responses, phase-frequency curves and impulse-response frequency glides, and their variation with CF.
Among linear systems sharing the same magnitude-frequency spectra, minimum-phase systems exhibit the shortest delays, which are determined by, and can be computed from, the magnitude-frequency spectra [(Bode, 1945); pp. 204–212 of (Papoulis, 1962);(Goldstein et al., 1971)]. Other linear systems consist of combinations of a minimum-phase, or filter, components and an all-pass components, such as pure (frequency-independent) delays. In general, non-minimum-phase linear systems can be decomposed into minimum-phase and all-pass components [pp. 132–133 of (Papoulis, 1977)]. Temchin et al. (2005) have shown that the near-CF group delays of putative basilar-membrane (BM) impulse responses (derived from Wiener kernels of ANF responses to noise) are well described as combinations of frequency-independent delays or latencies and (time-consuming) filters [see Fig. 11 of (Temchin et al., 2005)]. However, it is not clear whether BM responses have the minimum-phase property (de Boer and Nuttall, 1996;de Boer, 1997;Recio-Spinoso et al., 2010).
Here we use minimum-phase computations not to determine whether cochlear responses have the minimum-phase property but solely to derive phase-frequency curves from magnitude-frequency curves in a systematic and consistent manner. Specifically, synthetic transfer functions (STFs) are constructed by combining filter functions, derived via minimum-phase computations from modified average ANF FTCs (Temchin et al., 2008), and signal-front delays, specified by the latencies of BM and ANF responses to intense clicks [from Fig. 13A of (Temchin et al., 2005)]. The STFs predict many features of phase-frequency curves of cochlear responses to tones, including their shape transitions in the regions with characteristic frequencies of 1 kHz and 3–4 kHz, and the phases and group delays (i.e., the negatives of the phase-frequency slopes) at the CF. The STFs also predict the polarities of the frequency sweeps of impulse responses and their transition at CFs around 1 kHz. Preliminary results of this research were published in an abstract (Temchin et al., 2009).
2. METHODS
The present study is based on 21 average FTCs of chinchilla ANFs [Fig. 4 of (Temchin et al., 2008)], with CFs covering most of the cochlear spectrum in 1/3 –octave steps, and signal-front delays of BM responses to intense clicks [Fig. 13A of (Temchin et al., 2005)], both directly measured and derived from responses of ANFs. Each average FTC distills the features of the FTCs of many high-spontaneous-rate ANFs. Minimum-phase filters were derived from the average FTCs using the following procedure.
First, the FTC (expressed in decibels re CF thresholds) was modified by extrapolation to − 90 dB and extension with zero-slope plateaus (Fig. 2A). The modified FTC was taken as the real part of a complex magnitude spectrum whose imaginary part was set as the mirror image of the modified FTC. A minimum-phase impulse response was computed from the amplitude spectrum using the rceps(x) function of the Signal Processing Toolbox of MATLAB (which returns a reconstructed minimum-phase version of the real time sequence x). [For the MATLAB connoisseur: the complex magnitude spectrum replaced abs(fft(x)) in the rceps.m code that computes the real cepstrum of x; see also: (Oppenheim and Schafer, 1975) and (IEEE, 1979).] Sampling rate was 200 kHz. Both the complex amplitude spectrum (with resolution of 3.0518 Hz) and the impulse response (with resolution of 5 microseconds) consisted of 65,536 samples.
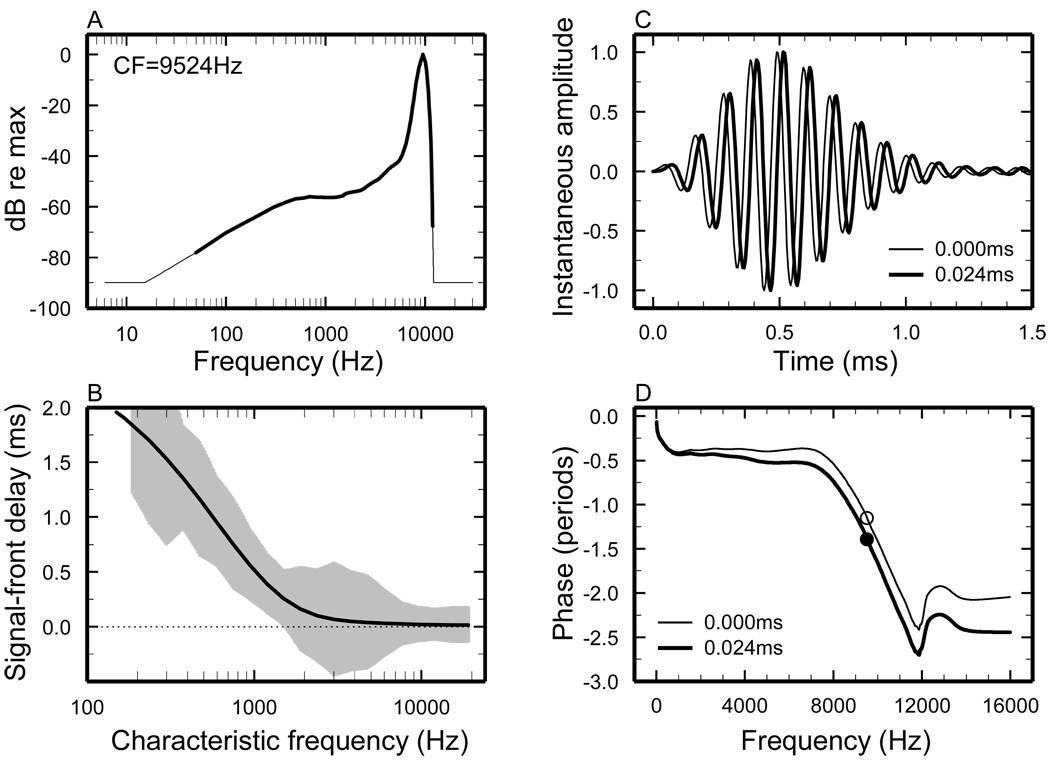
Figure 2. Computation of STFs.
A) Thick trace: average FTC [from Fig. 4 of (Temchin et al., 2008)] plotted relative to threshold at CF. Thin trace: filter function obtained by extrapolation of the synthetic FTC. B) BM signal-front delays plotted against CF. Trace: trend line for BM signal-front delays, directly measured and/or derived from ANF responses to intense clicks [from Fig. 13A of (Temchin et al., 2005)]. Grey area indicates means +/− standard deviations for BM signal-front delays derived from chinchilla ANF responses to clicks [Fig. 10A of (Temchin et al., 2005)]. C) Thin trace: minimum-phase impulse response derived (see text and Methods) from the filter function of panel A. Thick trace: STF impulse response, obtained by delaying the zero-delay minimum-phase impulse response by 24 µs. D) Thin trace: phase-frequency curve of the minimum-phase filter. Thick trace: phase-frequency curve of the STF. Symbols indicate phase at CF.
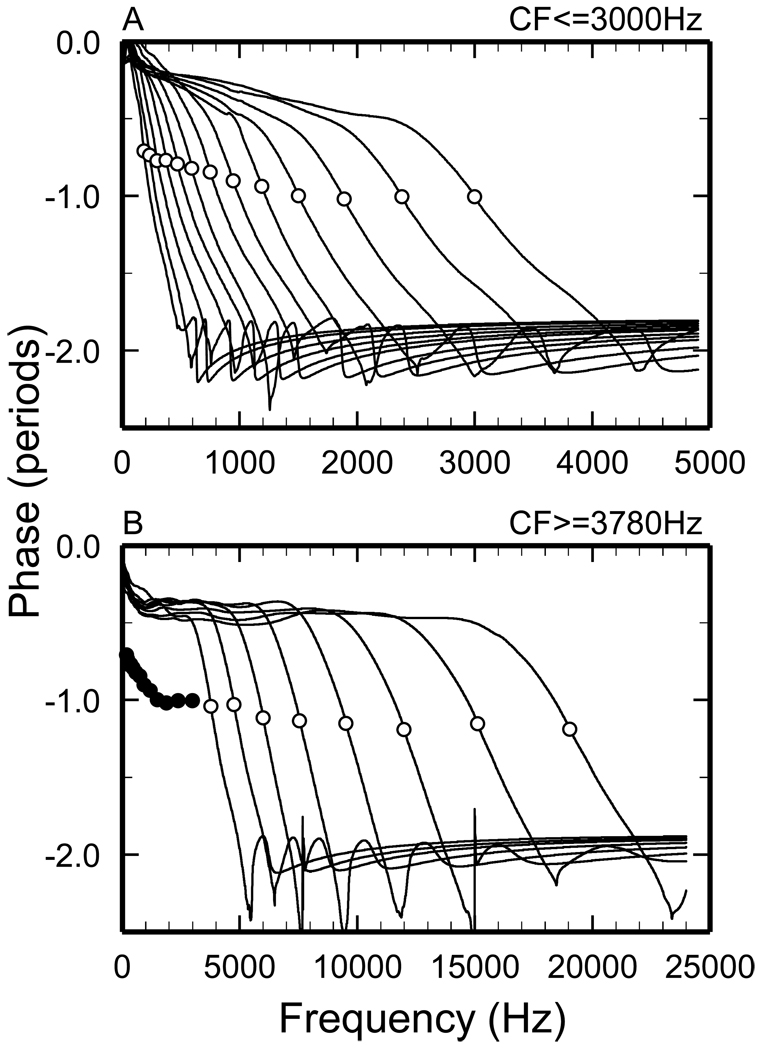
The phase spectra of the minimum-phase impulse responses (e.g., thin trace in Fig. 2D), obtained by Fourier transformation, are shown in Fig. 3. STFs were obtained by cascading the minimum-phase filters with BM pure delays, directly measured and/or derived from the latencies of ANF responses to intense clicks (Temchin et al., 2005). The phase-frequency curves of the STFs for CFs ≤ 3 kHz and ≥ 3.8 kHz are shown in Figs. 4A and 5A, respectively. The instantaneous frequencies (red traces, Fig. 8) and envelopes (blue traces, Fig. 8) of the impulse responses were estimated using the analytic signal representation (Recio et al., 1998). Instantaneous-frequency slopes were computed in the time intervals in which the envelope magnitudes exceeded 10 % of their maxima.
Figure 3. Phase-frequency functions of minimum-phase filters.
A) CFs ≤ 3 kHz. B) CFs ≥ 3.78 kHz. Open symbols indicate phase at CF. Filled symbols in panel B represent the phases at CF for CFs ≤ 3 kHz, reproduced from panel A.
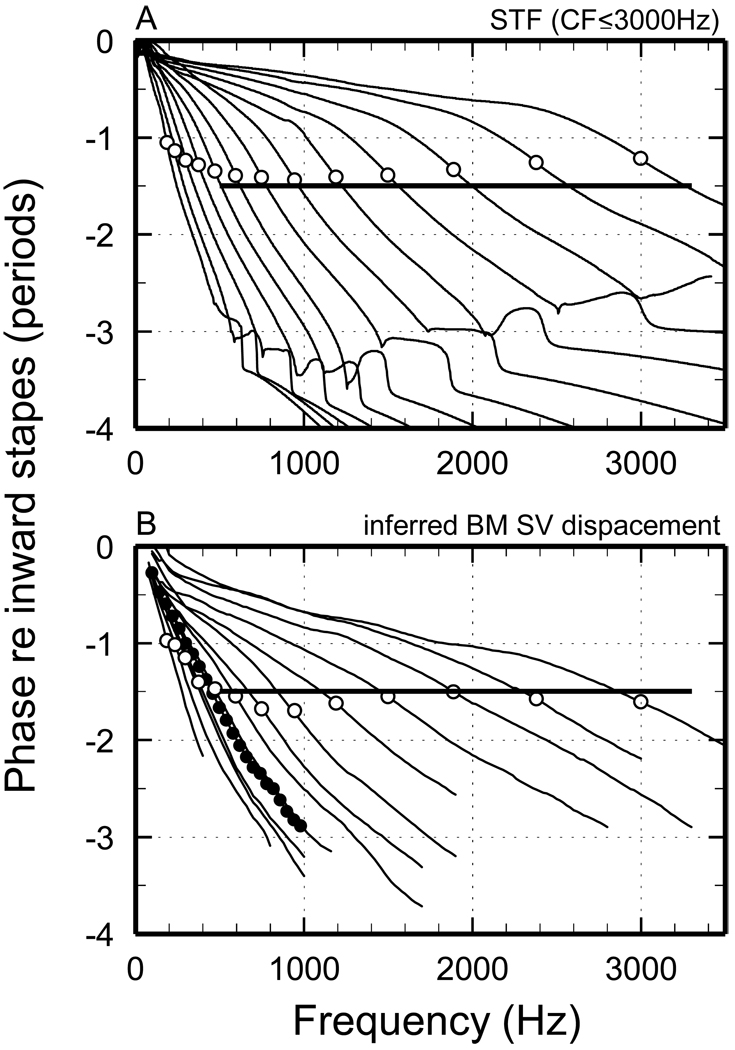
Figure 4. Phase-frequency functions of STFs and of measured cochlear responses for CFs ≤ 3 kHz.
A) Traces: phase-frequency curves of STFs. Symbols: phase at CF. B) Traces: putative BM phase-frequency curves derived from responses to tones of chinchilla ANFs [modified from Fig. 10A of (Temchin and Ruggero, 2010)]. Open symbols: phase at CF. Filled symbols: phases of tectorial-membrane vibrations at an apical site of the chinchilla cochlea [from Fig. 2B of (Rhode and Cooper, 1996).
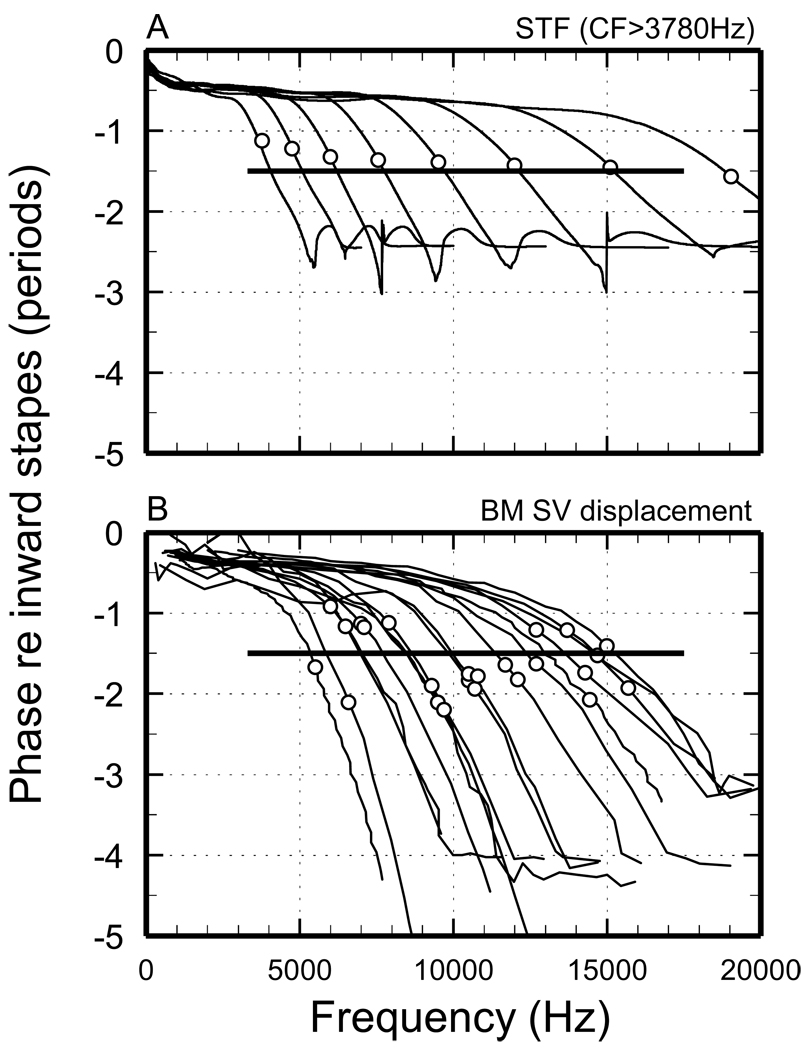
Figure 5. Phase-frequency functions of STFs and of measured cochlear responses for CFs > 3.78 kHz.
A) Traces: phase-frequency curves of STFs. Symbols: phase at CF. B) Phase-frequency curves for BM responses to tones or clicks measured in many chinchilla cochleae [Fig. 5B of (Rhode and Recio, 2000), Fig. 1D of (Rhode, 2007), Fig. 13 of (Ruggero et al., 1997), Fig. 1C of (Ruggero et al., 1997), Fig. 2 of (Narayan and Ruggero, 2000), Fig. 5B of (Rhode and Recio, 2000), Fig. 6A, 6B and 9A of (Recio and Rhode, 2000)]. In some cases CFs are indicated by more than one symbol because different CFs are given in the original publications: 6, 7, 7.9, 10.7, 12.1, 14.3 and 14.7 in (Rhode and Recio, 2000) and 6.1 (or 6.5), 7.1, 9.3, 10.5, 11.7, 12.7 and 13.7 in p. 2286 and Fig. 9A of (Recio and Rhode, 2000).
Figure 8. STF impulse responses.
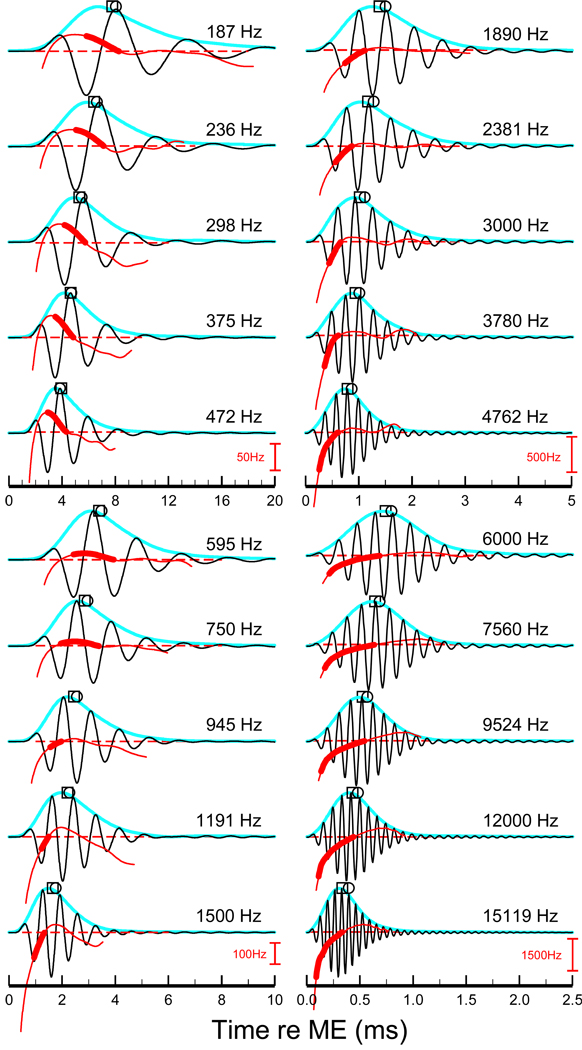
Each STF impulse response was computed as exemplified in Fig. 2. The STF CFs (in 1/3-octaves steps) span most of the length of the chinchilla cochlea. Squares: weighted-average group delays. Circles: near-CF group delays (same as filled symbols in Fig. 6). Blue traces: magnitudes of the STF impulse-response envelopes. Red traces indicate instantaneous frequencies at times corresponding to response envelope magnitudes exceeding 10% of maximum. Thick red trace indicates the segment of the instantaneous-frequency curve between the first trough of the STF and CF. Dashed red lines indicate CF. Frequency scales (red) apply to the 5 traces immediately above it.
3. RESULTS
3.1. On the use of ANF FTCs (iso-response measures) as proxies for BM gain functions (iso-level measures)
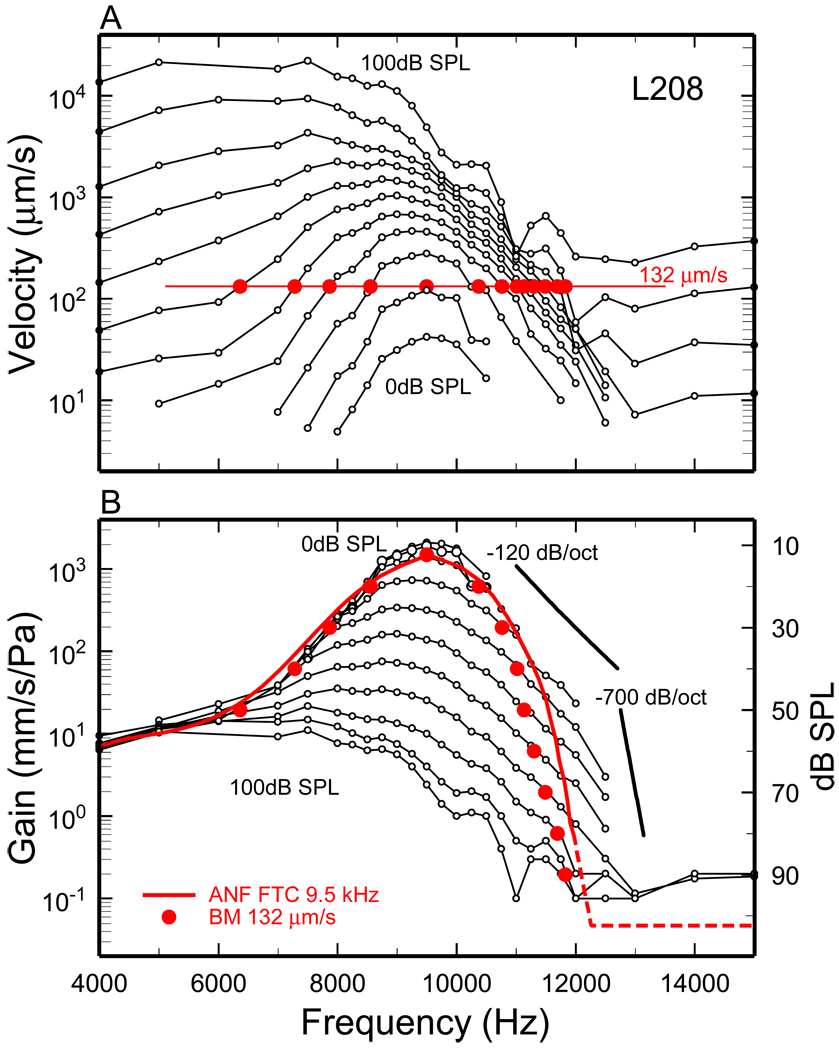
In this paper we attempt to infer the timing features of mechanical responses to tones and clicks in the chinchilla cochlea from average ANF FTCs and the latencies of BM or ANF responses to intense clicks. The underlying assumption is that ANF thresholds are proportional to a constant BM velocity throughout the cochlea, as they are at sites with CFs around 10 kHz (Narayan et al., 1998;Ruggero et al., 2000;Temchin et al., 2008). On first thought, given the nonlinear nature of cochlear responses, it may seem unlikely that ANF FTCs, i.e., iso-response measures, can be used to validly estimate BM gains (velocities normalized to pressure), i.e., iso-level measures. Figure 1 shows that such estimates at a basal site of the cochlea are indeed possible and accurate for threshold stimulus levels and frequencies near and lower than CF. Responses to equal-level tones (connected open symbols) recorded at a BM site with CF = 9.5 kHz are presented as velocity magnitudes in Fig. 1A and as gains, i.e., velocity magnitudes normalized to pressure, in Fig. 1B. The solid red line in Fig. 1B is an average FTC for ANFs with high spontaneous activity (Temchin et al., 2008). For frequencies ≤ CF, the average ANF FTC closely follows the envelope of the BM gain-frequency curves. For higher frequencies, however, the average ANF FTC (with terminal slope of −700 dB/octave) diverges sharply from the BM iso-SPL gain curves (with slopes of about −120 dB/octave). The dashed red line indicates an extrapolation of the FTC and its truncation (at −90 dB re CF threshold). The latter mimics the high-frequency amplitude plateau of BM responses [pp. 1312–1313 of (Robles and Ruggero, 2001)]. A counterpart of the BM amplitude plateau could not be identified in FTCs of chinchilla ANFs (Narayan et al., 1998;Ruggero et al., 2000) but may be present in gerbil ANF FTCs (Huang et al., 2010).
Figure 1. BM velocity gains and tuning curve compared with an average ANF FTC for a site of the chinchilla cochlea with CF of 9.5 kHz.
A) Connected open symbols indicate BM velocities for responses to tones presented at 0–100 dB SPL, in steps of 10 dB. The red flat line indicates a velocity magnitude of 132 µm/s. The red filled symbols indicate stimulus frequency/level combinations that elicit 132 µm/s, the BM velocity at 12.3 dB SPL (the CF threshold of the average FTC for high-spontaneous-rate ANFs with CF = 9.5 kHz). B) Connected open symbols indicate the same BM responses of panel A after normalization to SPL. The red filled symbols indicate a BM tuning curve, plotted relative to level at CF, for a 132-µm/s velocity magnitude. The solid red trace indicates an average FTC (scale to right), for ANFs with high spontaneous activity. BM data from (Ruggero et al., 2000). The dashed red line indicates an extrapolation and truncation of the FTC. ANF data from (Temchin et al., 2008).
3.2. Computation of minimum-phase filters from average ANF FTCs
Each STF combines a minimum-phase filter component and an all-pass component (a signal-front, or pure, delay). Figure 2 illustrates the computation of minimum-phase filters and STFs from average ANF FTCs [illustrated in Fig. 4 of (Temchin et al., 2008)]. The example of Fig. 2 is for an ANF with CF = 9.5 kHz (the same of Fig. 1B). First, the STF magnitude spectrum (thin trace of Fig. 2A) is specified by extrapolation and truncation (at −90 dB re CF threshold) of the FTC (thick trace of Fig. 2A) with magnitudes expressed relative to CF threshold. The magnitude spectrum is used to compute a minimum-phase filter (see Methods). The extrapolations and truncations produce filters whose impulse responses have onsets at time zero (e.g., thin trace in Fig. 2C), regardless of CF. [Plateaus less negative than −90 dB yield responses that start abruptly with non-zero magnitudes (i.e., they are “non-causal”). Plateaus with values more negative than − 90 dB produce finite latencies.] In minimum-phase systems, delays are determined by the variations of magnitude slopes (Bode, 1945). Accordingly, the steepest slope of the phase-frequency curve (thin line in Fig. 2D) occurs at the frequency of the filter peak (the “CF”; Fig. 2A). Similarly, inflections of the phase-frequency curve occur near the frequencies at which inflections exist in the magnitude-frequency curve [i.e., the junction between “tip” and “tail” and the onset of the high-frequency plateau; see Fig. 14 of (Temchin and Ruggero, 2010)]. The minimum-phase plateau is a necessary consequence of the amplitude plateau.
Figure 3 shows phase-frequency functions for minimum-phase filters computed from 21 average FTCs for chinchilla ANFs with high spontaneous activity and CFs (0.19–3 kHz in Fig. 3A, and 3.8–19 kHz in Fig. 3B) spaced in 1/3 octave steps. All phase-frequency curves include a segment around CF, in which the group delay (i.e., the negative of the first derivative of phase with respect to frequency) is greatest, and a high-frequency terminal plateau. Both of these features are expected in minimum-phase sharply-tuned systems: the former reflects changes in FTC slopes, largest at CF, whereas the plateau results from the truncation of the FTC with a high-frequency amplitude plateau. For CFs ≤ 5 kHz, a segment with relatively shallow slope is interposed between the steep segment around CF and the terminal high-frequency plateau. For CFs ≥ 1.5 kHz, the phase-frequency curves include an initial shallow segment which extends to frequencies somewhat lower than CF so that it spans increasingly longer frequency ranges as CF increases. Although the shapes of the phase-frequency undergo systematic changes as a function of increasing CF, the phases at CF are relatively constant for CFs > 1.5 kHz.
The minimum-phase lags of ~ 1 period at CF and of ~2 periods at the phase plateau (Fig. 3) specifically reflect the setting of the high-frequency amplitude plateau at −90 dB re the filter peak. [The setting of the low-frequency amplitude plateau has almost negligible phase effects.] Had the high-frequency amplitude plateaus been set at values more negative than −90 dB, the minimum-phase lags both at CF and at the plateaus would have been greater. For example: setting the high-frequency amplitude plateaus at −120 dB (not shown) increases latencies (from zero for −90 dB plateaus) to 0.072 ms for CF = 9.5 kHz and 0.174 ms for CF = 1 kHz. Such increases in latency are small relative to the CF period, resulting in phase lags at CF that increase by only 0.36 period for CF = 9.5 kHz and 0.17 period for CF = 1 kHz. Even smaller changes in CF phases resulted from large variations (60–1000 dB/octave; not shown) of the slope of the extrapolated high-frequency segment of the STF. In other words, the computation of minimum phases is relatively insensitive to specific settings in the STF magnitudes at frequencies other than those of the FTCs.
3.3. STF predictions of phase-frequency functions of cochlear responses to tones
STFs are generated by combining the minimum-phase filters with pure delays, the onset latencies of BM responses to intense clicks (trace in Fig. 2B). In chinchilla, such delays are known from direct measurements and from estimates based on ANF responses [from Fig. 13A of (Temchin et al., 2005) ]. The thick trace of Fig. 2D illustrates the phase-vs.-frequency function of the STF. The thick trace of Fig. 2C shows the corresponding impulse response (i.e., the Fourier transform of the STF).
Figure 4A presents STF phase-frequency curves (re inward stapes displacement) for CFs 0.19– 3 kHz. Cumulative phase lags at CF (open symbols) are relatively constant, 1.25-1.5 periods, for CFs 0.6–3 kHz and are somewhat smaller for CFs ≤ 600 Hz. For all CFs ≤ 3 kHz, group delays are at least as large near CF than at higher or lower frequencies. For the lowest CFs (≤ 1 kHz), phase-frequency curves have nearly constant group delays up to frequencies somewhat higher than CF; at higher frequencies, group delays are smaller. Thus, phase-frequency curves for CFs ≤ 1 kHz may be described as being “concave upward”. For CFs ≥ 1.5 kHz, the slopes at the lowest frequencies become increasingly shallow as a function of CF. Thus, phase-frequency curves for CFs ≥ 1.5 kHz may be described as being “concave downward”. All of these features of the phase-frequency functions of the minimum-phase filters are qualitatively the same as those of putative BM responses for CFs ≤ 3 kHz. Those phase-frequency curves, shown in Fig. 4B [from Fig. 10A of (Temchin and Ruggero, 2010)], were derived from phase-frequency curves of ANF responses to tones on the assumption that neural and synaptic delays (Ruggero and Rich, 1987) and middle-ear delay (Ruggero et al., 2007) amount to 1.076 ms and that IHC depolarization and ANF excitation at apical sites are synchronous with BM velocity toward scala vestibuli. Figure 4B also shows a phase-frequency curve for tectorial-membrane vibrations at an apical site of the chinchilla cochlea (filled symbols). For comparable CFs, the phase-frequency curves of the STFs (Fig. 4A) are generally similar to those of putative BM responses (either measured at the tectorial-membrane or derived from ANF responses; Fig. 4B). However, the terminal high-frequency slopes of the STFs have no counterparts in the phase-frequency curves of cochlear responses at a low-CF site.
Figure 5A shows phase-frequency curves for STFs with CFs ≥ 3.78 kHz. The phases at CF (symbols) lag middle-ear ossicular vibrations by about 1.1 periods at CF = 3.8 kHz and by amounts that increase slowly for higher CFs, reaching 1.5 periods at 19 kHz. All phase-frequency curves include a low-frequency segment with shallow slope, a segment around CF with steep slope (i.e., large group delay) and a high-frequency plateau. For comparison with the STF phase-frequency curves, Fig. 5B presents phase-frequency curves for BM vibrations measured in the chinchilla cochlea at sites with CFs of 5–15 kHz. The STF phase-frequency curves are similar to the measured BM phase curves in that both are relatively shallow at low frequencies, steep around CF and include high-frequency plateaus. [Although a general feature of BM responses at high-CF sites, high-frequency plateaus are shown in Fig. 5B for only a few sites.] Furthermore, the measured BM curves have CF phases within a locus (−0.9 to −2.2 periods) centered at −1.5 periods re inward stapes displacement (horizontal line), consistent with the CF phases of the STFs with comparable CF (≥ 3.78 kHz). However, the high-frequency plateaus of STF phase-frequency curves occur at substantially smaller lags than in their measured BM counterparts [see Fig. 7 and pp. 1312–1313 of (Robles and Ruggero, 2001)]. This discrepancy is largely due to the unrealistic high-frequency features of high-CF STFs: the STF high-frequency slopes are too steep (−700 dB/octave vs. −120 dB/octave for the BM gain functions) and their high-frequency plateaus start at lower frequencies than in the BM gains functions (Fig. 1B).
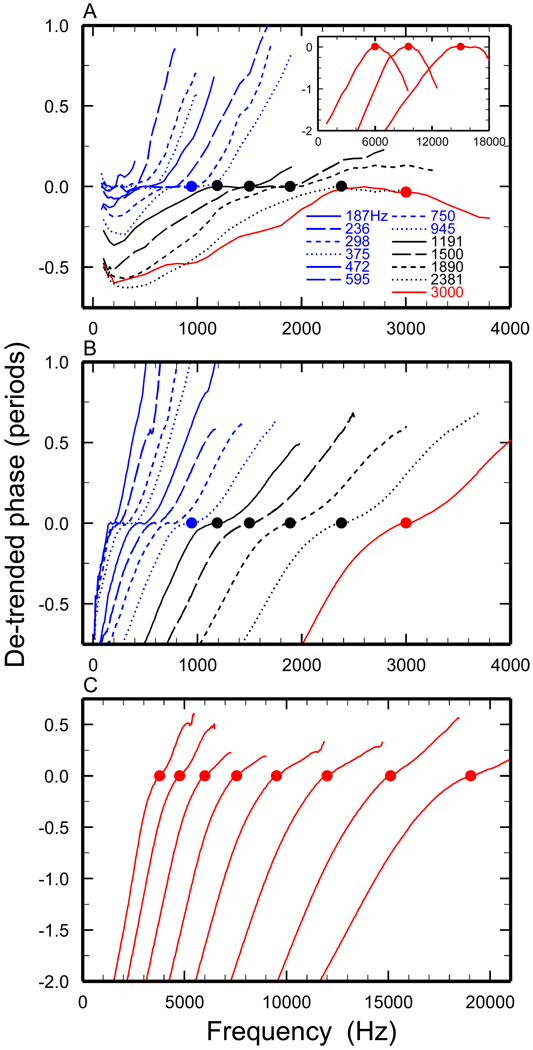
Figure 7. De-trended phase-frequency curves of STFs and cochlear vibrations.
De-trending consisted of rotating the curves counterclockwise in proportion to group delays at CF. A) De-trended phase-frequency curves of putative IHCs, derived from ANF responses [Fig. 11 of (Temchin and Ruggero, 2010)]. Inset: similarly de-trended phase-frequency curves for BM responses at basal sites of the chinchilla cochlea. Symbols mark de-trended phase at CF. BM data from Fig. 1C of (Ruggero et al., 2000), Fig. 5 of (Recio and Rhode, 2000), and Fig. 2 of (Narayan and Ruggero, 2000). B) De-trended phase-frequency curves of STFs for CFs ≤ 3 kHz. Legend in panel A also applies. C) De-trended phase-frequency curves of STFs for CFs ≥ 3.78 kHz.
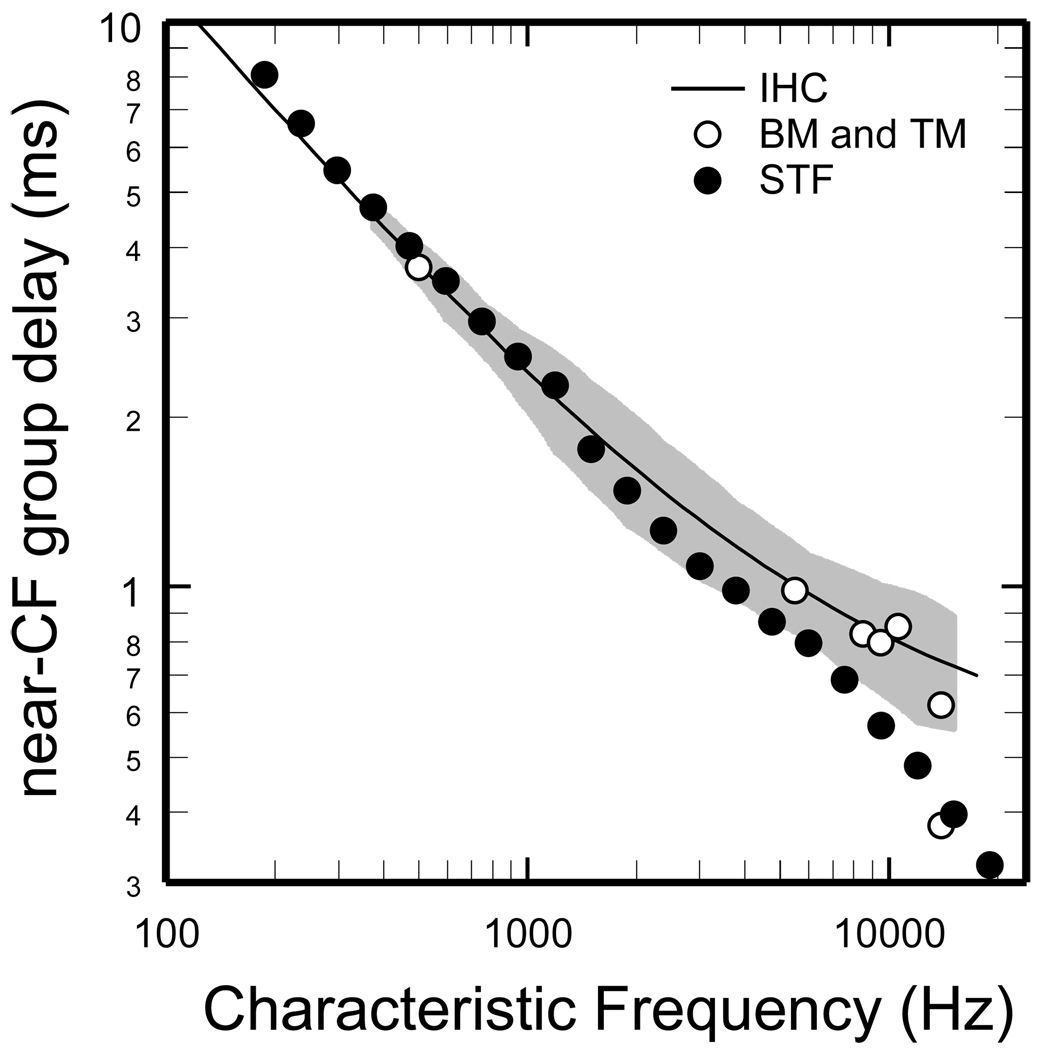
Figure 6 shows the near-CF group delays of the STF phase-frequency curves (filled symbols). For comparison, also shown are near-CF group delays for BM or tectorial-membrane responses at various cochlear sites (open symbols) and for putative IHC responses [trend line; derived from Wiener kernels of ANF responses to near-threshold noise; Fig. 11A of (Temchin et al., 2005)]. The STF delays and the measured delays are nearly identical for CFs < 2 kHz but diverge progressively for higher CFs. For the highest CFs, the differences between the delays of the putative IHC responses and the STFs, although small in absolute values, amount to several CF periods (e.g., 4.5 periods for CFs near 15 kHz).
Figure 6. Near-CF group delays of STFs and of measured cochlear responses.
Filled symbols: near-CF group delays of the STFs. Trace: trend line for near-CF group delays of cochlear vibrations [from Figs.11A and 13B of (Temchin et al., 2005)], measured at the BM or tectorial membrane or derived from Wiener kernels of ANF responses to noise presented at near-threshold levels. Open symbols: near-CF group delays of measured BM or tectorial-membrane responses. Grey area indicates means plus/minus standard deviation of near-CF group delays computed from data of Fig. 10B of (Temchin et al., 2005).
As is evident in Figs. 4B and 5B, cochlear phase-frequency curves generally have their steepest slopes near CF. For CFs < 1.5 kHz (Fig. 4B), slopes are shallower for frequencies > CF than near CF; for CFs > 1.5 kHz (Figs. 4B and 5B), slopes are shallower for frequencies < CF than around CF. Not so well seen in Fig. 5B is that the steepest slopes of high-CF BM phase-frequency curves occur at frequencies somewhat higher than CF [see, for example, Figs. 6D and 9B of (Recio and Rhode, 2000)]. Figure 7 explores the ability of STFs to predict such details of cochlear phase-frequency curves and their variation with CF. In particular, Fig. 7 addresses the question of whether the STFs correctly predict the transition in shape that phase-frequency curves of cochlear responses undergo as a function of CF. To highlight the variations in curvature, Fig. 7 shows STF and experimental phase-frequency curves, which have been de-trended. De-trending consisted of rotating the original curves counterclockwise in proportion to the group delays around CF.
The main part of Fig. 7A shows de-trended phase-frequency curves for putative IHCs [from Fig. 11 of (Temchin and Ruggero, 2010)]. For CFs ≤ 945 Hz (blue traces), the de-trended curves have positive values for frequencies > CF (at which the original phase curves have shallower slopes than at CF or lower frequencies). The de-trended curves undergo a transition at CFs between 945 Hz and 3 kHz (black traces). For CF = 3 kHz (red trace) the maximum occurs near CF and the de-trended phases are negative for frequencies > CF (at which the original phase curves have the steepest slopes). The inset of Fig. 7A shows de-trended phase-frequency curves for BM vibrations at three basal sites in the chinchilla cochlea. The de-trended BM curves resemble the de-trended curve for the putative IHC with CF = 3 kHz, since they also have maxima near CF and negative values for frequencies higher than CF.
Figures 7B and 7C show STF phase-frequency curves that have been de-trended in the same manner as those of Fig. 7A. All the de-trended STF curves (for CFs ≤ 3 kHz in Fig. 7B and ≥ 3.8 kHz in Fig. 7C) grow monotonically beyond CF and, in particular, do not undergo a shape transition comparable to that seen in the IHC curves at CFs around 945 Hz (Fig. 7A). The de-trended STF curves for CFs > 945 Hz lack maxima near CF, contrasting with the maxima evident in the de-trended IHC curves for CFs of 3 kHz (main part of Fig. 7A) and BM curves for CFs > 3 kHz (inset in Fig. 7A). To summarize: the phase-frequency curves of STFs resemble those of cochlear responses for CFs ≤ 945 Hz but differ from those of cochlear responses for higher CFs.
3.4. STF impulse responses
Figure 8 shows STF impulse responses for CFs spanning most of the chinchilla cochlea in 1/3 octave steps (black traces). All impulse responses consist of lightly-damped transient oscillations with periodicity close to CF, with a relatively small first (positive) half cycle and a larger second (negative) half cycle. With increasing CF, damping diminishes systematically so that more cycles of oscillation are contained within the response envelopes (light blue), in accordance with increases in sharpness of tuning of the STFs, and the weighted-average (circles) and near-CF (squares) group delays correspond to more oscillation cycles. All of these features of STF impulse responses are the same as for their measured counterparts [e.g., (Recio et al., 1998;Recio-Spinoso et al., 2005)].
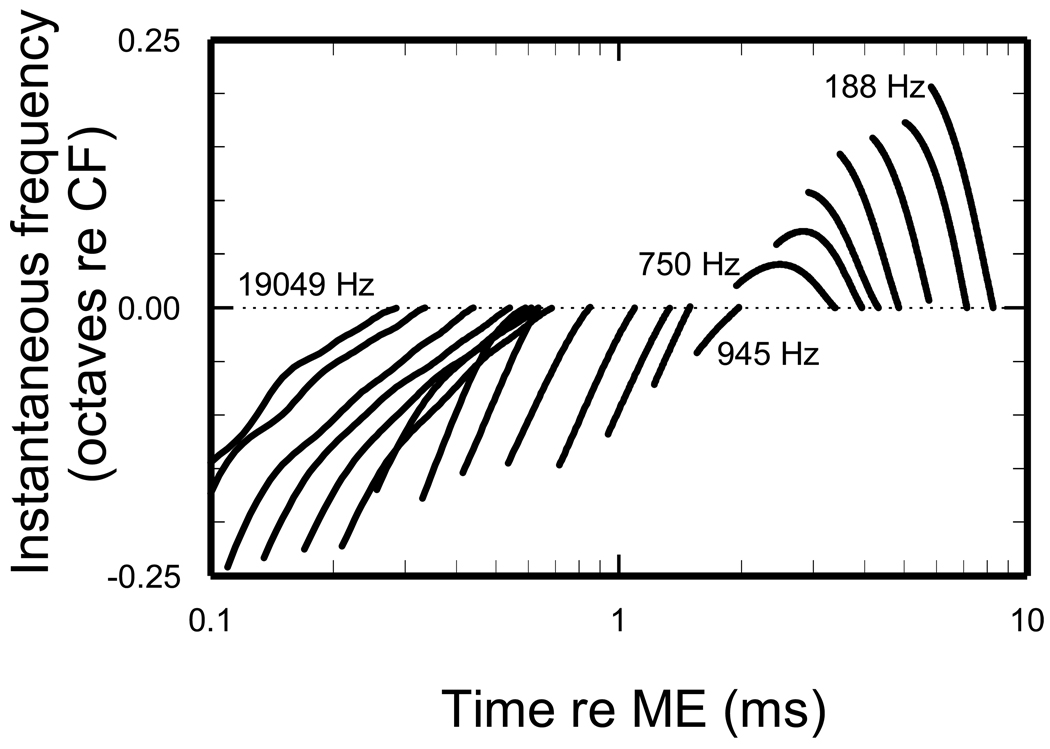
Also shown in Fig. 8 are the instantaneous frequencies of the STF impulse responses (red traces and scales), shown over the spans of time during which the envelopes of the STF impulse responses exceed 10 % of their maxima. All instantaneous-frequency curves of the STF impulse responses initially increase as a function of time. The upward frequency sweep spanning the initial quarter cycle has no counterpart in measured low-CF impulse responses, which start more abruptly than STF impulses [unpublished observations based on Wiener kernels of ANF responses to noise (Recio-Spinoso et al., 2005)]. For CFs ≤ 1.5 kHz, downward frequency sweeps extend through most of the duration of the impulse responses. For CFs 1.9–4.8 kHz, the upward sweeps last through 1–3 cycles of oscillation, whereupon frequency stabilizes around CF. For CFs ≥ 6 kHz, the upward sweep lasts through most of the duration of the impulse response. The thicker traces in Fig. 8 indicate the instantaneous frequencies in the time intervals between the first STF minimum and CF, which correspond to those within which instantaneous-frequency slopes were previously measured in experimental impulse responses in chinchilla [Figs. 17C of (Rsecio-Spinoso et al., 2005) and 14 of (Temchin et al., 2005)]. Figure 9 gathers together the thicker traces of Fig. 8, providing an overview of the CF dependence of the instantaneous frequencies of STF impulse responses: frequencies sweep downward for CFs ≤ 0.75 kHz and upward for higher CFs.
Figure 9. Frequency glides of STF impulse responses.
Thick trace indicates the segment of the instantaneous-frequency curve between the first trough of the STF impulse response and CF (i.e., thick red traces in Fig. 8), plotted as functions of time for CFs spaced at 1/3-octave intervals.
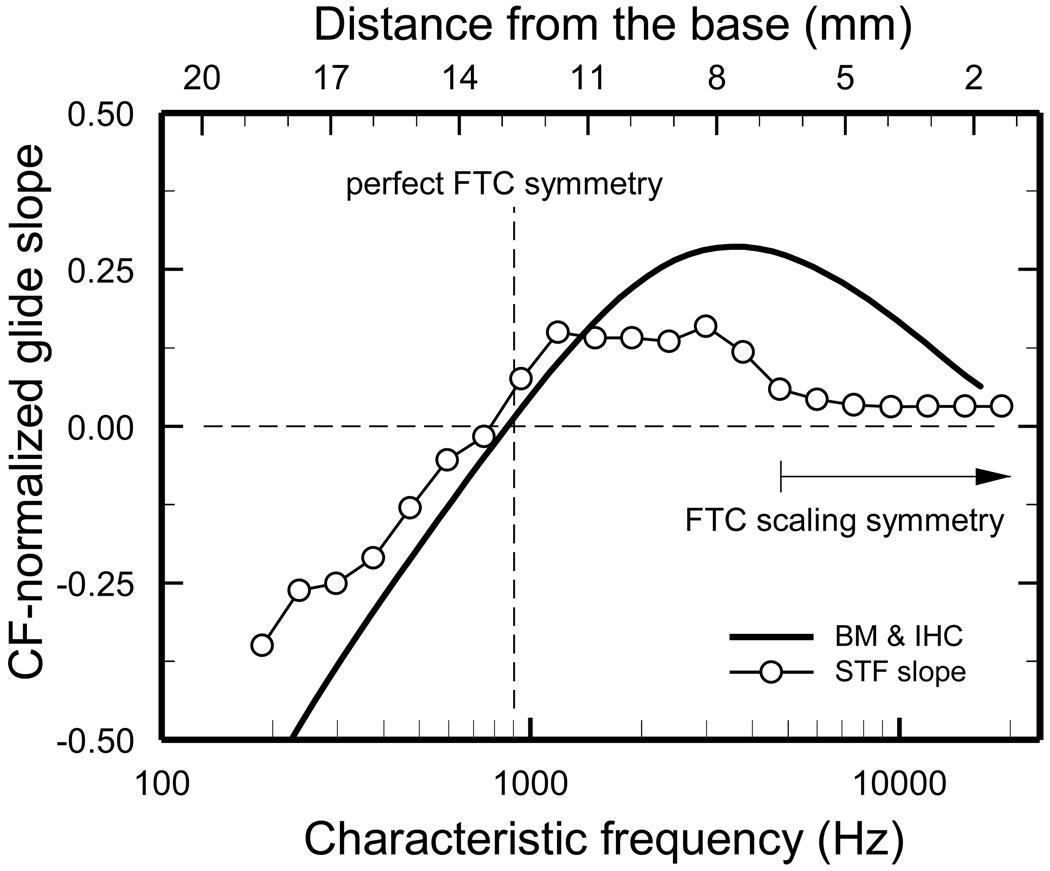
Figure 10 shows CF-normalized slopes (symbols) for the instantaneous-frequency curves of Fig. 9, expressed relative to CF in dimensionless units: slopes (kHz/ms) were divided by the squares of CF (kHz2) (Shera, 2001), measured between the first minimum of the STF impulse response and CF (thick red traces in Fig. 8). The corresponding slopes measured in experimental impulse responses (Wiener kernels of ANF responses to noise and BM responses to clicks) are indicated by the continuous trace. The instantaneous-frequency slopes of the STFs and of the experimental impulse responses are similar for CFs < 1.5 kHz and, in both cases, the slopes flip from negative to positive in the CF region around 0.9 kHz. This is also the CF at which ANF FTCs flip their asymmetry (indicated by the vertical dashed line): for CFs < 0.9 kHz, FTCs have larger “partial bandwidths” for frequencies > CF than for frequencies < CF; the reverse is true for CFs > 0.9 kHz [see Figs. 1 and 7 of (Temchin et al., 2008)]. Thus, for CFs < 1.5 kHz, a tight connection exists between the shapes of ANF FTCs and the frequency sweeps. However, the STF and measured slopes increasingly diverge for CFs > 1.5 kHz. The differences are especially large for CFs > 4 kHz, at which experimental slopes decrease systematically with increasing CF while STF slopes remain small and nearly invariant. The near-invariance of the STF instantaneous-frequency slopes for CFs > 4 kHz probably reflects the near-invariance of ANF FTCs when plotted with logarithmic abscissa normalized to CF in the basal third of the chinchilla cochlea (arrow labeled “scaling symmetry”) [see Fig. 7 and p. 2896 of (Temchin et al., 2008)]. It is clear that for high CFs the STFs do not predict accurately the frequency glides of the experimental impulse responses.
Figure 10. Instantaneous-frequency slopes of STF and measured cochlear impulse responses.
Open circles: slopes of the STF frequency glides, computed from the first STF trough and CF (spans indicated by thick traces in Figs. 8 and 9). Solid trace: average dimensionless slopes of frequency glides in BM responses to clicks and putative IHC impulse responses derived from Wiener kernels of chinchilla ANF responses to noise [Fig. 17C of (Recio-Spinoso et al., 2005)]. The vertical dashed line indicates the CF (~900 Hz) about which ANF FTCs are symmetrical [Figs.5 of (Temchin et al., 2008) and 3 of (Temchin and Ruggero, 2010)]. The horizontal arrow labeled “FTC scaling symmetry” indicates the (basal) region of the chinchilla cochlea (CFs ≥ 4.8 kHz) in which ANF FTCs plotted with abscissa representing log(frequency/CF) are identical [Fig. 7C of (Temchin et al., 2008)], indicating that the envelopes of the traveling wave are also identical (Zweig, 1976)]. The distance scale was computed from CFs according to the cochlear map of (Müller et al., 2010).
4. DISCUSSION
4.1. Links between magnitude and timing features of BM responses
The present findings indicate that strong links, akin to those that characterize minimum-phase linear systems, exist between frequency tuning and timing in cochlear responses. Specifically, STFs (minimum-phase filters combined with pure delays) yield some realistic predictions of the timing of cochlear responses, including phase lags at CF and the polarities of frequency sweeps in impulse responses. The predictions are especially good for apical cochlear sites and less so for basal sites. Superficially, these results are consistent with the fact that minimum-phase components combined with pure delays closely resemble mechanical responses at apical cochlear sites in guinea pig and humans (Zinn et al., 2000;Ruggero and Temchin, 2007) but not at basal sites in chinchilla (Recio-Spinoso et al., 2010). Nevertheless, the results are inadequate tests of minimum-phase behavior of BM vibrations because the STF amplitudes differ significantly from BM gain functions at frequencies between CF and the high-frequency plateau: for frequencies higher than CF and threshold levels, STFs for basal cochlear sites are linear and have very steep slopes, in contrast with BM gain functions, which are compressive and have substantially lower slopes (Fig. 1).
The present work has antecedents in the pioneering investigations of Goldstein et al. (1971), who explored whether the frequency tuning and the delays of ANF responses were related as would be expected in minimum-phase systems, and Møller and Nilsson, who attempted to relate the newly discovered frequency glides in ANF impulse responses to the shapes of FTCs (Møller and Nilsson, 1979). When frequency glides were also recognized in BM impulse responses (de Boer and Nuttall, 1997;Recio et al., 1998), several authors also suggested a connection between cochlear tuning and frequency glides [p. 210 of (Lyon, 1997), p. 2292 of (Recio and Rhode, 2000), and p. 2008 of (Tan and Carney, 2003)]. Such a connection is plausible because asymmetries in the frequency tuning of linear systems are associated with phase modulation (e.g., frequency glides) in impulse responses [pp. 131–132 of (Papoulis, 1962) and p. 123 of (Papoulis, 1977)]. In the case of filters with magnitude slopes that are steeper on the high-frequency side than in the low-frequency side, instantaneous frequencies glide from low to high; in the case of filters with reversed asymmetry, instantaneous frequencies glide from high to low. The present results demonstrate similar associations between FTC shapes (and hence, presumably, BM tuning) and the timing of cochlear responses. This finding is not entirely unremarkable, considering that cochlear nonlinearities are not instantaneous but, rather, are linked with (time-consuming) filtering (Recio-Spinoso et al., 2009).
4.2. Biophysical origin of transitions in ANF magnitude and timing properties across the 1 kHz and the 3–4 kHz CF boundaries
The present study was motivated by the presence of correlated transitions in the magnitude and timing properties of ANF responses across the 1 kHz and the 3–4 kHz CF boundaries (Temchin et al., 2008; Temchin and Ruggero, 2009). Temchin et al. (2008) hypothesized that the transition at the 3–4 kHz CF boundary results from tonotopic variations in BM mechanics, including active processes. Evidence for a role of active processes is the tonotopic variation of the effects of furosemide on ANF FTCs (Sewell, 1984), which are almost certainly mediated by reductions of the endocochlear potential which, in turn, diminish cochlear amplification. For CFs > 4 kHz, furosemide raises ANF FTC thresholds by greater amounts at the tips than at the tails (Sewell, 1984), directly reflecting the CF specific effects of furosemide on basal BM vibrations (Ruggero and Rich, 1991). For CFs < 4 kHz, furosemide raises thresholds by roughly similar amounts at all frequencies. This may indicate that, for CFs < 4 kHz, the active process encompasses the entire response bandwidth (rather than just the near-CF frequency region). This interpretation is supported by both direct (Rhode and Cooper, 1996) and indirect (Temchin and Ruggero, 2010) studies of apical cochlear mechanics in chinchilla which show that vibration magnitudes grow nonlinearly throughout the response bandwidth. Furthermore, level-dependent changes of response phase (Temchin and Ruggero, 2010), indicative of nonlinearity, also extend throughout the response bandwidth (in contrast with basal regions, where they are confined to the region near CF).
The correlated transitions near the 0.9-kHz CF boundary of ANF magnitude properties (i.e., FTC asymmetry and level-dependent shifts in rate-frequency functions) and timing properties (i.e., the polarity of the onset frequency glides of impulse responses and the shapes of phase-frequency functions) also probably reflect underlying properties of cochlear mechanics, including active processes. [It is noteworthy that whereas some discussions of BM frequency glides emphasized their apparent independence from active processes (Carney et al., 1999;Shera, 2001;de Boer and Nuttall, 2000), it is now clear that the frequency glides are influenced by active processes, as shown by their dependence, albeit weak, on stimulus level and cochlear health (Recio-Spinoso et al., 2009).] Furosemide raises FTC best frequencies for CFs < 1 kHz but lowers them for higher CFs (Sewell, 1984), indicating that the active process shapes mechanical frequency tuning differently on either side of the 1-kHz boundary. [Best frequency is the stimulus frequency at which responses are most sensitive at a given stimulus level, regardless of cochlear health or developmental stage (Overstreet, III et al., 2002).] Transitions in active mechanical processes at the 1- and 3–4 kHz CF boundaries seem consistent with the results of attempts to derive BM input-output functions at CF from ANF rate-level functions on the assumption that BM responses grow compressively at CF but linearly at frequencies << CF: such putative “BM” input–output functions were less compressive for CFs < 4 kHz than for higher CFs and could not be computed for CFs < 1.5 kHz (Cooper and Yates 1994).
4.3. Summary and conclusions
STFs were constructed by combining minimum-phase filter functions, derived from average FTCs of ANFs with high spontaneous activity, and signal-front delays specified by the latencies of BM and ANF responses to intense clicks (Fig. 2).
STFs predict qualitatively many of the overall features of phase-frequency curves of mechanical vibrations (either directly measured or derived from ANF phases) at both basal and apical cochlear sites, including the phases around CF (Figs. 4 and 5).
STFs for apical cochlear sites predict fairly accurately the shapes of cochlear phase-frequency curves (Fig. 7), including CF phases and group delays, around CF (Fig. 6), and of impulse responses, including their frequency glides and their polarity transition at CFs around 900 Hz (Fig. 10).
STFs for basal cochlear sites fail to predict correctly the details of phase-frequency curves for frequencies > CF (Figs. 5–7) and of impulse-response frequency glides (Fig. 10).
These findings constitute evidence that cochlear frequency tuning and timing are not independent but, rather, are interrelated.
ACKNOWLEDGEMENTS
We thank Nigel Cooper for his comments on a previous version of this paper. We were supported by grants from the NIH (2 R01 DC000419-20A2) and the Hugh Knowles Center.
Footnotes
Publisher's Disclaimer: This is a PDF file of an unedited manuscript that has been accepted for publication. As a service to our customers we are providing this early version of the manuscript. The manuscript will undergo copyediting, typesetting, and review of the resulting proof before it is published in its final citable form. Please note that during the production process errors may be discovered which could affect the content, and all legal disclaimers that apply to the journal pertain.
Reference List
- Bode HW. Network Analysis and Feedback Amplifier Design. New York: 1945. [Google Scholar]
- de Boer E, Nuttall AL. The mechanical waveform of the basilar membrane. I. Frequency modulations ("glides") in impulse responses and cross-correlation functions. J Acoust Soc Am. 1997;101:3583–3592. doi: 10.1121/1.418319. [DOI] [PubMed] [Google Scholar]
- Goldstein JL, Baer T, Kiang NY. A theoretical treatment of latency, group delay and tuning. Characteristics for auditory nerve responses to clicks and tones. In: Sachs MB, editor. The Physiology of the Auditory System. Baltimore: National Educational Consultants; 1971. pp. 133–141. [Google Scholar]
- Huang S, Dong W, Olson EC. Subharmonics and auditory nerve tuning curves. Assoc.Res.Otolaryngol., Midwinter Meet. Abstracts. 2010;33:255. [Google Scholar]
- IEEE. Programs for Digital Signal Processing. New York: IEEE Press; 1979. [Google Scholar]
- Lyon RF. All-pole models of auditory filtering. In: Lewis ER, Long GR, Narins PM, Steele CR, Hecht-Poinar E, editors. Diversity in Auditory Mechanics. Singapore: World Scientific; 1997. pp. 205–211. [Google Scholar]
- Møller AR, Nilsson HG. Inner ear impulse response and basilar membrane modelling. Acustica. 1979;41:258–262. [Google Scholar]
- Müller M, Hoidis S, Smolders JWT. Hearing Research. 2010. A physiological frequency-position map of the chinchilla cochlea. In Press, Corrected Proof. [DOI] [PubMed] [Google Scholar]
- Narayan SS, Ruggero MA. Basilar-membrane mechanics at the hook region of the chinchilla cochlea. In: Wada H, Takasaka T, Ikeda K, Ohyama K, Koike T, editors. Recent Developments in Auditory Mechanics. Singapore: World Scientific; 2000. pp. 95–101. [Google Scholar]
- Narayan SS, Temchin AN, Recio A, Ruggero MA. Frequency tuning of basilar membrane and auditory nerve fibers in the same cochleae. Science. 1998;282:1882–1884. doi: 10.1126/science.282.5395.1882. [DOI] [PMC free article] [PubMed] [Google Scholar]
- Oppenheim AV, Schafer RW. Digital Signal Processing. Englewood Cliffs, NJ: Prentice-Hall; 1975. [Google Scholar]
- Overstreet EH, III, Temchin AN, Ruggero MA. Passive basilar membrane vibrations in gerbil neonates: mechanical bases of cochlear maturation. J Physiol. 2002;545:279–288. doi: 10.1113/jphysiol.2002.025205. [DOI] [PMC free article] [PubMed] [Google Scholar]
- Papoulis A. The Fourier Integral and its Applications. New York: McGraw-Hill; 1962. [Google Scholar]
- Papoulis A. Signal Analysis. New York: McGraw-Hill; 1977. [Google Scholar]
- Recio A, Rhode WS. Basilar membrane responses to broadband stimuli. J Acoust Soc Am. 2000;108:2281–2298. doi: 10.1121/1.1318898. [DOI] [PubMed] [Google Scholar]
- Recio A, Rich NC, Narayan SS, Ruggero MA. Basilar-membrane responses to clicks at the base of the chinchilla cochlea. J Acoust Soc Am. 1998;103:1972–1989. doi: 10.1121/1.421377. [DOI] [PMC free article] [PubMed] [Google Scholar]
- Recio-Spinoso A, Fan Y-H, Ruggero MA. Basilar-membrane responses to broadband noise modeled using linear filters with rational transfer functions. IEEE Trans on Biomed Engin. 2010 doi: 10.1109/TBME.2010.2052254. (in press) [DOI] [PMC free article] [PubMed] [Google Scholar]
- Recio-Spinoso A, Narayan SS, Ruggero MA. Basilar membrane responses to noise at a basal site of the chinchilla cochlea: quasi-linear filtering. J Assoc Res Otolaryngol. 2009;10:471–484. doi: 10.1007/s10162-009-0172-0. [DOI] [PMC free article] [PubMed] [Google Scholar]
- Recio-Spinoso A, Temchin AN, van Dijk P, Fan YH, Ruggero MA. Wiener-kernel analysis of responses to noise of chinchilla auditory-nerve fibers. J Neurophysiol. 2005;93:3615–3634. doi: 10.1152/jn.00882.2004. [DOI] [PubMed] [Google Scholar]
- Rhode WS. Basilar membrane mechanics in the 6–9 kHz region of sensitive chinchilla cochleae. J Acoust Soc Am. 2007;121:2792–2804. doi: 10.1121/1.2718397. [DOI] [PubMed] [Google Scholar]
- Rhode WS, Cooper NP. Nonlinear mechanics in the apical turn of the chinchilla cochlea in vivo. Auditory Neuroscience. 1996;3:101–121. [Google Scholar]
- Rhode WS, Recio A. Study of mechanical motions in the basal region of the chinchilla cochlea. J Acoust Soc Am. 2000;107:3317–3332. doi: 10.1121/1.429404. [DOI] [PubMed] [Google Scholar]
- Robles L, Ruggero MA. Mechanics of the mammalian cochlea. Physiol Rev. 2001;81:1305–1352. doi: 10.1152/physrev.2001.81.3.1305. [DOI] [PMC free article] [PubMed] [Google Scholar]
- Ruggero MA, Narayan SS, Temchin AN, Recio A. Mechanical bases of frequency tuning and neural excitation at the base of the cochlea: comparison of basilar-membrane vibrations and auditory-nerve-fiber responses in chinchilla. Proc Natl Acad Sci U S A. 2000;97:11744–11750. doi: 10.1073/pnas.97.22.11744. [DOI] [PMC free article] [PubMed] [Google Scholar]
- Ruggero MA, Rich NC. Timing of spike initiation in cochlear afferents: dependence on site of innervation. J Neurophysiol. 1987;58:379–403. doi: 10.1152/jn.1987.58.2.379. [DOI] [PubMed] [Google Scholar]
- Ruggero MA, Rich NC. Furosemide alters organ of corti mechanics: evidence for feedback of outer hair cells upon the basilar membrane. J Neurosci. 1991;11:1057–1067. doi: 10.1523/JNEUROSCI.11-04-01057.1991. [DOI] [PMC free article] [PubMed] [Google Scholar]
- Ruggero MA, Rich NC, Recio A, Narayan SS, Robles L. Basilar-membrane responses to tones at the base of the chinchilla cochlea. J Acoust Soc Am. 1997;101:2151–2163. doi: 10.1121/1.418265. [DOI] [PMC free article] [PubMed] [Google Scholar]
- Ruggero MA, Temchin AN. Similarity of traveling-wave delays in the hearing organs of humans and other tetrapods. J Assoc Res Otolaryngol. 2007;8:153–166. doi: 10.1007/s10162-007-0081-z. [DOI] [PMC free article] [PubMed] [Google Scholar]
- Ruggero MA, Temchin AN, Fan Y-H, Cai H. Boost of transmission at the pedicle of the incus in the chinchilla middle ear. In: Huber A, Eiber A, editors. Middle Ear Mechanics in Research and Otology. Singapore: World Scientific; 2007. [Google Scholar]
- Sewell WF. The effects of furosemide on the endocochlear potential and auditory-nerve fiber tuning curves in cats. Hear Res. 1984;14:305–314. doi: 10.1016/0378-5955(84)90057-1. [DOI] [PubMed] [Google Scholar]
- Shera CA. Frequency glides in click responses of the basilar membrane and auditory nerve: their scaling behavior and origin in traveling-wave dispersion. J Acoust Soc Am. 2001;109:2023–2034. doi: 10.1121/1.1366372. [DOI] [PubMed] [Google Scholar]
- Tan Q, Carney LH. A phenomenological model for the responses of auditory-nerve fibers. II. Nonlinear tuning with a frequency glide. J Acoust Soc Am. 2003;114:2007–2020. doi: 10.1121/1.1608963. [DOI] [PubMed] [Google Scholar]
- Temchin AN, Recio-Spinoso A, van Dijk P, Ruggero MA. Wiener kernels of chinchilla auditory-nerve fibers: verification using responses to tones, clicks, and noise and comparison with basilar-membrane vibrations. J Neurophysiol. 2005;93:3635–3648. doi: 10.1152/jn.00885.2004. [DOI] [PMC free article] [PubMed] [Google Scholar]
- Temchin AN, Rich NC, Ruggero MA. Threshold tuning curves of chinchilla auditory-nerve fibers. I. Dependence on characteristic frequency and relation to the magnitudes of cochlear vibrations. J Neurophysiol. 2008;100:2889–2898. doi: 10.1152/jn.90637.2008. [DOI] [PMC free article] [PubMed] [Google Scholar]
- Temchin AN, Rich NC, Ruggero MA. Threshold tuning curves of chinchilla auditory-nerve fibers predict cochlear phase-frequency curves and impulse-response frequency glides. Association for Research in Otolaryngology Mid-Winter Meeting Abstracts. 2009;32:209. [Google Scholar]
- Temchin AN, Ruggero MA. Phase-locked responses to tones of chinchilla auditory-nerve fibers: implications for apical cochlear mechanics. Journal of the Association for Research in Otolaryngology. 2010;11:297–318. doi: 10.1007/s10162-009-0197-4. [DOI] [PMC free article] [PubMed] [Google Scholar]
- Zinn C, Maier H, Zenner H, Gummer AW. Evidence for active, nonlinear, negative feedback in the vibration response of the apical region of the in-vivo guinea-pig cochlea. Hear Res. 2000;142:159–183. doi: 10.1016/s0378-5955(00)00012-5. [DOI] [PubMed] [Google Scholar]
- Zweig G. Basilar membrane motion. Cold Spring Harb Symp Quant Biol. 1976;40:619–633. doi: 10.1101/sqb.1976.040.01.058. [DOI] [PubMed] [Google Scholar]


