

Abstract
Prenatal androgen produces many reproductive and metabolic features of polycystic ovary syndrome in female rodents, sheep, and monkeys. We investigated the impact of such prenatal treatment in adult male rats. Pregnant dams received free testosterone (T; aromatizable androgen), dihydrotestosterone (D; non-aromatizable androgen), or vehicle control (C) on embryonic day 16–19. Neither of the prenatal androgen treatments resulted in increased body weight from weaning to age 65 days in males. However, at 65 days, there were significant increases in retroperitoneal (P<0.001 T vs C; P<0.05 D vs C), epididymal (P<0.05 T vs C), and subcutaneous (sc; P<0.01 T vs C) fat pads in prenatally androgenized males. While both androgens altered body composition, sc fat depots increased only in T males. T males had elevated glucose levels (P<0.01) compared to C males. There were no differences among the 3 groups in insulin sensitivity, circulating lipid and leptin levels, or hepatic triglyceride content. Real-time PCR analysis of insulin signaling pathway genes in retroperitoneal fat revealed a transcriptional down-regulation of adipsin and insulin receptor substrate-1 in T and α-1D adrenergic receptor in D compared to C males. We conclude that transient exposure to androgen excess in utero increases body fat in adult male rats. Only T males exhibit increased circulating glucose levels and sc fat suggesting that these changes may be mediated by aromatization of androgen to estrogen rather than by direct androgenic actions.
Keywords: Prenatal Programming, Body Composition, Androgen Action, Sex Differences
Introduction
Polycystic ovary syndrome (PCOS) is a common endocrine disorder that affects 5–10% of premenopausal women (Ehrmann 2005). Hyperandrogenemia is the cardinal reproductive feature of this syndrome (Legro, et al. 1998), whereas insulin resistance is central to the metabolic phenotype (Dunaif 1997). Familial aggregation of PCOS is well documented suggesting a genetic susceptibility to this disorder (Legro et al. 1998; Urbanek 2007). First-degree female relatives of women with PCOS have an increased prevalence of hyperandrogenemia, insulin resistance and metabolic syndrome (Sam, et al. 2005; Sam, et al. 2006). Brothers of women with PCOS have elevated levels of dehydroepiandrosterone sulfate (Legro, et al. 2002) and metabolic abnormalities including insulin resistance and dyslipidemia (Sam, et al. 2008; Yildiz, et al. 2003; Yilmaz, et al. 2005). These findings are consistent with the hypothesis that some metabolic and reproductive abnormalities in PCOS are heritable and are not sex-specific.
Prenatally androgenized (PA) female non-human primates and sheep, two animal models for PCOS, show most of the reproductive and metabolic defects seen in women with PCOS. Furthermore, we have shown defeminization of the GnRH neurosecretory system (Foecking and Levine 2005) and increased adiposity, circulating insulin and lipid levels, as well as hepatic triglyceride (TG) content in adult PA female rats (Demissie, et al. 2008). These findings suggest that fetal exposure to androgen excess in female rodents programs for both reproductive and metabolic features of PCOS. However, there have been limited investigations of the phenotype of the male offspring in these PCOS animal models. Bruns and colleagues (Bruns, et al. 2004) showed that adult PA male rhesus monkeys also exhibit insulin resistance and impaired insulin secretion, similar to PA female monkeys. PA male sheep developed oligospermia and reduced sperm motility (Recabarren, et al. 2008), while PA male rats showed a decrease in anogenital distance (Wolf, et al. 2002). The aim of this study was to determine whether intrauterine androgen excess programs for the metabolic features of PCOS in adult male rats, as has been previously seen in PA female rats. We also sought to determine whether the resulting metabolic phenotype was mediated by androgenic or estrogenic pathways. These experiments assess the potential link between fetal exposure to androgen excess in males and metabolic features similar to those observed in first-degree male relatives of women with PCOS.
Materials and Methods
Animal Treatments and Diet
All rodent procedures were approved by the Animal Care and Use Committee at Northwestern University (Evanston, IL). Rats were housed at 23–24 °C on a 14:10-h light-dark cycle.
Time-pregnant female Sprague Dawley rats were obtained from Charles River (Portage, WI) at day 14 of gestation and treated from embryonic day 16 (E16) to E19 with daily subcutaneous (sc) injections of either 5 mg of an aromatizable androgen testosterone (T, n=6; Sigma T-1500, St. Louis, MO), 5 mg of a non-aromatizable androgen 5α-dihydrotestosterone (D, n=7; Sigma, St. Louis, MO) both dissolved in 500 μl of sesame oil (Sigma S3547, St. Louis, MO)/benzyl benzoate (Sigma B6630, St. Louis, MO) or the vehicle as a control (C, n=8). This treatment paradigm was designed to mimic in female fetuses the fetal T surge that is observed in male rats (Foecking and Levine 2005). The male fetuses were, therefore, exposed to supraphysiologic androgen levels. The DHT dose was selected based on our previous finding that 5 mg DHT produced a similar degree of masculinization of the anogenital distance as 5 mg T in PA female rats (Foecking, et al. 2005). In preliminary experiments, we found no significant differences in either female to male offspring ratio, number of pups per litter, or birth weights between T, D or C animals (unpublished observations). All litters were weaned and males were separated from females at 21 days (d) of age and housed 2–3 per cage, unless otherwise stated. Once weaned, rats were fed regular rat chow diet (3.30 Kcal/g with 24% as protein, 4% as fat by weight; Harlan-Teklad, Madison, WI) and water ad libitum. Body weight (BW) was monitored weekly from 14 to 63 d. Food intake was monitored twice a week starting at 21 d (weaning) to 12 weeks in cages with individually-housed male rats and their BW was recorded up to 22 weeks.
Study Protocols (Figure 1)
Figure 1.
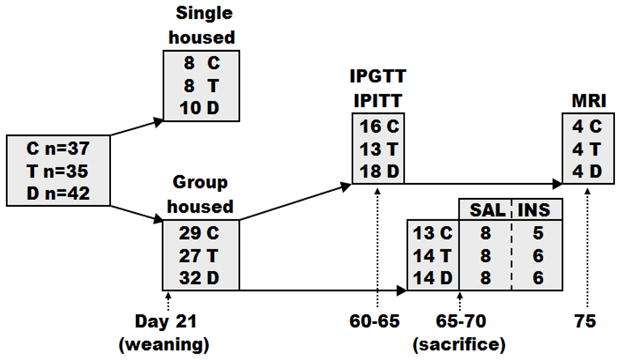
Study schema with the number of animals used in each experiment. IPITT, intraperitoneal insulin tolerance test; IPGTT, intraperitoneal glucose tolerance test; SAL, saline baseline; INS, insulin stimulated.
At weaning, males were either placed 2–3 per cage (29 C, 27 T, 32 D) or individually-housed to precisely monitor changes in BW and food intake (8 C, 8 T, 10 D). Group-housed adult male rats at 65–70 d of age (16 C, 15 T, 16 D) were fasted overnight, anesthetized with CO2, weighed, and decapitated. In order to examine insulin signaling, roughly half of the animals in all experimental groups were injected intraperitoneally (ip) with 5 U of regular human insulin (NovoNordisk, Princeton, NJ) in 100 μl of 0.9% sodium chloride (Abraxis, Schaumberg, IL), and half were injected with 100 μl of 0.9% sodium chloride, 10 minutes (min) before sacrifice. Liver, adipose tissue depots (retroperitoneal, epididymal and sc), and soleus muscles were excised, weighed, frozen and stored at −80°C for further analyses. Tissues from both saline and insulin treated rats were used for analyses of body composition and hepatic TG content (16 C, 15 T, 16 D), since the acute administration of insulin would not alter these endpoints.
Dynamic Studies (Figure 1)
Dynamic studies of glucose homeostasis were performed in group-housed adult male rats at 60–65 d of age (16 C, 13 T, 18 D) with jugular catheters implanted one day before testing. Intraperitoneal glucose tolerance test (IPGTT) was performed after an overnight fast (~15 h). A baseline blood sample was followed by ip injection of 1 g/kg BW dextrose and blood sampling at 2, 5, 10, 15, 30, 60, 90 and 120 min. The baseline blood sample was used to determine the fasting glucose, insulin, C-peptide, leptin, and total cholesterol and TG levels. Intraperitoneal insulin tolerance test (IPITT) was performed after 4 h of fasting. A baseline blood sample was obtained followed by ip injection of 1 U/kg BW insulin and blood sampling at 15, 30, 60, 90 and 120 min. Animals were allowed a minimum of 48 h to recuperate between the IPGTT and IPITT.
Hormone Assays, Plasma Lipids and Hepatic Triglyceride Content
Whole blood glucose levels were measured using Prestige Smart System Glucose Monitor (Home Diagnostics, Inc., Ft. Lauderdale, FL). Insulin and leptin levels were measured by Ultra Sensitive Rat Insulin and Rat Leptin ELISA kits, respectively (Crystal Chem Inc., Downers Grove, IL). C-peptide was measured by Rat C-Peptide I & II ELISA kit (ALPCO Diagnostics, Salem, NH). Circulating TG and cholesterol levels and hepatic TG content were assessed by spectrophotometric assay (Infinity Triglyceride and Cholesterol Reagent Kits, Thermo Fisher Scientific, Pittsburgh, PA). Circulating free fatty acids (FFA) were measured by the Wako HR series NEFA-HR (2), an in vitro enzymatic colorimetric method assay for the quantitative determination of FFA in serum (Wako Diagnostics, Richmond, VA). Hepatic TG content was expressed as percent of protein content as described previously (Sundaram, et al. 2005).
Gene Expression Profiling
Total RNA was extracted and purified from 100 mg of retroperitoneal fat (n=8 per group of saline treated animals) using the RNeasy Lipid Tissue Mini Kit (Qiagen, Valencia, CA). This fat pad was chosen since it was increased in both T and D as compared to C rats and it is also a major visceral fat depot implicated in development of insulin resistance (Gabriely, et al. 2002). One μg of retroperitoneal fat RNA from each rat was reverse transcribed and quantitative real-time PCR (qPCR) analysis of 84 insulin signaling pathway related genes was performed using rat-specific Insulin Signaling RT2 Profiler PCR Arrays (SABiosciences, Frederick, MD) according to the manufacturer’s protocol. The complete list of the genes analyzed is available online at http://www.sabiosciences.com/rt_pcr_product/HTML/PARN-030A.html. Relative gene expression levels were normalized to the average of five housekeeping genes: large ribosomal protein P1, hypoxanthine phosphoribosyl transferase 1, ribosomal protein L13A, lactate dehydrogenase A, and beta actin. Data analysis was performed using ΔΔCt based fold-change method (Livak and Schmittgen 2001).
Western Blotting
Liver, soleus muscle, and retroperitoneal fat lysates were resolved using SDS-PAGE on 7.5% gels and immunoblotted with specific antibodies to AKT and phospho-AKT (ser473) (Cell Signaling, Beverly, MA), and appropriate secondary antibody (goat anti-rabbit horseradish peroxidase, HRP, conjugates) (Cell Signaling, Beverly, MA). Retroperitoneal fat lysates (n=8 per group of saline treated animals) were resolved using SDS-PAGE on 4–20% gradient gels and immunoblotted with specific antibodies to adipsin L-21 (Santa Cruz Biotechnology, Santa Cruz, CA), insulin receptor substrate-1 (IRS-1) (Millipore Corporation, Billerica, MA) and pan-actin (Cell Signaling, Beverly, MA), and appropriate secondary antibodies (goat anti-rabbit HRP conjugates for IRS-1and pan-actin, and rabbit anti-goat HRP conjugates for adipsin) (Cell Signaling, Beverly, MA; Santa Cruz Biotechnology, Santa Cruz, CA, respectively). We did not perform Western Blot analysis for α-1D adrenergic receptor (ADRD1) due to the lack of specificity of commercially available antibodies (Jensen, et al. 2009). Both treatment groups and vehicle controls were run together on the same gels. Bands were visualized and analyzed as described previously (Corbould, et al. 2006), with minor modifications. Immunoblots were quantified using a high resolution scanner and the density was calculated by ImageJ software (National Institutes of Health, Bethesda, MD). Phosphorylation was expressed as the ratio of phosphorylated to total protein.
Fat Distribution by MRI
A 3T whole body MR scanner and an 8 channel knee coil were used to obtain high resolution images of the whole body of the rat. Four animals per group were scanned at 75 d of age immediately after sacrifice. The knee coil allowed the entire body of the rat to be imaged without having to move the animal but still afforded high signal to noise ratio. The imaging included a standard spin echo anatomic scan, a water suppressed image and a fat suppressed image. The latter two images were used to mask the standard imaging to automate the analysis. The standard spin echo imaging parameters were TR = 500 ms, TE = 11 ms, FOV = 75 mm, matrix = 256, slice thickness of 2 mm. The inplane resolution was 0.29 mm. With two averages the total acquisition time was 3.2 min. This technique allowed us to gain axial images of visceral area and thus support our fat pad dissection data.
Statistical analysis
Repeated measures two-way ANOVA with time and treatment as factors was applied to BW and IPITT with a Bonferroni’s post-hoc test to determine which groups differed significantly. The area-under-the curve for insulin and glucose levels during the IPGTT was determined according to the trapezoidal rule. For all other analyses, one-way ANOVA with Tukey’s or Kruskal-Wallis with Dunns’ post-hoc test was used according to normality of the data. Data are reported as mean ± SEM with significance at P < 0.05. All analyses were performed using GraphPad Software (GraphPad Software Inc, San Diego, CA).
Results
Baseline Features
There were no differences in BW d 14 to 63 among prenatal T, D and C group-housed males (Figure 2A). There were also no differences among T, D and C males in food intake (up to 12 weeks) or BW (up to 22 weeks) of age in individually housed males (data not shown). However, at 65–70 d, the retroperitoneal fat depots were increased by almost 60% in T compared to C males (P<0.001) and 30% in D compared to C males (P<0.05) (Figure 2B). Both epididymal (P<0.05) and sc fat (P<0.01) were increased (20–30%) in T compared to C males. Subcutaneous fat depots were increased only in T males (P<0.05, T vs D) (Figure 2B). Representative axial MRI images of the visceral area (renal section) show a modest increase in retroperitoneal fat content in D compared to C males and a more striking increase in both mesenteric and retroperitoneal fat depots in T compared to C males (Figure 2C).
Figure 2.

Body weight and body composition. (A) There were no significant differences in BW among control (C; open squares), testosterone (T; black triangles) and dihydrotestosterone (D; black circles) males. (B) Body composition: T males (striped bars) had significantly increased retroperitoneal, epididymal and sc fat pad weights compared to C males (open bars). D males (black bars) had significantly increased retroperitoneal fat pad weight compared to C males. Values are mean ± SEM. C n=16, T n=15, D n=16. *P<0.05, **P<0.01, ***P<0.001 vs C. †P<0.05 T vs D. (C) Representative MRI axial images of visceral area (renal section) in C, T and D males showed a modest increase in retroperitoneal fat content in D compared to C males and a more striking increase in both mesenteric and retroperitoneal fat depots in T compared to C males; 1) retroperitoneal, 2) mesenteric and 3) sc fat.
T males had elevated fasting glucose levels (P<0.01) compared to C males, but there was no significant difference in circulating insulin levels in among the T, D and C males (Figure 3). There were no significant differences in the insulin to C-peptide molar ratio (Figure 3) or in circulating C-peptide or leptin levels (not shown). There were also no differences in TG, cholesterol, or FFA levels or in hepatic TG content (not shown).
Figure 3.

Biochemical changes. (A) Serum glucose levels were significantly increased in T (striped bars) compared to C males (open bars), **P<0.01 vs C. (B) Serum insulin levels and (C) insulin to C-peptide molar ratio were not significantly different among C, T and D males (black bars). Values are mean ± SEM. C n=17, T n=14, D n=19.
Dynamic Testing
Following IPGTT, there were no differences in glucose or insulin responses among T, D and C males (Figure 4). There were no differences in insulin sensitivity assessed by IPITT among T, D and C males (Figure 4).
Figure 4.

Dynamic testing. There were no significant differences in: (A) glucose and (B) insulin levels during IPGTT; (C) percent basal glucose during IPITT among C (open squares), T (black triangles) and D males (black circles). Values are mean ± SEM. C n=16, T n=13, D n=18.
Insulin Signaling
There were no significant differences in insulin-stimulated activation of AKT (phospho-AKT to AKT ratio) in soleus muscle, liver or retroperitoneal fat pads among T, D and C males (Figure 5). Analysis of insulin signaling pathway genes in retroperitoneal fat by qPCR revealed a significant down-regulation of adipsin/complement factor D (Adn/Cfd) and Irs-1 mRNA levels in T males, and Adrd1 mRNA levels in D compared to C males (Table 1). A trend was observed in IRS-1 protein abundance in retroperitoneal fat, expressed as percent standard and normalized to pan-actin levels: 122 ± 12 in C, 67 ± 18 in T, and 87 ± 17 in D males (mean ± SEM, ANOVA P=0.12, not shown). There were no significant differences detected in total protein abundance of adipsin normalized to pan-actin levels in retroperitoneal fat pads among T, D and C males (not shown).
Figure 5.
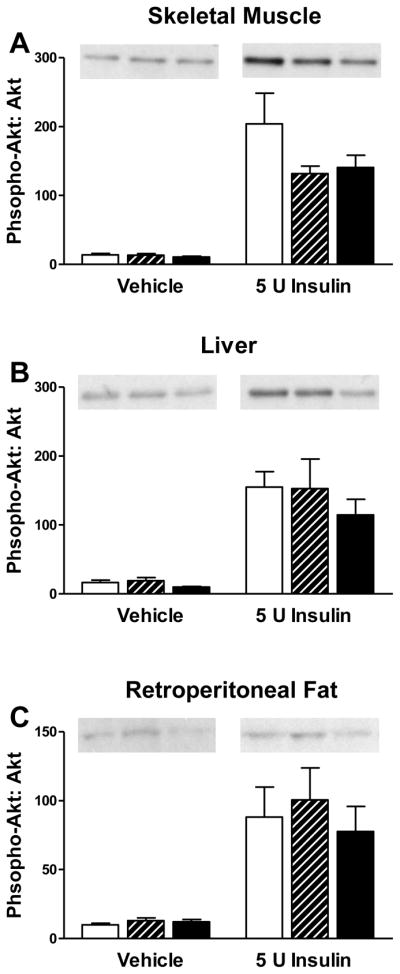
Insulin signaling (represented as a phospho-AKT: AKT ratio) after 10 min ± ip insulin (5U). No differences in insulin action were detected in (A) skeletal muscle, (B) liver and (C) retroperitoneal fat among C (open bars), T (striped bars) and D males (black bars). Tissue-specific representative Western Blot images of phospho-AKT are shown above the figures. Values are mean ± SEM. C n=8 saline, n=5 insulin; T n=8 saline, n=6 insulin; D n=8 saline, n=6 insulin.
Table 1.
Expression profiling of insulin signaling pathway related genes in retroperitoneal fat of male rats
| Group Gene | C | T | D | One-way ANOVA P-value | Gene Description |
|---|---|---|---|---|---|
| Fold difference, % (normalized to C) | |||||
| Adn/Cfd | 100.0±8.6 | 62.5±7.3** | 87.3±8.3 | 0.01 | Adipsin/Complement factor D (Target gene for PPARγ) |
| Adrd1 | 100.0±14.3 | 77.9±13.6 | 59.7±11.0* | 0.04 | Adrenergic, alpha-1D-, receptor (PI-3 Kinase Pathway) |
| Irs1 | 100.0±12.9 | 52.8±7.8* | 69.7±12.3 | 0.03 | Insulin Receptor Substrate-1 (Insulin Receptor-Associated Protein) |
Values are means ± SEM, n = 7–8/group, expressed as percent fold change from controls.
P<0.05,
P<0.01 vs C
Discussion
We previously reported that prenatal androgen excess programs for features of the metabolic syndrome in adult female rats (Demissie et al. 2008). The present studies reveal that prenatal androgen excess programs male rat offspring for increased body fat mass and fasting glucose levels in early adulthood, although there were no changes in total BW. In particular, at 65 d of age, prenatal T treatment significantly increased both visceral (retroperitoneal and epididymal) and sc fat depots, while prenatal D treatment increased only retroperitoneal fat depots compared to C males. Circulating glucose levels were significantly increased and Irs1 mRNA expression was significantly decreased in retroperitoneal fat in T males. Nevertheless, in both T and D males, there were no defects in glucose tolerance, insulin sensitivity or insulin-mediated activation of AKT in soleus muscle, liver, or retroperitoneal fat. Further, there were no changes in circulating lipid, FFA or leptin levels or in hepatic TG content with either PA treatment. These finding are in contrast to those in PA male non-human primates that exhibit both insulin resistance and impaired insulin secretion, while maintaining normal fasting serum glucose (Bruns et al. 2004).
Despite significantly increased fat mass, PA male rat total BW did not change, analogous to findings in PA male monkeys (Bruns et al. 2004). These findings suggest that PA alters body composition but not BW in male rats. In contrast, total BW as well as visceral and sc fat mass increased in PA females (Demissie et al. 2008). In addition, PA females developed increased serum insulin, TG and cholesterol levels and hepatic TG content (Demissie et al. 2008), whereas T males developed increased fasting glucose levels. Furthermore, despite the marked increase in adipose tissue in PA males, there were no changes in leptin or FFA levels. We failed to detect significant decreases in insulin sensitivity or signaling in PA rats of both sexes. The maintenance of normal circulating glucose levels, despite increased circulating insulin levels, suggested the presence of insulin resistance in PA females (Demissie et al. 2008).
To gain further insight into the mechanism of the programming actions of prenatal androgens in males, we compared the effects of prenatal D to those of prenatal T. T can be converted to estrogen by the action of the aromatase enzyme, which, in humans, is expressed in many tissues, including the gonads, central nervous system, bone, placenta and fetal liver (Mendelson and Kamat 2007). However, in most vertebrates, including rodents, the primary source of aromatase is the ovary (Mendelson and Kamat 2007). Therefore, in T treated animals, reprogramming of fetal tissues could result from exposure to excess estrogen via the dam’s gonadal or fetal aromatization of androgens. Thus, the effect of prenatal T could be due to androgenic and estrogenic pathways. In contrast, D is a non-aromatizable androgen that has conventionally been thought to signal only through androgenic pathways (McGuire 1960). More recently, it has been shown that a metabolite of D, 5α-androstan-3β,17β-diol, may activate estrogen receptors in rat prostate (Weihua, et al. 2001) and hypothalamus (Pak, et al. 2005). However, other studies do not confirm the findings in hypothalamus (Lindzey, et al. 1998). Furthermore, the amount of 5α-androstan-3β,17β-diol produced in vivo is small and its circulating half-life is very short (Grover and Odell 1975). Therefore, it remains likely that the changes observed with prenatal D treatment reflect primarily androgenic actions.
The body composition data and MRI axial images of the visceral area suggest that T males had increased fat mass compared to both C and D males. In particular, sc fat mass was significantly higher in T males when compared to both C and D males. It is well documented that females, both human and rodent, have a greater amount of sc fat distributed in the gluteal/femoral region, while males have a more central accumulation of fat (Bjorntorp 1991; Clegg, et al. 2006; Lonnqvist, et al. 1997). Jean Vague was first to observe that the pattern of fat deposition in obese individuals might be influenced by relative amounts of androgenic and estrogenic sex hormones (Vague 1956). Accordingly, it has been shown that estrogen excess in male rats produces a female-like fat distribution phenotype with increased sc compared to visceral fat deposition (Clegg et al. 2006). The finding of increased sc fat depots in T males suggests that a portion of prenatal T was aromatized to estrogen and programmed a more female-like body fat distribution. Conversely, prenatal D programmed for increased retroperitoneal fat without changes in sc fat. This finding is consistent with the observation that androgen receptor density is about two-times lower in sc as compared to visceral fat preadipocytes (Dieudonne, et al. 1998), which would decrease the effects of androgens on sc adipose tissue.
In order to further delineate the mechanisms leading to the differences in body composition in PA males, we performed expression profiling of insulin signaling pathway genes in retroperitoneal fat. This fat depot was chosen since it was increased in both T and D males. It is also a major visceral fat pad implicated in development of insulin resistance (Barzilai, et al. 1998; Gabriely et al. 2002). We found significant down-regulation of Adn and Irs1 mRNA levels in T and Adrd1 mRNA levels in D males. Adn, also known as complement factor D, is a serine protease that stimulates glucose transport for TG accumulation in fat cells, inhibits lipolysis, and is involved in the alternative complement pathway (Ronti, et al. 2006). Interestingly, another complement factor - C3, closely related to Adn and associated with insulin resistance, is down-regulated by neonatal estrogen excess in rats (Alexanderson, et al. 2009).
Sex steroids play an important and complex role in preadipocyte differentiation and proliferation. Moreover, IRS-1 has been shown to have a pivotal role in adipocyte differentiation through the activation of proliferator-activated receptor γ (Miki, et al. 2001). These observations raise the possibility that the elevation in prenatal androgens caused an alteration in IRS-1 expression, which, in turn, programmed for increased adiposity in adulthood. However, Dieudonne and colleagues (Dieudonne, et al. 2000) showed that T reduced differentiation of preadipocytes extracted from epididymal tissue of male rats in a dose dependent manner, suggesting that androgens have a primarily antiadipogenic role on visceral fat depots in the adult. This observation is in contrast to the in vivo effects of androgens on preadipocytes and adipose tissue development. Castrated male rats display a significant decrease in visceral fat depots (Clegg et al. 2006), while PA first-calf heifers had greater fat deposition and increased overall growth rates (Reiling, et al. 1997). In agreement with our studies, these observations suggest that androgens exhibit proadipogenic effects in vivo at both pre- and postnatal stages. It is also possible that reduced expression of Adrd1 in D males decreased rates of lipolysis (Lafontan and Berlan 1993), resulting in increased deposition of fat (Jocken and Blaak 2008). Contrary to our expectations, there were no changes in expression levels of genes directly involved in fatty acid metabolism or in lipid/glucose transport, such as acetyl-CoA carboxylase, fatty acid synthase, glucose transporter type 4 or low-density lipoprotein receptor.
In concordance with the qPCR data, IRS-1 protein in retroperitoneal fat showed a trend for lower levels in T males as compared to C males. However, changes in neither IRS-1 nor adipsin protein abundance reached statistical significance. This finding may reflect the fact that the limited number of available samples did not provide adequate statistical power. Further, a lack of correlation between mRNA expression and protein abundance is frequently observed in complex biological systems, often due to differences in translational efficiency, post-transcriptional regulation of gene expression and protein stability (Maier, et al. 2009). Nevertheless, even in the absence of detectable changes in protein abundance, the observed changes in mRNA levels suggest that prenatal androgens may program for altered transcriptional regulation of these genes. We did not perform Western Blot analysis for ADRD1 due to the lack of specificity of commercially available antibodies (Jensen, et al. 2009).
We conclude that transient exposure to androgen excess in utero increases body fat levels in adult male rats. Only T males exhibit increased circulating glucose and sc fat suggesting that these changes may be mediated by aromatization of androgen to estrogen rather than by direct androgenic actions. In contrast to PA female rats, PA males do not develop insulin resistance or dyslipidemia. These differences suggest that prenatal programming of some metabolic traits by androgens is sex-specific.
Acknowledgments
Grant Support: This work was supported by NIH grant P50 HD044405
We thank Jorie Aardema, Brigitte Mann and Jennifer Taylor for technical assistance.
Footnotes
Declaration of interest: There is no conflict of interest that could be perceived as prejudicing the impartiality of research reported.
Disclaimer. This is not the definitive version of record of this article. This manuscript has been accepted for publication in Journal of Endocrinology, but the version presented here has not yet been copy edited, formatted or proofed. Consequently, the Society for Endocrinology accepts no responsibility for any errors or omissions it may contain. The definitive version is now freely available at http://dx.doi.org/10.1677/JOE-10-0263.
References
- Alexanderson C, Eriksson E, Stener-Victorin E, Lonn M, Holmang A. Early postnatal oestradiol exposure causes insulin resistance and signs of inflammation in circulation and skeletal muscle. Journal of Endocrinology. 2009;201:49–58. doi: 10.1677/JOE-08-0534. [DOI] [PubMed] [Google Scholar]
- Barzilai N, Banerjee S, Hawkins M, Chen W, Rossetti L. Caloric restriction reverses hepatic insulin resistance in aging rats by decreasing visceral fat. Journal of Clinical Investigation. 1998;101:1353–1361. doi: 10.1172/JCI485. [DOI] [PMC free article] [PubMed] [Google Scholar]
- Bjorntorp P. Adipose tissue distribution and function. International Journal of Obesity. 1991;15(Suppl 2):67–81. [PubMed] [Google Scholar]
- Bruns CM, Baum ST, Colman RJ, Eisner JR, Kemnitz JW, Weindruch R, Abbott DH. Insulin resistance and impaired insulin secretion in prenatally androgenized male rhesus monkeys. Journal of Clinical Endocrinology and Metabolism. 2004;89:6218–6223. doi: 10.1210/jc.2004-0918. [DOI] [PubMed] [Google Scholar]
- Clegg DJ, Brown LM, Woods SC, Benoit SC. Gonadal hormones determine sensitivity to central leptin and insulin. Diabetes. 2006;55:978–987. doi: 10.2337/diabetes.55.04.06.db05-1339. [DOI] [PubMed] [Google Scholar]
- Corbould A, Zhao H, Mirzoeva S, Aird F, Dunaif A. Enhanced mitogenic signaling in skeletal muscle of women with polycystic ovary syndrome. Diabetes. 2006;55:751–759. doi: 10.2337/diabetes.55.03.06.db05-0453. [DOI] [PubMed] [Google Scholar]
- Demissie M, Lazic M, Foecking EM, Aird F, Dunaif A, Levine JE. Transient prenatal androgen exposure produces metabolic syndrome in adult female rats. American Journal of Physiology. Endocrinology and Metabolism. 2008;295:E262–268. doi: 10.1152/ajpendo.90208.2008. [DOI] [PMC free article] [PubMed] [Google Scholar]
- Dieudonne MN, Pecquery R, Boumediene A, Leneveu MC, Giudicelli Y. Androgen receptors in human preadipocytes and adipocytes: regional specificities and regulation by sex steroids. American Journal of Physiology. 1998;274:C1645–1652. doi: 10.1152/ajpcell.1998.274.6.C1645. [DOI] [PubMed] [Google Scholar]
- Dieudonne MN, Pecquery R, Leneveu MC, Giudicelli Y. Opposite effects of androgens and estrogens on adipogenesis in rat preadipocytes: evidence for sex and site-related specificities and possible involvement of insulin-like growth factor 1 receptor and peroxisome proliferator-activated receptor gamma2. Endocrinology. 2000;141:649–656. doi: 10.1210/endo.141.2.7293. [DOI] [PubMed] [Google Scholar]
- Dunaif A. Insulin resistance and the polycystic ovary syndrome: mechanism and implications for pathogenesis. Endocrine Reviews. 1997;18:774–800. doi: 10.1210/edrv.18.6.0318. [DOI] [PubMed] [Google Scholar]
- Ehrmann DA. Polycystic ovary syndrome. New England Journal of Medicine. 2005;352:1223–1236. doi: 10.1056/NEJMra041536. [DOI] [PubMed] [Google Scholar]
- Foecking EM, Levine JE. Effects of experimental hyperandrogenemia on the female rat reproductive axis: suppression of progesterone-receptor messenger RNA expression in the brain and blockade of luteinizing hormone surges. Gender Medicine. 2005;2:155–165. doi: 10.1016/s1550-8579(05)80044-0. [DOI] [PubMed] [Google Scholar]
- Foecking EM, Szabo M, Schwartz NB, Levine JE. Neuroendocrine consequences of prenatal androgen exposure in the female rat: absence of luteinizing hormone surges, suppression of progesterone receptor gene expression, and acceleration of the gonadotropin-releasing hormone pulse generator. Biology of Reproduction. 2005;72:1475–1483. doi: 10.1095/biolreprod.105.039800. [DOI] [PubMed] [Google Scholar]
- Gabriely I, Ma XH, Yang XM, Atzmon G, Rajala MW, Berg AH, Scherer P, Rossetti L, Barzilai N. Removal of visceral fat prevents insulin resistance and glucose intolerance of aging: an adipokine-mediated process? Diabetes. 2002;51:2951–2958. doi: 10.2337/diabetes.51.10.2951. [DOI] [PubMed] [Google Scholar]
- Grover PK, Odell WD. Correlation of in vivo and in vitro activities of some naturally occurring androgens using a radioreceptor assay for 5alpha-dihydrotestosterone with rat prostate cytosol receptor protein. Journal of Steroid Biochemistry. 1975;6:1373–1379. doi: 10.1016/0022-4731(75)90072-2. [DOI] [PubMed] [Google Scholar]
- Jensen BC, Swigart PM, Simpson PC. Ten commercial antibodies for alpha-1-adrenergic receptor subtypes are nonspecific. Naunyn-Schmiedebergs Archives of Pharmacology. 2009;379:409–412. doi: 10.1007/s00210-008-0368-6. [DOI] [PMC free article] [PubMed] [Google Scholar]
- Jocken JW, Blaak EE. Catecholamine-induced lipolysis in adipose tissue and skeletal muscle in obesity. Physiology and Behavior. 2008;94:219–230. doi: 10.1016/j.physbeh.2008.01.002. [DOI] [PubMed] [Google Scholar]
- Lafontan M, Berlan M. Fat cell adrenergic receptors and the control of white and brown fat cell function. Journal of Lipid Research. 1993;34:1057–1091. [PubMed] [Google Scholar]
- Legro RS, Driscoll D, Strauss JF, 3rd, Fox J, Dunaif A. Evidence for a genetic basis for hyperandrogenemia in polycystic ovary syndrome. Proceedings of the National Academy of Sciences U S A. 1998;95:14956–14960. doi: 10.1073/pnas.95.25.14956. [DOI] [PMC free article] [PubMed] [Google Scholar]
- Legro RS, Kunselman AR, Demers L, Wang SC, Bentley-Lewis R, Dunaif A. Elevated dehydroepiandrosterone sulfate levels as the reproductive phenotype in the brothers of women with polycystic ovary syndrome. Journal of Clinical Endocrinology and Metabolism. 2002;87:2134–2138. doi: 10.1210/jcem.87.5.8387. [DOI] [PMC free article] [PubMed] [Google Scholar]
- Lindzey J, Wetsel WC, Couse JF, Stoker T, Cooper R, Korach KS. Effects of castration and chronic steroid treatments on hypothalamic gonadotropin-releasing hormone content and pituitary gonadotropins in male wild-type and estrogen receptor-alpha knockout mice. Endocrinology. 1998;139:4092–4101. doi: 10.1210/endo.139.10.6253. [DOI] [PubMed] [Google Scholar]
- Livak KJ, Schmittgen TD. Analysis of relative gene expression data using real-time quantitative PCR and the 2(−Delta Delta C(T)) Method. Methods. 2001;25:402–408. doi: 10.1006/meth.2001.1262. [DOI] [PubMed] [Google Scholar]
- Lonnqvist F, Thorne A, Large V, Arner P. Sex differences in visceral fat lipolysis and metabolic complications of obesity. Arteriosclerosis, Thrombosis, and Vascular Biology. 1997;17:1472–1480. doi: 10.1161/01.atv.17.7.1472. [DOI] [PubMed] [Google Scholar]
- Maier T, Guell M, Serrano L. Correlation of mRNA and protein in complex biological samples. FEBS Letters. 2009;583:3966–3973. doi: 10.1016/j.febslet.2009.10.036. [DOI] [PubMed] [Google Scholar]
- McGuire JJS, Hollis VW, Jr, Tomkins GM. Some characteristics of the microsomal steroid reductases (5α) of rat liver. Journal of Biological Chemistry. 1960:3112–3117. [Google Scholar]
- Mendelson CR, Kamat A. Mechanisms in the regulation of aromatase in developing ovary and placenta. Journal of Steroid Biochemistry and Molecular Biology. 2007;106:62–70. doi: 10.1016/j.jsbmb.2007.05.001. [DOI] [PMC free article] [PubMed] [Google Scholar]
- Miki H, Yamauchi T, Suzuki R, Komeda K, Tsuchida A, Kubota N, Terauchi Y, Kamon J, Kaburagi Y, Matsui J, et al. Essential role of insulin receptor substrate 1 (IRS-1) and IRS-2 in adipocyte differentiation. Molecular and Cellular Biology. 2001;21:2521–2532. doi: 10.1128/MCB.21.7.2521-2532.2001. [DOI] [PMC free article] [PubMed] [Google Scholar]
- Pak TR, Chung WC, Lund TD, Hinds LR, Clay CM, Handa RJ. The androgen metabolite, 5alpha-androstane-3beta, 17beta-diol, is a potent modulator of estrogen receptor-beta1-mediated gene transcription in neuronal cells. Endocrinology. 2005;146:147–155. doi: 10.1210/en.2004-0871. [DOI] [PubMed] [Google Scholar]
- Recabarren SE, Rojas-Garcia PP, Recabarren MP, Alfaro VH, Smith R, Padmanabhan V, Sir-Petermann T. Prenatal testosterone excess reduces sperm count and motility. Endocrinology. 2008;149:6444–6448. doi: 10.1210/en.2008-0785. [DOI] [PubMed] [Google Scholar]
- Reiling BA, Drackley JK, Grum LR, Berger LL. Effects of prenatal androgenization and lactation on adipose tissue metabolism in finishing single-calf heifers. Journal of Animal Science. 1997;75:1504–1513. doi: 10.2527/1997.7561504x. [DOI] [PubMed] [Google Scholar]
- Ronti T, Lupattelli G, Mannarino E. The endocrine function of adipose tissue: an update. Clinical Endocrinology (Oxf) 2006;64:355–365. doi: 10.1111/j.1365-2265.2006.02474.x. [DOI] [PubMed] [Google Scholar]
- Sam S, Coviello AD, Sung YA, Legro RS, Dunaif A. Metabolic phenotype in the brothers of women with polycystic ovary syndrome. Diabetes Care. 2008;31:1237–1241. doi: 10.2337/dc07-2190. [DOI] [PMC free article] [PubMed] [Google Scholar]
- Sam S, Legro RS, Bentley-Lewis R, Dunaif A. Dyslipidemia and metabolic syndrome in the sisters of women with polycystic ovary syndrome. Journal of Clinical Endocrinology and Metabolism. 2005;90:4797–4802. doi: 10.1210/jc.2004-2217. [DOI] [PMC free article] [PubMed] [Google Scholar]
- Sam S, Legro RS, Essah PA, Apridonidze T, Dunaif A. Evidence for metabolic and reproductive phenotypes in mothers of women with polycystic ovary syndrome. Proceedings of the National Academy of Sciences U S A. 2006;103:7030–7035. doi: 10.1073/pnas.0602025103. [DOI] [PMC free article] [PubMed] [Google Scholar]
- Sundaram SS, Whitington PF, Green RM. Steatohepatitis develops rapidly in transgenic mice overexpressing Abcb11 and fed a methionine-choline-deficient diet. American Journal of Physiology. Gastrointestinal and Liver Physiology. 2005;288:G1321–1327. doi: 10.1152/ajpgi.00455.2004. [DOI] [PubMed] [Google Scholar]
- Urbanek M. The genetics of the polycystic ovary syndrome. Nature Clinical Practice Endocrinology and Metabolism. 2007;3:103–111. doi: 10.1038/ncpendmet0400. [DOI] [PubMed] [Google Scholar]
- Vague J. The degree of masculine differentiation of obesities: a factor determining predisposition to diabetes, atherosclerosis, gout, and uric calculous disease. American Journal of Clinical Nutrition. 1956;4:20–34. doi: 10.1093/ajcn/4.1.20. [DOI] [PubMed] [Google Scholar]
- Weihua Z, Makela S, Andersson LC, Salmi S, Saji S, Webster JI, Jensen EV, Nilsson S, Warner M, Gustafsson JA. A role for estrogen receptor beta in the regulation of growth of the ventral prostate. Proceedings of the National Academy of Sciences U S A. 2001;98:6330–6335. doi: 10.1073/pnas.111150898. [DOI] [PMC free article] [PubMed] [Google Scholar]
- Wolf CJ, Hotchkiss A, Ostby JS, LeBlanc GA, Gray LE., Jr Effects of prenatal testosterone propionate on the sexual development of male and female rats: a dose-response study. Toxicological Sciences. 2002;65:71–86. doi: 10.1093/toxsci/65.1.71. [DOI] [PubMed] [Google Scholar]
- Yildiz BO, Yarali H, Oguz H, Bayraktar M. Glucose intolerance, insulin resistance, and hyperandrogenemia in first degree relatives of women with polycystic ovary syndrome. Journal of Clinical Endocrinology and Metabolism. 2003;88:2031–2036. doi: 10.1210/jc.2002-021499. [DOI] [PubMed] [Google Scholar]
- Yilmaz M, Bukan N, Ersoy R, Karakoc A, Yetkin I, Ayvaz G, Cakir N, Arslan M. Glucose intolerance, insulin resistance and cardiovascular risk factors in first degree relatives of women with polycystic ovary syndrome. Human Reproduction. 2005;20:2414–2420. doi: 10.1093/humrep/dei070. [DOI] [PubMed] [Google Scholar]