

Abstract
There are three main cues to sound location: the interaural differences in time (ITD) and level (ILD) as well as the monaural spectral shape cues. These cues are generated by the spatial- and frequency-dependent filtering of propagating sound waves by the head and external ears. Although the chinchilla has been used for decades to study the anatomy, physiology, and psychophysics of audition, including binaural and spatial hearing, little is actually known about the sound pressure transformations by the head and pinnae and the resulting sound localization cues available to them. Here, we measured the directional transfer functions (DTFs), the directional components of the head-related transfer functions, for 9 adult chinchillas. The resulting localization cues were computed from the DTFs. In the frontal hemisphere, spectral notch cues were present for frequencies from ~6–18 kHz. In general, the frequency corresponding to the notch increased with increases in source elevation as well as in azimuth towards the ipsilateral ear. The ILDs demonstrated a strong correlation with source azimuth and frequency. The maximum ILDs were < 10 dB for frequencies < 5 kHz, and ranged from 10–30 dB for the frequencies > 5 kHz. The maximum ITDs were dependent on frequency, yielding 236 μs at 4 kHz and 336 μs at 250 Hz. Removal of the pinnae eliminated the spectral notch cues, reduced the acoustic gain and the ILDs, altered the acoustic axis, and reduced the ITDs.
Keywords: sound localization, interaural time difference, interaural level difference, head related transfer function, directional transfer functions
I. Introduction
Propagating sound waves are filtered by the head and external ears to produce the spatial and frequency dependent acoustical cues for sound source localization. The linear dimensions of the head and pinna are critical factors in determining the magnitude and frequency ranges of the resulting cues (Tollin and Koka, 2009a,b). There are three main cues to sound location: interaural time (ITDs) and level (ILDs) differences and monaural spectral shape cues (Tollin, 2003). ITDs are defined as the difference in time it takes a sound to reach the two ears, with the difference being created because the sound reaches the ear closest to the source sooner than it reaches the far ear (Kuhn, 1977). ILDs are the differences in sound pressure level (SPL) that result from amplification at the ear closest to the source and attenuation at the far ear, with the head creating an “acoustic shadow”. These cues are primarily responsible for localizing sounds in azimuth (horizontal plane). Finally, monaural spectral shape cues arise from the differential reflection and diffraction of pressure waveforms from sound originating from different directions by the head, torso and the pinnae. Spectral cues are believed to mediate localization of sounds in elevation as well as discriminating sources in the frontal hemisphere from those behind (Heffner et al., 1996; Tollin and Yin, 2003).
Physiological studies of the neural mechanisms of sound localization have suggested that there can be considerable differences (Kelly, 1980) and similarities (Brand et al., 2002; McAlpine and Grothe, 2003) in the neural processing of sound localization cues among different species, making cross species generalizations difficult. However, these differences might be reconciled by studying the sound localization mechanisms of different species and taking into consideration the sound localization cues that are actually available for each particular species. Towards this goal, there has been considerable study of the cues in several species, including human (Wightman and Kistler, 1989; Middlebrooks et al., 1989; Middlebrooks and Green, 1990), cat (Moore and Irvine, 1979; Roth et al., 1980; Phillips et al., 1982; Irvine, 1987; Musicant et al., 1990; Rice et al., 1992; Tollin and Koka, 2009a,b), monkey (Spezio et al., 2000; Slee and Young, 2010), ferret (Carlile, 1990; Schnupp et al., 2003), tammar wallaby (Coles and Guppy,1986), various species of bat (Jen and Chen, 1988; Obrist et al., 1993; Fuzessery, 1996; Firzlaff and Schuller, 2003; Aytekin et al., 2004), guinea pig (Carlile and Pettigrew, 1987; Sterbing et al., 2003), gerbil (Maki and Furukawa, 2005), mouse (Chen et al., 1995), rat (Harrison and Downey, 1970; Koka et al., 2008) and barn owl (Moiseff, 1989; Keller et al., 1998). Unfortunately, for some common species that have been used to study the anatomy, physiology and psychophysics of sound localization, the cues to location have not been measured.
Here we extend these studies to include the chinchilla (Chinchilla lanigera). Chinchillas have been a model system for the behavior (Heffner et al., 1994, Heffner et al., 1995, Heffner et al., 1996), anatomy (Ruggero and Rich, 1983; Morest et al., 1997), physiology (Benson and Teas, 1976; Finalyson and Caspary, 1989, 1991; Langford, 1984; Nuding et al., 1999), and development (Pienkowski and Harrison, 2004; McFadden et al., 1998) of the auditory system, including sound localization mechanisms. Chinchillas are also common models for studying cochlear and middle ear mechanics (Songer and Rosowski 2006; Ruggero and Temchin, 2002; Koka et al., 2010). However, aside from unpublished results (Von Bismark, 1967; Von Bismark and Pfeiffer, 1967), little is known about the localization cues available to the chinchilla. To fill this void, we measured the directional transfer functions (DTFs) (Middlebrooks and Green, 1990), the directional components of the head-related transfer functions (HRTFs), for adult chinchillas. From the DTFs, the primary acoustical cues to location were computed and examined, including the broadband spectral “notche” (Rice et al., 1992) along with gain and acoustic axis, ITDs, and the spatial- and frequency-dependence of the ILD cues. Finally, the role of the pinna in generating these cues was examined by repeating the acoustical measurements after surgical removal of the pinna.
II. Methodology
A. Animal preparation
Nine adult chinchillas obtained from a vendor (Moulton Chinchilla Ranch, MN) were used in this study. All surgical and experimental procedures complied with the guidelines of the University of Colorado Health Science Center Animal Care and Use Committees and the National Institutes of Health. Chinchillas were initially anesthetized with an intramuscular (IM) dose of ketamine (30 mg/kg) and xylazine (5 mg/kg) and kept in areflexia with supplemental doses of ketamine (15 mg/kg) and xylazine (2.5 mg/kg). The weight, head diameter and pinna height and width (Figure 1A, B) of each animal were measured. The acoustic measurement procedure detailed below lasted approximately 1.5–2 hours during which the animals were kept under anesthesia.
Figure 1.

Head and pinnae dimensions of the adult chinchilla. In 9 animals, the average head diameter (AB) was 35.5 ±1.4 mm (Panel A), the average pinna width (CD) was 27.8 ±2.4 mm, and the average pinna length (EF) was 50 ±2.9 mm (Panel B). (C) Illustration of the placement of probe tube microphones in the lateral bony portion of the auditory canal. (Figure 1C is modified from Figure 1 of Koka et al., 2010).
After measuring the linear dimensions of the head and pinna (Figure 1A, B), the tip of a 50-mm long flexible silicone probe tube (Bruel and Kjaer, part # AF-0555, 1.65 mm outer diameter) was inserted into the ear canal by drilling a small hole in the lateral bony portion of the auditory canal without disturbing the musculature of the pinna (Figure 1C). This approach was similar to the surgical approach described by Von Bismark (1967). The tip of the microphone was placed < 2 mm from the tympanic membrane under otoscopic visualization. The animal was then placed in the center of a sound-attenuating chamber (see below), with its interaural axis aligned in the arc of loudspeakers using three lasers, two at the poles and one at (0°,0°). After taking the first set of acoustic measurements, the pinnae of three animals were removed to observe the properties of the DTFs and cues to location without the pinna. Removal of the pinnae did not alter the position of the probe tube in the ear canal or the position of the subject in the center of chamber.
B. Experimental setup
The experimental setup and procedure used was similar to that described in Koka et al. (2008) and Tollin and Koka et al. (2009a,b). All experiments were performed in a ~3x3x3 m (interior dimensions) double-walled, sound-attenuating room (IAC, Bronx, NY). Stimuli were presented from 25 loudspeakers (Morel MDT-20) attached to a custom-built horizontally oriented [i.e., “single-pole” coordinate system (Middlebrooks and Pettigrew, 1981; Leong and Carlile, 1998)] semicircular boom with radius of 1 m. The 25 loudspeakers were spaced in azimuth along the boom at 7.5° apart, from −90° (left) to +90° (right). The axis of rotation of the boom was aligned with the interaural axis of the animal (i.e., through the ears). DTFs were recorded from a total of 527 different locations, covering azimuth (+90° to -90°) and elevation (-45° low elevations in the frontal hemisphere, to +180° exactly behind the animal).
The acoustic measurement stimuli consisted of 11th order maximum length sequences (MLS) (Rife and Vanderkooy, 1989) repeated without interruption 128 times from each loudspeaker. The MLS stimuli were presented at full 24-bit resolution at a rate of 97656.25 Hz (Tucker-Davis Technologies, RP2.1, TDT, Alachua, FL). The resulting acoustic waveforms in the ear canals of the left and right ears (see Figure 1C) were simultaneously recorded through two probe tube microphones (Bruel and Kjaer, Type-4182), amplified, and collected using two analog to digital converter channels sampling at 97656.25 Hz (TDT RP2.1) and stored on a PC hard disk for later processing. An acoustic calibration measurement was also made in the absence of the animal to capture the spectral characteristics of the loudspeakers and microphones.
C. Data processing and data analysis
The impulse responses for each ear and each location were calculated by circular cross-correlation of the original 11th order MLS stimulus and the in-ear recording from the probe tube microphone (Rife and Vanderkooy, 1989). The impulse responses were then truncated to 512 (5.24 ms) points by a Hanning window where the center of the window was set to coincide approximately with the point of maximum amplitude in the impulse response. This windowing procedure removes the small-amplitude reflections that may be contained in the impulse response which may be on the order of 7 ms (for 1 m distance) after the maximum amplitude.
Next, the HRTFs were derived by dividing the frequency response of the in-ear recording by that of the appropriate loudspeaker calibration measurement. This procedure removes the loudspeaker and microphone frequency response from each in-ear measurement. The resulting function is referred to as the HRTF, as it represents the acoustical gain and delay introduced by the head and the pinnae. However, the resulting HRTF can be highly dependent on the exact placement of the tip of the probe tube microphone in the ear canal relative to the tympanic membrane (Middlebrooks et al., 1989). To reduce the confounding effects of the probe tube placement in the ear canal, DTFs for each ear were calculated from the HRTFs by dividing the HRTF made at each spatial location by the geometrical mean of all the measured HRTFs across all measurement locations for that ear. The spectral features resulting from the exact placement of the probe tube microphone in the ear canal are expected to be similar for all measurement locations (i.e., they are not dependent on spatial location), so this “common” spectral feature is removed from the HRTFs, resulting in the DTFs (Middlebrooks and Green, 1990). In essence, the DTFs are the sound source direction-dependent components of HRTFs.
Finally, the amplitude spectra of the DTFs were calculated using a 512-point fast Fourier transform (FFT) after the spectra were passed through a bank of band pass filters that simulate the effects of auditory peripheral filtering. The filter bank consisted of 500 Butterworth filters, with the center frequencies spaced at intervals of 0.0143 octaves spanning from 0.25–32 kHz. The 3 dB bandwidth of filters was held constant across all frequencies at 0.0571 octaves, and the upper and lower slopes of the filters fell off at ~105 dB/octave. These filters have properties similar to the bank of triangular band pass filters described in the literature (Xu and Middlebrooks, 2000; Schnupp et al., 2003).
For spatial plotting purposes, the data were displayed as Aitov projections (Bugayevskiy and Snyder. 1995). In this projection, the nose of the animal is considered to be projecting out of the page at 0º azimuth and 0º elevation, as if the animal were looking at the reader. The spatial plots were plotted for frontal data for elevations from −45º to +90º and azimuth from +90º to −90º.
III. RESULTS
The results are based on DTF measurements from nine adult male chinchillas. The across-animal mean weight, head diameter, and the length and width of the pinnae for the chinchillas were 670 ±114 g, 35.0 ±1.4 mm (AB), 50.0 ±2.9 mm (EF) and 27.8 ±2.4 mm (CD), respectively (head and pinnae dimensions are shown in Fig. 1A-B). For each animal, the linear dimensions of the left and right pinna were virtually the same. Weight as well as head and pinnae dimensions were also measured in 55 additional adult animals that were used for other ongoing physiological experiments in the laboratory. For these animals, the mean weight, head diameter, and the length and width of the pinnae were 567 ± 110 g, 35.5 ±1.8 mm (AB), 49.8 ±3.5 mm (EF), 28.1 ±3.2 mm (CD) respectively. Thus, our small sample of 9 animals for the acoustical measurements is expected to be representative of the population of adult chinchillas.
A. Monaural spectral aspects of the DTFs
1. Frequency range and spatial-location dependence of broadband spectral notches
Systematic changes were observed in the frequency and spectral depth (in dB) of the first broadband spectral notch, or first notch (FN) frequency (Rice et al., 1992), with changes in source location azimuth and elevation (Figure 2A,B). Figure 2A shows the DTFs for the right ear of one animal (CH07027) for elevations ranging from −22.5º to 22.5º in 7.5º steps for 0º azimuth and Figure 2B shows the DTFs for azimuths ranging from +22.5º (ipsilateral to source) to −22.5º (contralateral to source) in 7.5º steps for 0º elevation (CH07027). Prominent broadband spectral notches were observed for frequencies above 6 kHz in all animals. We also observed that the low-frequency “edge” of the FN changed with source location, particularly for changes in sound source azimuth (Figure 2B). Similar changes in the low-frequency slope, or edge, of the FNs have been observed in acoustic measurements in humans by Shaw (1982). At a given sound source azimuth, the FN frequencies generally increased with increasing source elevation (Figure 2A). The FN frequency also tended to increase as source azimuth moved into the hemisphere on the side of the ipsilateral ear at a given elevation (Figure 2B). Generally, the FN frequency was easily detectable and moved systematically with changes in source azimuth and elevation for most sources in the frontal hemisphere. However, the notch was difficult to detect or moved erratically with source locations above and behind the animals. Across the population of adult chinchillas tested, the notches tended to increase from ~6 to 18 kHz as the source increased in elevation from −45º to 90º. The notches also increased from ~6 to 18 kHz as the source moved from ~−30º to +90º (i.e., towards the ipsilateral ear) in azimuth.
Figure 2.

Monaural broadband spectral shape cues. Plots of DTF gain for the right ear of one animal (CH07027) for elevations ranging from −22.5º to 22.5º in 7.5º steps for 0º azimuth (A) and for azimuths ranging from −22.5º to 22.5º in 7.5º steps for 0º elevation (B). The first spectral notch can be seen for frequencies ranging from ~6–10 kHz for these source locations. Plots of DTF gain for the same animal, but after the pinnae had been removed, for elevations ranging from −22.5º to 22.5º in 7.5º steps for 0º azimuth (C) and azimuths ranging from −22.5º to 22.5º in 7.5º steps for 0º elevation (D). Removal of the pinnae eliminates the deep spectral notch cues.
2. The role of the pinna in generating the broadband spectral notch
To demonstrate that the pinnae create the notches, the pinnae were surgically removed and the acoustic measurements repeated in 3 animals. Figures 2C and D show the effect of the pinnae on the broadband spectral notches. The data demonstrate that pinnae removal eliminated the broadband spectral notch feature from the DTFs for source changes in both elevation (Figure 2C) and azimuth (Figure 2D). In all cases removal of the pinnae eliminated both the spectral notch cues as well as the broad increase in acoustical gain observed at frequencies below and above the FN frequency. These data support the hypothesis that the broadband spectral notches occurring from ~6–18 kHz in chinchillas are produced exclusively by the pinna.
3. Spatial distribution of DTF amplitude gain
The DTF gain at a given frequency varies with source direction. Figure 3 shows the distribution of DTF gain for 2, 4, 8, 10, 12, 16 and 20 kHz for sources in the frontal (left column: head+pinna condition) hemisphere for the right ear (i.e., +90° is ipsilateral) of one animal (CH07030). Here the DTF gain is plotted only for the right ear as it was nearly mirror symmetric with that of left the ear in most of the animals. The amplitude gain generally contained complex and non-systematic peaks and dips for sources behind the animal, so these sources were not considered further. Moreover, in the frontal hemisphere the DTF gains for frequencies above ~16 kHz also exhibited multiple peaks and notches. The gains were also complex for the frequencies corresponding to the first spectral notch (~6–18 kHz), which is particularly apparent in the plots of DTF gains for frequencies of 8, 10 and 12 kHz. The maximum DTF gains observed for all animals tended to increase as a function of frequency up to ~10–12 kHz, and were approximately constant at 12–15 dB above these frequencies. The frequency-dependent maximum DTF gains for the data shown in Figure 3 are given on the left side of each panel. For frequencies higher than ~ 16 kHz, there were often two or more distinct regions of high gain, as illustrated in Figure 3 (left column) for 20 kHz.
Figure 3.

Spatial distribution of DTF gains for seven frequencies for the right ear (+90°, ipsilateral) of one animal (CH07030) for three different conditions: intact animal with head and pinna (“head+pinna”), head only after the pinna were removed (“head only”), and the contribution of the pinna (“pinna only”), which was computed as the difference of the “head+pinna” and “head only” measurements. The color bar indicates the gain in decibels.
A large, non-directional gain associated with the resonance frequency of the ear canal and concha was estimated from the common components of the HRTFs (see Methods). The common components of the HRTFs averaged across animals revealed a peak in the gain of 13 ±2.9 dB (n = 9 animals) occurring quite consistently across animals at ~2.7 kHz. This frequency and overall gain of the ear canal/concha resonance that we observed here was virtually the same as that in the data from Von Bismark‘s thesis (1967) as well as the acoustic and electrophysiological measurements from Murphy and Davis (1998).
4. Spatial directivity: the spatial and frequency dependence of the 3-dB acceptance angle and the acoustic axis
The spatial location of the DTF gain maximum and minimum varied as a function of frequency. The direction of maximum acoustical gain at a given frequency in the DTF gain spectra is known as the acoustic axis (Middlebrooks and Pettigrew, 1981; Phillips et al., 1982). To examine the acoustic axis of the chinchilla, the spatial gain data were first normalized with the maximum of the DTF at the acoustic axis; thus, all gains were expressed as attenuation re: the maximum gain. We hypothesized that for a given frequency the solid area enclosed by the -3 dB contour should depend on the linear dimensions of the external ear. To test this hypothesis, the equation calculating the frequency-dependence of the solid angle for a -3 dB contour for acoustic diffraction through a circular aperture for a given aperture diameter [equation derived in Calford and Pettigrew (1984) and Coles and Guppy (1986); see also Tollin and Koka (2009a)] was fitted to the acoustical data (e.g., Figure 4) for 5 animals (the other 4 animals were excluded because we only sparsely sampled spatial locations in the rear hemisphere in those animals). In the fitting, the aperture diameter was the only free parameter (MATLAB ver 7.1 robust nonlinear least squares, Trust-region method). The empirical data at lower frequencies were poorly fit by the model, so only data for solid angles < ~0.5° (in units of steradians) were used for the fitting which resulted in frequencies > ~5 kHz although all empirical data are shown in Figure 4. The predicted diameter of the circular aperture for these 5 animals was 37.2, 38.5, 39.5, 41.5 and 42.7 mm, respectively (R2 for the fits were 0.83, 0.72, 0.91, 0.93 and 0.88, respectively); the fitted functions are shown in Figure 4 for 3 representative pinna sizes. The data indicate that the predicted pinnae aperture necessary to describe the empirical acoustical data was generally smaller than the empirically-measured dimensions of the pinnae.
Figure 4.

Solid angle area (in units of π sr) enclosed by the −3 dB contour from the DTF gain plots (Figure 4) for 5 animals. Lines indicate the circular aperture model (see text) predicted dependence of the solid angle area on sound frequency for three different aperture diameters (i.e., effective pinnae diameters); these three aperture diameters (30, 40 and 50 mm) bracket the empirically measured pinnae sizes for the 5 animals shown (each symbol corresponds to data from a different animal).
The acoustic axis for each animal varied systematically as a function of frequency only over small ranges of frequencies (Figure 5; see below), but often made sudden and spatially-distant jumps from one location to another. As noted earlier, for high frequencies there were often two or more spatial locations with high gain separated by regions of low gain. These latter low-gain regions were often associated with the first spectral notch frequencies. Figure 5 shows the movement of the acoustic axis in elevation (panel A) and azimuth (panel B) for 5 animals. Two general patterns emerged upon examination of the acoustic axis. First, the acoustic axis tended to move from lower to higher elevations with increases in frequency, but was interrupted by transitions to lower elevations. The acoustic axis in elevation increased from 0° to 50° for frequencies from 2 to ~10 kHz, shifted back down to 0° by ~16 kHz, and again increased to an elevation of +50° or more by 20 kHz. Above 20 kHz the changes in the elevation component of the acoustic axis were complicated and showed considerable across-animal differences. The location of the acoustic axis in azimuth revealed patterns that tended to move from medial to lateral locations interspersed by discrete jumps back toward the midline. For example, the azimuth of the acoustic axis began at ~0°–10° at 2 kHz, moved to +40° (towards the ipsilateral ear) by 8–10 kHz, then transitioned back toward the midline from ~10–16 kHz in most animals.
Figure 5.

The elevation (panel A) and azimuth (panel B) corresponding to the acoustic axis as a function of frequency in five animals; each symbol indicates data from a different animal. The acoustic axis is the spatial location corresponding to the maximum DTF gain (Figure 3) at a particular frequency.
5. The contribution of the pinna to acoustical gain and the acoustic axis
In this section the importance of the pinna in shaping the DTF gain and acoustic axis was studied. Figure 3 also shows spatial plots of the DTF gain recorded for one animal (CH07030) before and after both pinna were completely removed. Figure 3 shows DTF gain at 7 frequencies for three conditions: the original intact measurements (“head + pinna”), measurements after pinna removal (“head only”), and the difference between the intact and pinna-removed measurements (“pinna only”) for the right ear (+90° is ipsilateral). Removal of the pinna indicated that the pinna contribute to the DTF gain significantly only at high frequencies above 8 kHz. Below 8 kHz, the acoustical gain for most frequencies produced exclusively by the pinna was generally small, < 2 dB.
The pinnae also produced substantial attenuation for some frequencies (typically > ~8 kHz) and locations, where removal of the pinna eliminated the spectral notch cues. The pinna also contributed to the location of the acoustic axis (not shown). Examination of the “head only” condition showed that the gain produced by the head, likely due to the so-called obstacle effect of the head (Kinsler et al., 1982), was largely symmetrical about the midsagittal plane and tended to increase monotonically as source location moved in azimuth from contralateral (−90°) to ipsilateral (+90°). That is, the “head only” acoustical axes tended to cluster at or near sources of ~90° towards the ipsilateral ear. The acoustic axis with the pinna present did not obey this symmetry, suggesting that the acoustic directivity of the pinna at high frequencies largely determines the acoustic axis (see Figure 3).
B. Binaural Acoustical Cues: Interaural level differences (ILDs)
1. Variation of ILD with frequency
The difference between left and right ear DTF gains results in the ILD spectra. The ILD corresponding to any particular frequency can be determined directly from the ILD spectra. Our results show, as expected, that the ILD cues vary with frequency and source location. Positive and negative ILDs indicate higher DTF gain for right and left ears, respectively. Figure 6A shows the ILDs for one animal (CH07027) at 5 different elevations when the azimuth was fixed at 0º and 6B shows the ILD for same locations when the pinnae were removed. As expected, ILDs varied with changes in source azimuth and frequency, and not with changes in source elevation. The positive and negative peaks moved systematically to higher frequencies with changing azimuth angle and constant elevation, consistent with the movements of the first notch frequencies. Also, as a function of azimuth, ILDs are small, on the order of a few dB for low frequencies, and become systematically larger for frequencies up to ~ 8 kHz. For frequencies from ~6–18 kHz, the spectral notches created by the pinnae that are present primarily in the contralateral ear (farthest from the source) help to create very large ILDs approaching 30 dB or more for some frequencies. The role of the pinnae in producing the large ILDs at these frequencies is explored below.
Figure 6.

(A) The ILD spectrum for one animal (CH07027). The ILD spectrum is the frequency-by-frequency difference between left- and right-ear DTFs at a given location. Positive ILD indicates higher gain at the left ear than the right ear. ILDs do not change much with changes in source elevation along the midsagittal plane (A), but change substantially with source azimuth along the horizontal plane (C). After both pinnae were removed, the ILD spectrum is similar for sources along the midsagittal plane (B), but ILDs are markedly reduced for sources varying along the horizontal plane (D). (E) The ILD-azimuth slope (dB/deg) for sources ±30° about the midline. The mean (thick black line) ILD-azimuth slope and associated 95% confidence interval (grey shaded area) is shown for 9 animals. The light grey line indicates the slope of the ILD based on the spherical head model of Duda and Martens (1998) with an adult head diameter as input.
2. ILD slope
In addition to the magnitudes and frequency ranges of the ILD cues, another important attribute is the frequency-dependent rate of change of the ILD cues with changes in source azimuth, or the ILD-azimuth slope (in units of dB/deg). The rate of change of binaural cues such as ILD is an important determinant of spatial acuity, as typically assessed by behavioral measurement of the minimum audible angle (see Heffner et al., 1994). Figure 6E shows the mean ILD vs. source azimuth slope (dB/deg) measured for all animals. The ILD slope was calculated by subtracting the ILD at −15° azimuth from the ILD at +15°, and dividing it by 30°. The across-animal mean ILD slope increased with frequency; the measured ILD slope was 0.1 dB/deg at 2 kHz and increased up to 0.4 dB/deg by 11 kHz and then decreased to 0.1 dB/deg by 30 kHz. The large across-animal variation in ILD slope near 10 kHz was due to the spectral notch contributions of the contralateral pinnae, which in many animals produced negative ILDs (i.e., ILDs that were opposite in sign than expected). In some animals, the ILD slope approached 0.6 dB/deg for frequencies around 10 kHz.
3. Spatial distribution of ILD at various frequencies
The ILD cue, similar to the DTF gain, is a complex function of azimuth, elevation, and frequency. Figure 7 shows the distribution of ILD cues for 2, 4, 8, 10, 12, 16 and 20 kHz for sources in the frontal hemisphere (left column: head + pinna condition) by subtracting the left ear DTF from the right ear (i.e., +90° is ipsilateral) of one animal (CH07030). The ILDs were, in general, symmetrical between the right and left hemispheres for frequencies up to ~8 kHz, but were more complex for higher frequencies. This is due, in part, to the role of the pinna, which generates the spectral notches and contributes to the DTF gain and location of the acoustic axis. In particular, for the frequency ranges of the prominent first notches (~6–18 kHz), the spatial distribution of ILDs can be quite complex. Like the acoustic axis, the spatial location of the maximum ILD was dependent on frequency.
Figure 7.

Spatial distribution of ILD for seven frequencies for the right ear (+90° is ipsilateral) of one animal (CH07030) for three different conditions: intact animal with head and pinna (“head+pinna”), head only after the pinna were removed (“head only”), and the contribution of the pinna (“pinna only”) which was computed as the difference of the “head+pinna” and “head only” measurements. The color bar indicates the ILD in decibels.
4. The contributions of the pinna to the ILD cues
The importance of the pinna in generating acoustical gain and ILD cues was examined by computing the spatial distributions of ILDs before and after pinna removal. Figure 7 also shows the spatial distributions of ILDs recorded for one animal (CH07030) before and after both pinna were completely removed. Figure 7 shows the DTF gains for frontal hemisphere sources at 7 frequencies for three conditions; the original intact measurements (“head + pinna”), measurements after pinna removal (“head only”), and the difference between the intact and pinna-removed measurements (“pinna only”) for the right ear (+90° is ipsilateral). The ILDs with “head + pinna” condition were symmetrical up to ~8 kHz and became complicated above 8 kHz where spectral notches come into play. However, when ILDs were computed for the “head only” condition, the ILD cues were mostly symmetric up to 16 kHz. The “pinna-only” ILD contribution generally occurred for frequencies above ~8 kHz.
The data in Figures 6C and D also illustrate the importance of the pinnae in producing the large ILD values at the frequencies corresponding to the first spectral notches. Figure 6D demonstrates that removal of the pinnae partially eliminates the large 30–40 dB ILDs at frequencies near 8–10 kHz (Figure 6C). These data show that the pinnae produce an additional 10–20 dB above the ILDs created exclusively by the head (Figure 6D). Finally, the solid line in Figure 6E shows the ILD vs. azimuth slope predicted by the spherical head model of Duda and Martens (1998) using an adult chinchilla head diameter (36 mm). The largest discrepancies between the model and the empirical ILD slopes occurred for frequencies between 6–20 kHz, precisely those frequencies where we have demonstrated that the pinnae of the chinchilla produce both the deep spectral notches (Figure 2) and the increased ILDs (Figures 6C and D and Figure 7).
C. Binaural Acoustical Cues: Interaural time difference (ITD)
1. Spatial distribution of ITD
The low frequency ongoing ITDs were calculated as described above in the methods. In short, the left and right ear impulse responses at each location were low-pass filtered (3.5 kHz cutoff), cross-correlated, and the ITD was taken as the delay corresponding to the maximum in the correlation function. The ITD cue was dependent mostly on azimuth. Positive and negative ITD values indicate that sound was leading at the left ear and right ear, respectively. Figure 8 (panel A) show spatial distribution of the frontal and posterior hemisphere ITDs for one animal (CH07030). The ITD was symmetrical about the midline. The same trend was observed for the other 8 animals. Across the 9 animals in this study, the maximum ITD, which always occurred at the poles, averaged 248 μs ± 15 μs. Examination of the spatial dependence of ITDs in Figure 8 (panel A) shows that low frequency based ITDs essentially follow the contours of azimuth and show little or no dependence on elevation.
Figure 8.
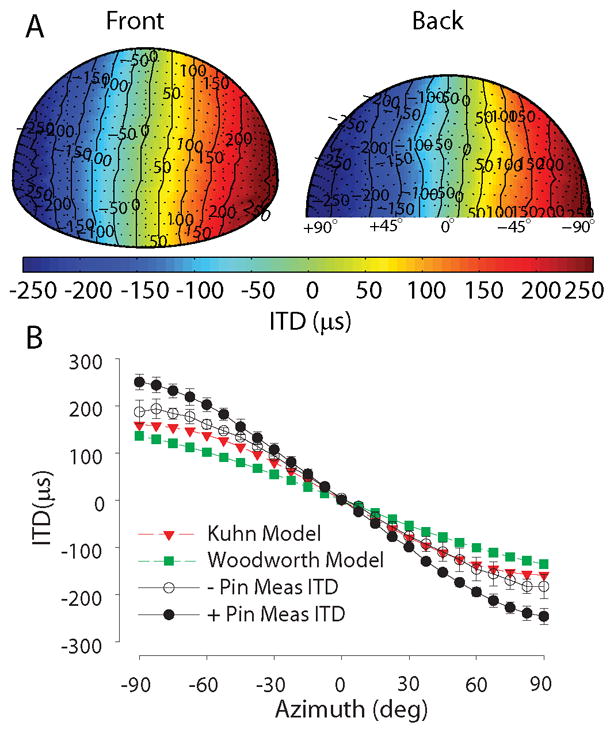
(A) Spatial distribution of low frequency ITDs for one animal (CH07028) for locations in the frontal (left) and posterior (right) hemispheres. Positive ITDs indicate that the signal leads to the left ear. (B) The across-animal mean low frequency ITDs as a function of azimuth along the horizontal plane in two conditions: intact animal with pinnae (filled circle symbols, +pin, n = 9 animals) and after removal of both pinnae (open circle symbols, pin, n = 3 animals). The predicted ITDs based on an adult head diameter are also shown (closed squares, Woodworth (1938) model; closed triangles, Kuhn (1977) low–frequency ITD model).
2. ITD Slope
As with ILD above, one important characteristic of the ITD cue as it pertains to psychophysical sound location acuity is the rate of change of the ITD cue with changes in source azimuth, the ITD-azimuth slope (in units of μs/deg). The ITD-azimuth slopes (μs/deg) were calculated for the linear part of the ITD vs. azimuth curve in between +15° to -15°. These measurements are useful in the interpretation of behavioral studies with chinchillas, for example, in understanding localization acuity using the minimal audible angle (MAA; Heffner et al., 1994). The across-animal mean low-frequency ITD slope for the adult chinchillas studied here was 3.5 ± 0.18 μs/deg.
3. Frequency-dependence of ITDs
Measurements in humans and modeling by Kuhn (1977) suggest that low-frequency ITDs should be ~1.5 times larger than high-frequency ITDs. Figure 9 shows the low frequency ITDs measured with the methods described in Roth et al. (1980) for tone-burst stimuli ranging from 250 Hz to 4 kHz in one adult chinchilla. The maximum ITDs were dependent on frequency, with 236 μs for a 4 kHz stimulus and 336 μs at 250 Hz. The maximum ITDs for low-frequency stimuli were found to be larger than the ITDs for high-frequency stimuli by a factor of 1.43. Similar results were found in 4 additional animals. The maximum low-frequency (250 Hz) ITDs of 336 μs were 2.5 times larger than the 136.1 μs maximum ITD predicted by the Woodworth spherical head model and 2.1 times larger than the 158.8 μs ITD predicted by the low-frequency Kuhn model (both with at 36 mm head diameter).
Figure 9.

The low-frequency ITDs as a function of azimuth along the horizontal plane measured with short-duration pure-tone stimuli for a single animal (CH07044). The predicted ITDs based on an adult head diameter are also shown (closed squares, Woodworth (1938) model; closed triangles, Kuhn (1977) low–frequency ITD model).
4. Pinna contribution to low frequency ITDs
It is often believed that the pinna do not play a large part in determining the ITD cue to sound location, particularly for low-frequency ongoing ITDs (e.g., Roth et al., 1980). For the low-frequency ITD cues measured here, however, we hypothesized that the pinnae of the chinchilla, which are quite large compared to the size of the head, do play a role. To test this hypothesis, for three animals, both pinnae were removed completely and ITDs were remeasured. Figure 8 (panel B) shows the across-animal mean ITDs measured with (filled circle symbols, n=9) and without the pinna (open circle symbol, n=3) for sources varying in azimuth at 0º elevation. The across-animal mean maximum ITDs were substantially reduced from 248 μs down to 186 μs after removing the pinna. Note that, as described earlier, the position of the probe tube microphone was not altered in any way by removing the pinna due to its deep placement in the ear canal (see Figure 1C). Thus, removal of the pinna in chinchilla reduced the ITDs by 25% to a value within 17% of the low-frequency ITD Kuhn model predictions. Figure 8 (panel B) also shows the ITDs predicted by two commonly-used spherical head models, the low-frequency Kuhn model (open triangles; Kuhn 1977) and the classic Woodworth model (closed squares; Woodworth, 1938). The empirically-measured ITDs were significantly larger (p < 0.0001, Woodworth predictions vs. empirical measurements; p = 0.0002, Kuhn predictions vs empirical measurements) than the spherical-head model based ITDs. Thus, for low-frequency ITD cues, we conclude that the pinnae effectively increase the functional diameter of the head, thereby increasing the magnitude of the ITD by ~25%.
IV. Discussion
A. Monaural aspects of the acoustical cues: spectral notches, gain, and acoustic axis
The spectral notch cues were found to be present in the chinchilla primarily for source locations in the frontal hemisphere. In general, the first notch frequencies increased from ~6 to 18 kHz as sound source location varied from low elevations and contralateral azimuths to high elevations and ipsilateral azimuths. These same frequency ranges of first spectral notches can be found in the data (i.e., figures of HRTFs for select source locations) of Von Bismark‘s thesis (1967) and Murphy and Davis (1998), although neither of those studies explicitly mentions spectral notch cues. Since the original descriptions of spectral notch frequency changes with source elevation in human by Shaw and Teranishi (1968), similar patterns of first notch frequency changes with source azimuth and elevation changes have been observed in other species, albeit at different rates and over different frequency ranges (Rhesus monkey, 5–15 kHz: Spezio et al., 2000; human, 6–12 kHz: Middlebrooks, 1999; cat, 8–18 kHz: Musicant et al., 1990; Rice et al., 1992; Young et al., 1996; Xu and Middlebrooks, 2000; Tollin and Koka, 2009a; bat 30–50 kHz: Wotton et al., 1995; Fuzessery, 1996; Firzlaff and Schuller, 2003; Aytekin et al., 2004; Rats, 16–30 kHz: Koka et al., 2008).
The only animal of comparable head and pinna size to the chinchilla for which DTFs have been measured in detail is the cat. In the cat, which has virtually the same pinna size but a larger head size than the chinchilla, spectral notch cues have also been observed over a frequency range of ~8–18 kHz (Musicant et al., 1990; Rice et al., 1992; Xu and Middlebrooks, 2000; Tollin and Koka, 2009a). The linear dimensions of the pinna appear to determine the frequency range for spectral notches. Species with larger pinna (human, cat and monkey cited above) produce notches at lower frequencies than species with smaller pinnae (rat, gerbil and bat). For example, the rat (Koka et al., 2008) and gerbil (Maki and Furukawa, 2005) have pinnae height dimensions of ~17 mm and ~12 mm, respectively while the cat (Tollin and Koka, 2009a) and chinchilla have pinnae heights of ~50 mm, factors of 2.9 and 4.2 larger, respectively. Consistent with the smaller pinnae dimensions, rats and gerbils have 2 to 4 times higher spectral notch frequencies [rat: 16–30 kHz (Koka et al., 2008); gerbil: 25–45 kHz (Maki and Furukawa, 2005)] compared to ~6–18 kHz in both cat (Tollin and Koka 2009a) and chinchilla. Finally, recent studies have shown that the marmoset monkey has pinnae dimensions of ~27 mm, which are larger than rat, and has first notch frequency spectral cues ranging from 12–26 kHz (Slee and Young, 2010), which are lower than rat spectral notch frequency range. Moreover, developmentally, the increasing pinnae size in growing kittens leads to systematic and predictable decreases in the ranges of first notch frequencies (Tollin and Koka, 2009a).
The acoustic axis is the spatial direction for each frequency that produces the largest gain in the DTF relative to all other directions (Middlebrooks and Pettigrew, 1981; Phillips et al., 1982). In the chinchilla, the acoustic axis changed from lower to higher elevations as the source frequency increased from 1 kHz to 32 kHz. The change in elevation observed here is similar to other animals (cats: Musicant et al., 1990; Tollin and Koka, 2009a; ferrets: Carlile, 1990; bats: Firzlaff and Schuller, 2003). In some animals, for frequencies higher than ~20 kHz there were sometimes two or more distinct spatial locations associated with high gain. This observation is consistent with the splitting of the acoustic axis for frequencies above 8 kHz in humans (Middlebrooks et al., 1989), above ~20 kHz in the rat (Koka et al., 2008), and above 55 kHz in bats (Firzlaff and Schuller, 2003). Comparable observations on the complexities of the acoustic axis have been reported in other species, but over different frequency ranges (cat: Musicant et al., 1990; Phillips et al., 1982; Middlebrooks and Knudsen, 1987; Martin and Webster, 1989; Calford and Pettigrew, 1984; Tollin and Koka 2009a; Tammar wallaby: Coles and Guppy, 1986; bat: Obrist et al., 1993; Firzlaff and Schuller, 2003; Fuzessery, 1996; Aytekin et al., 2004; gerbil: Maki and Furukawa, 2005; Rhesus monkey: Spezio et al., 2000; owl: Keller et al., 1998; ferret: Carlile, 1990;).
Models of localization have been described based on a cue similar to the acoustic axis (e.g., Musicant and Butler, 1984). However, in general, the acoustic axis in the chinchilla, like that in the cat (Phillips et al., 1982) and gerbil (Maki and Furukawa, 2005), changes in such complex ways with frequency, and often with multiple peaks, that it may be a poor cue for accurate sound source localization. Rather, as suggested by Middlebrooks and Pettigrew (1981), Coles and Guppy (1986), and Young et al. (1996), the frequency-dependence of the acoustic axis along with the ability of some animals with mobile pinna to independently manipulate the left and right pinna position might allow the pinna to operate like an acoustical antenna, increasing the signal-to-noise ratio for sounds of interest, at the expense of other sounds (see Tollin et al., 2009). The increased acoustical gain due to the pinna might then be more useful for source detection than for localization.
B. Binaural aspects of the acoustical cues
1. ILDs
The two common binaural cues to localization, ITDs and ILDs, are available to the chinchilla. As expected, ILDs were highly dependent on both frequency and spatial location. ILDs were small for low frequencies < 5 kHz, but increased rapidly for frequencies up to 12 kHz. Up to ~20 kHz, the ILDs varied systematically with azimuth and would likely provide a very stable cue for localization. Figure 6 (panel E) shows the rate of change of the ILD cues with frequency. The ILD slope increased from nearly 0 dB/deg at 4 kHz to 0.4–0.6 dB/deg by 12 kHz, but decreased for frequencies above 20 kHz. Others have also examined the rate of change of the ILD cues with azimuth and frequency. Compared to the rat (Koka et al., 2008), which has a smaller head diameter (~30 mm) and pinnae heights (~17 mm), the chinchilla head and pinnae are larger by factors of 1.17 and 2.9, respectively. In rat, the ILD slope steadily increased from ~0.03 dB/deg for frequencies < 1.5 kHz to 0.42 dB/deg at 18.5 kHz. In the cat, which has a head diameter of ~62 mm and pinnae heights of ~50 mm (Tollin and Koka, 2009a), the ILD slope increased monotonically from ~0.17 dB/deg from 2 kHz to ~0.6 dB/deg by 8 kHz (Irvine, 1987; Martin and Webster, 1989, Tollin and Koka 2009b). The range and magnitude of cat ILD slope values is comparable to that found here in the chinchilla. In the cat, above 8 kHz, the ILD slopes were also large, but did not vary systematically from frequency to frequency. Thus, as was the case in the cat, there appears to be a range of frequencies (< ~12 kHz) in the chinchilla where the ILD slope might also provide a stable cue for localization. In the rat, this range extends up to 18.5 kHz (Koka et al., 2008). Rice et al. (1992) refer to this region as the “ΔL” region. Interestingly, in the both the cat and chinchilla, the spectral notches begin to occur first for frequencies at ~8 kHz.
2. ITDs
The low-frequency ongoing fine-structure ITDs were measured in the present study. These ITDs varied systematically and symmetrically about the midsagittal plane (e.g., Figure 8). For the high-frequency cues, the maximum ITDs averaged across the 9 animals was 248 μs ± 15 μs. This value is 56% larger than the predicted maximum ITD of 158.8 μs based on the low-frequency Kuhn model (Kuhn, 1977) and 82% larger than the predicted 136.1 μs of the Woodworth (1938) spherical head model using an approximate adult chinchilla head diameter of 36 mm. In all cases, the empirical maximum ITD values were larger than the spherical head model predictions. Neither of the head models takes into account the possible role of the pinnae. Removal of the pinnae reduced the maximum ITDs by ~25%. Similar to that observed here, Maki and Furukawa (2005) found maximum high-frequency ITDs in gerbils that were ~30% larger than those predicted based on the spherical head model of Woodworth (1938) and the gerbil head diameter. Similar discrepancies between spherical head model predictions of maximum ITD and empirically measured ITDs have been reported in the rat (Koka et al., 2008), cat (Tollin and Koka, 2009b), and marmoset monkey (Slee and Young, 2010).
As might be expected, the maximum ITDs in the chinchillas were smaller than that found in other species with larger head diameters (human: Middlebrooks and Green, 1990, cat: Roth et al., 1980; Tollin and Koka 2009b; ferret: Schnupp et al., 2003; monkey: Spezio et al., 2000; guinea pig: Sterbing et al., 2003), but larger than that found in smaller species (gerbil: Maki and Furukawa, 2005; bat: Aytekin et al., 2004; rat: Koka et al., 2008). Measurement and modeling studies by Kuhn (1977) in human and by Roth et al. (1980) in cat suggest that low-frequency ITDs should be ~1.5 times larger than high-frequency ITDs. The data in chinchilla are consistent with this with maximum ITDs for low-frequency tone stimuli larger than the ITDs for high-frequency stimuli by a factor of 1.43 (i.e., Figure 9). Similar differences between low- and high-frequency ITDs have been observed in other species (cat: Roth et al., 1980; monkey: Spezio et al., 2000; gerbil: Maki and Furukawa, 2005; guinea pig: Sterbing et al., 2003).
For sources between ±15° along the horizontal plane, the rate of change (i.e., ITD slope) of the ITD cue with azimuth was 3.3 to 3.6 μs/deg for the low-frequency ITDs. The ITD cues changes nearly linearly for azimuths within ~±30° of the midsagittal plane.
On the important role of the pinnae in creating the acoustic cues to location
In several experiments, we removed the pinnae bilaterally and repeated the acoustical measurements to examine the role of the pinnae in the generation of the acoustical cues to location. We showed here that the pinnae of the chinchilla are essential for generating the spectral notch cues to sound location. In all cases studied, removal of the pinna eliminated the spectral notches (Figure 2C and 2D). Similar observations have been made in other species where the spectral notch cues have also been observed, and then eliminated after pinna removal (bat: Wotton et al., 1995; Aytekin et al., 2004; cat: Musicant et al., 1990; Tollin and Koka, 2009a; ferret: Parsons et al., 1999; rat: Koka et al., 2008; marmoset monkey: Slee and Young, 2010).
The pinna also contributed significantly to the monaural acoustical gain (Figure 3) and the acoustic axis. Similar conclusions have been reached in other species (cat: Wiener et al., 1966; Phillips et al., 1982; Musciant et al., 1990; Tollin and Koka 2009a; guinea pig: Palmer and King, 1985; Carlile and Pettigrew, 1987; Tammar wallaby: Coles and Guppy, 1986; bat: Orbist et al., 1993; Fuzessery, 1996; Aytekin et al., 2004; ferret: Carlile and King, 1994; Rat: Koka et al., 2008). In particular, our data (Figures 3) are in agreement with Carlile and Pettigrew (1987) and Carlile and King (1994). After pinna removal, the acoustic axis, for virtually all frequencies, was oriented along the ipsilateral interaural axis, supporting the hypothesis that the pinnae play a critical role in establishing the acoustic axis for high frequencies. Moreover, the overall gains of the DTFs were reduced for most high frequencies confirming that the pinnae are responsible for part of the acoustical gain at high frequencies. In the chinchilla, the pinnae alone were shown to be capable of generating ~10–15 dB of gain for frequencies from 8–16 kHz. Below 8 kHz, the gain due to the pinna was small. Pinna-only gains of 3–15 dB, with the higher gains occurring at higher frequencies, have been noted in the other species (ferret: Carlile and King, 1994 and Schnupp et al., 1998; cat: Tollin and Koka, 2009a; tammar wallaby: Coles and Guppy, 1986).
The pinnae also play a critical role in the formation, spatial distribution and magnitude of the ILD cue. Removal of both pinnae changed the acoustical gain and the acoustic axis for frequencies > ~8 kHz, so it should not be surprising that the pinna also contribute to the ILD cues around this frequency. Tollin and Koka (2009b) showed in cat that that the size of the pinnae, and not the size of the head, contributed the most to the across-animal variation in ILDs. The contribution of the pinna to ILDs has been investigated in other studies. For example, depending on frequency and azimuthal location, ILDs for sources along or near the horizontal plane were up to 9 dB less when the pinnae were removed in ferrets (Carlile and King, 1994; Schnupp et al., 1998; Parsons et al., 1999). In the guinea pig (Carlile and Pettigrew, 1987) pinna removal reduced the ILDs for frequencies above 5 kHz similar to that found here in the chinchilla. The largest ILD reduction occurred for those locations and frequencies associated with the acoustical axis (i.e., removing the pinna contribution to the maximum acoustical gain will also be associated with concomitant reductions in the ILD at that frequency). Finally, in the rat, the pinnae increased the ILD variations in azimuth by ~2–16 dB for frequencies between 5–35 kHz, with the largest increases in the range from 16–30 kHz where the monaural spectral notch cues were found in rat (Koka et al., 2008). In summary, the spectral notches produced primarily by the pinnae contralateral to the sound source contribute to the formation of ILD cues that are substantially larger than those that are produced by the head-shadow effect alone.
Finally, we also examined the role of the pinna in the formation of ITD cues in 5 animals. The maximum low-frequency ITDs in those animals were reduced by 25%, from 248 to 186 μs, after removing the pinna. The maximum ITDs of 186 μs without the pinna (i.e., “head-only” ITDs) were still ~17% larger than the predictions of the maximum ITDs based on Kuhn‘s low-frequency ITD (Kuhn, 1977). These results together reveal that the pinnae contributed substantially to the magnitude of ITDs, and do so more at larger lateral angles. Few studies have examined the role of the pinna in ITD cue generation. Roth et al. (1980) found that folding back the pinna in the cat had little effect on low-frequency ongoing ITDs, but did reduce the high-frequency ITDs quite substantially. This was similar to our results observed in rat (Koka et al., 2008). Slee and Young (2010) found low-frequency ITDs in the marmoset monkey that were ~34% larger than those predicted by the Woodworth (1938) model of ITDs using the empirical head diameter. These results might be due to the different method of computing ITD relative to Roth et al. (1980). Alternatively, Roth et al. (1980) may have underestimated the role of the pinna because they did not completely remove the pinna, but rather only folded it back on itself. This procedure likely still leaves a considerable portion of the pinna and distal parts of the ear canal in the path of the sound. In the present study of the contribution of the pinna to ITDs, the pinnae were completely removed to specifically avoid this potential confound.
Implications for physiological and behavioral studies
An important context of the current work is to examine how the spatial and frequency dependent acoustic transformations of sound due to the head and pinnae impact various physiological and behavioral audiological studies in the chinchilla. In the psychophysical study of Heffner et al. (1994) the chinchilla was classified as one of the most accurate rodents in terms of sound source location acuity. One likely reason for this is due to the relatively large head and pinnae of the chinchilla, relative to other rodents (rats, mice, etc.) which then contribute to the large binaural cues to sound location measured here. For example, the average ILD-azimuth slope for frequencies from 8 kHz up to 20 kHz was ~0.3 dB/deg. According to Heffner et al. (1994), the spatial acuity for sounds varying in azimuth for chinchillas with a broadband noise high-pass filtered above 8 kHz stimulus was 13.7°. From the acoustic ILD-azimuth slope (0.3 dB/deg) and the behavioral acuity, the psychophysical ILD acuity necessary to support that can be estimated to be ~4.1 dB (i.e., acoustic ILD slope multiplied by the localization acuity). Such ILD acuity is directly comparable to that measured in other species (see Tollin et al., 2008). Similarly, if the chinchillas were using ITDs for the behavioral acuity, the ITD acuity necessary to support a 13.7° spatial acuity would be 48 μs (i.e., 3.5 μs/deg ITD-azimuth slope multiplied by the spatial acuity). Consistent with this, for low-pass filtered noise (500 Hz cutoff frequency), Heffner et al. (1994) reported spatial acuity of 15.7°. The low-frequency ITD-azimuth slope in this study was ~3.5 μs/deg (Figure 8 and 9). Thus, low-frequency ITD acuity of the chinchilla is likely to be at least 55 μs, which is directly comparable to the 50–60 μs ITD thresholds measured psychophysically in the rabbit (Ebert et al., 2008) and ~30 μs in the cat (Wakeford and Robinson, 1974) using comparable low-frequency stimuli.
Regarding the monaural spectral cues, our data here show that removal of the pinnae eliminated the spectral notch cues to sound source elevation. Consistent with this, Heffner et al. (1996) showed that the behavioral acuity of chinchillas localizing sound sources varying in elevation was vastly decreased by removing the pinna. Along with the disappearance of spectral notches, pinnae removal also causes a decrease in DTF gain as well as moving the acoustical axis to more lateral azimuths. Moreover, even with pinnae intact, Heffner et al. (1995) showed that the spatial acuity of chinchillas for sources along the vertical plane was virtually eliminated when frequencies > 5 kHz were not available to the animals. Performance improved as higher frequencies were added, consistent with our measurements here that the monaural spectral cues are available for frequencies ranging from 6–18 kHz. Heffner et al. (1996) also reported an increase in front/back sound source discrimination errors in chinchilla when stimulus frequencies were restricted to those < 5 kHz and also when the pinnae ipsilateral to the sources was removed. These results demonstrate that the spectral cues created by the ipsilateral pinnae are the primary determinants of front/back source discrimination.
Finally, examination of the behavioral audiograms of chinchillas reveals a prominent increase in thresholds of up to 16 dB, relative to neighboring frequencies (i.e., relative to 1–4 kHz), for frequencies ~8 kHz (Heffner and Heffner 1991). This frequency range overlaps that in which we found spectral notches for sources in the frontal hemisphere. The joint role of the acoustic transformations of sound by the head and external ear as well as the frequency transfer function of the middle ear has been exploited to explain the behavioral audiogram (Rosowski, 1991; Rosowski, 1994; Long, 1994; Ruggero and Temchin, 2002; and Puria and Steele, 2010).
Acknowledgments
This work was supported by National Institutes of Deafness and Other Communicative Disorders Grant R01DC006865 to DJT. Support was also provided by the Neuroscience Training Grant (National Institute of Child Health and Human Development grant 5T32HD041697), the Advanced Training in Basic Neuroscience Grant (NINDS T32NS007083 to HGJ), an NIDCD NRSA (F31DC011198 to JLT), and by an American Academy of Otolaryngology-Head and Neck Surgery Foundation (AAO-HNSF) Resident research grant to JEL. We thank Dr. Michael Hall for preparing custom hardware (supported by NIH grant P30 NS041854-05) and Scott Baird for drawings.
Abbreviations
- ITD
Interaural Time Difference
- ILD
Interaural Level Difference
- DTF
Directional Transfer Functions
- HRTF
Head Related Transfer Functions
- MLS
Maximum Length Sequence
- FN
First Notch
Footnotes
Publisher's Disclaimer: This is a PDF file of an unedited manuscript that has been accepted for publication. As a service to our customers we are providing this early version of the manuscript. The manuscript will undergo copyediting, typesetting, and review of the resulting proof before it is published in its final citable form. Please note that during the production process errors may be discovered which could affect the content, and all legal disclaimers that apply to the journal pertain.
References
- Aytekin M, Grassi E, Sahota M, Moss CF. The bat head-related transfer function reveals binaural cues for sound localization in azimuth and elevation. J Acoust Soc Am. 2004;116:3594–3605. doi: 10.1121/1.1811412. [DOI] [PubMed] [Google Scholar]
- Benson DA, Teas DC. Single unit of binaural interaction in the auditory cortex of the chinchilla. Brain Res. 1976;103:313–338. doi: 10.1016/0006-8993(76)90801-5. [DOI] [PubMed] [Google Scholar]
- Brand A, Behrend O, Marquardt T, McAlpine D, Grothe B. Precise inhibition is essential for microsecond interaural time difference coding. Nature. 2002;417:543–547. doi: 10.1038/417543a. [DOI] [PubMed] [Google Scholar]
- Bugayevskiy LM, Snyder JP. Map Projections: A Reference Manual. Lomdon: Taylor and Francis; 1995. [Google Scholar]
- Calford MB, Pettigrew JD. Frequency dependence of directional amplification at the cat‘s pinna. Hear Res. 1984;14:13–19. doi: 10.1016/0378-5955(84)90064-9. [DOI] [PubMed] [Google Scholar]
- Carlile S. The auditory periphery of the ferret. I: Directional response properties and the pattern of interaural level differences. J Acoust Soc Am. 1990;88:2180–2195. doi: 10.1121/1.400115. [DOI] [PubMed] [Google Scholar]
- Carlile S, Pettigrew AG. Directional properties of the auditory periphery in the guinea pig. Hear Res. 1987;31:111–122. doi: 10.1016/0378-5955(87)90117-1. [DOI] [PubMed] [Google Scholar]
- Carlile S, King AJ. Monaural and binaural spectrum level cues in the ferret: acoustics and the neural representation of auditory space. J Neurophysiol. 1994;71:785–801. doi: 10.1152/jn.1994.71.2.785. [DOI] [PubMed] [Google Scholar]
- Chen QC, Cain D, Jen PHS. Sound pressure transformation at the pinna of Mus Domesticus. J Exp Biol. 1995;198:2007–2023. doi: 10.1242/jeb.198.9.2007. [DOI] [PubMed] [Google Scholar]
- Coles RB, Guppy A. Biophysical aspects of directional hearing in the tammar wallaby, Macropus eugenii. J Exp Biol. 1986;121:371–394. [Google Scholar]
- Duda RO, Martens WL. Range dependence of the response of a spherical head model. J Acoustical Soc Am. 1998;104:3048–3058. [Google Scholar]
- Ebert CS, Jr, Blanks DA, Patel MR, Coffey CS, Marshall AF, Fitzpatrick DC. Behavioral sensitivity to interaural time differences in the rabbit. Hear Res. 2008;235:134–142. doi: 10.1016/j.heares.2007.11.003. [DOI] [PMC free article] [PubMed] [Google Scholar]
- Firzlaff U, Schuller G. Spectral directionality of the external ear of the lesser spear-nosed bat, Phyllostomus discolor. Hear Res. 2003;181:27–39. doi: 10.1016/s0378-5955(03)00164-3. [DOI] [PubMed] [Google Scholar]
- Finlayson PG, Caspary DM. Synaptic potentials in chinchillas lateral superior olivary neurons. Hear Res. 1989;38:221–228. doi: 10.1016/0378-5955(89)90067-1. [DOI] [PubMed] [Google Scholar]
- Finlayson PG, Caspary DM. Low-frequency neurons in the lateral superior olive exhibit phase-sensitive binaural inhibition. J Neurophysiol. 1991;65:598–605. doi: 10.1152/jn.1991.65.3.598. [DOI] [PubMed] [Google Scholar]
- Fuzessery ZM. Monaural and binaural spectral cues created by the external ears of the pallid bat. Hear Res. 1996;95:1–17. doi: 10.1016/0378-5955(95)00223-5. [DOI] [PubMed] [Google Scholar]
- Harrison JM, Downey P. Intensity Changes at the Ear as a Function of the Azimuth of a Tone Source: A Comparative Study. J Acoust Soc Am. 1970;47 (6):1509–1518. doi: 10.1121/1.1912082. [DOI] [PubMed] [Google Scholar]
- Heffner RS, Heffner HE. Behavioral hearing range of the chinchilla. Hear Res. 1991;52:13–16. doi: 10.1016/0378-5955(91)90183-a. [DOI] [PubMed] [Google Scholar]
- Heffner RS, Heffner HE, Kearns D, Vogel J, Koay G. Sound localization in Chinchillas. I: Left/Right descriminations. Hear Res. 1994;80:247–257. doi: 10.1016/0378-5955(94)90116-3. [DOI] [PubMed] [Google Scholar]
- Heffner RS, Heffner HE, Koay G. Sound localization in Chinchillas. II: Front/Back vertical localization. Hear Res. 1995;88:190–198. doi: 10.1016/0378-5955(95)00112-h. [DOI] [PubMed] [Google Scholar]
- Heffner RS, Koay G, Heffner HE. Sound localization in Chinchillas. III: Effect of pinna removal. Hear Res. 1996;99:13–21. doi: 10.1016/s0378-5955(96)00074-3. [DOI] [PubMed] [Google Scholar]
- Irvine DR. Interaural intensity differences in the cat: Changes in sound pressure level at the two ears associated with azimuthal displacements in the frontal horizontal plane. Hear Res. 1987;26:267–286. doi: 10.1016/0378-5955(87)90063-3. [DOI] [PubMed] [Google Scholar]
- Jen PH, Chen DM. Directionality of sound pressure transformation at the pinna of echolocating bats. Hear Res. 1988;34:101–117. doi: 10.1016/0378-5955(88)90098-6. [DOI] [PubMed] [Google Scholar]
- Kinsler LE, Frey AR, Coppens AB, Sanders JV. Fundamentals of Acoustics. Wiley; New York: 1982. [Google Scholar]
- Keller CH, Hartung K, Takahashi TT. Head-related transfer functions of the barn owl: Measurement and neural responses. Hear Res. 1998;118:13–34. doi: 10.1016/s0378-5955(98)00014-8. [DOI] [PubMed] [Google Scholar]
- Kelly JB. Effects of auditory cortical lesions on sound localization by the rat. J Neurophysiol. 1980;44:1161–1174. doi: 10.1152/jn.1980.44.6.1161. [DOI] [PubMed] [Google Scholar]
- Koka K, Read HL, Tollin DJ. The acoustical cues to sound location in the rat: Measurements of directional transfer functions. J Acoust Soc Am. 2008;123:4297–4309. doi: 10.1121/1.2916587. [DOI] [PMC free article] [PubMed] [Google Scholar]
- Koka K, Holland NJ, Lupo JE, Jenkins HA, Tollin DJ. Electrocochleographic and mechanical assessment of round window stimulation with an active middle ear prosthesis. Hear Res. 2010;263:128–37. doi: 10.1016/j.heares.2009.08.009. [DOI] [PubMed] [Google Scholar]
- Kuhn GF. Model for the interaural time differences in the azimuthal plane. J Acoust Soc Am. 1977;62:157–167. [Google Scholar]
- Langford TL. Responses elicited from medial superior olivary neurons by stimuli associated with binaural masking and unmasking. Hear Res. 1984;15:39–50. doi: 10.1016/0378-5955(84)90223-5. [DOI] [PubMed] [Google Scholar]
- Leong P, Carlile S. Methods for spherical data analysis and visualization. J Neurosci Meth. 1998;80:191–200. doi: 10.1016/s0165-0270(97)00201-x. [DOI] [PubMed] [Google Scholar]
- Long GR. In: Comparative Hearing: Mammals. Fay RR, Popper AN, editors. Springer; New York: 1994. pp. 18–56. [Google Scholar]
- Maki K, Furukawa S. Acoustical cues for sound localization by the Mongolian gerbil, Meriones unguiculatus. J Acoust Soc Am. 2005;118:872–886. doi: 10.1121/1.1944647. [DOI] [PubMed] [Google Scholar]
- Martin RL, Webster WR. Interaural sound pressure level differences associated with sound-source locations in the frontal hemifield of the domestic cat. Hear Res. 1989;38:289–302. doi: 10.1016/0378-5955(89)90072-5. [DOI] [PubMed] [Google Scholar]
- McAlpine D, Grothe B. Sound localization and delay lines—do mammals fit the model? Trends Neurosci. 2003;26:347–350. doi: 10.1016/S0166-2236(03)00140-1. [DOI] [PubMed] [Google Scholar]
- McFadden SL, Kasper C, Ostrowski J, Ding D, Salvi RJ. Effects of inner hair cell loss on inferior colliculus evoked potential thresholds, amplitudes and forward masking functions in chinchillas. Hear Res. 1998;120:121–132. doi: 10.1016/s0378-5955(98)00052-5. [DOI] [PubMed] [Google Scholar]
- Middlebrooks JC, Pettigrew JD. Functional classes of neurons in primary auditory cortex of the cat distinguished by sensitivity to sound location. J Neurosci. 1981;1:107–120. doi: 10.1523/JNEUROSCI.01-01-00107.1981. [DOI] [PMC free article] [PubMed] [Google Scholar]
- Middelbrooks JC, Knudsen EI. Changes in external ear position modify the spatial tuning of auditory units in the cat‘s superior colliculus. J Neurophysiol. 1987;57:672–687. doi: 10.1152/jn.1987.57.3.672. [DOI] [PubMed] [Google Scholar]
- Middlebrooks JC, Makous JC, Green DM. Directional sensitivity of sound-pressure levels in the human ear canal. J Acoust Soc Am. 1989;86:89–108. doi: 10.1121/1.398224. [DOI] [PubMed] [Google Scholar]
- Middlebrooks JC, Green DM. Directional dependence of interaural envelope delays. J Acoust Soc Am. 1990;87:2149–2162. doi: 10.1121/1.399183. [DOI] [PubMed] [Google Scholar]
- Middlebrooks JC. Individual differences in external-ear transfer functions reduced by scaling in frequency. J Acoust Soc Am. 1999;106(3):1480–1492. doi: 10.1121/1.427176. [DOI] [PubMed] [Google Scholar]
- Moiseff A. Binaural disparity cues available to the barn owl for sound localization. J Acoust Soc Am. 1989;59:1222–1226. doi: 10.1007/BF00614505. [DOI] [PubMed] [Google Scholar]
- Moore DR, Irvine DRF. A developmental study of the sound pressure transformation by the head of the cat. Acta Otolaryngol. 1979;87:434–440. doi: 10.3109/00016487909126447. [DOI] [PubMed] [Google Scholar]
- Morest DK, Kim J, Bohne BA. Neuronal and transneuronal degeneration of auditory axons in the brainstem after cochlear lesions in the chinchilla: cochleotopic and non-cochleotopic patterns. Hear Res. 1997;103:151–168. doi: 10.1016/s0378-5955(96)00172-4. [DOI] [PubMed] [Google Scholar]
- Murphy WJ, Davis RR. The role of the chinchilla pinna and ear canal in electrophysiological measures of hearing thresholds. J Acoust Soc Am. 1998;103(4):1951–56. doi: 10.1121/1.421376. [DOI] [PubMed] [Google Scholar]
- Musicant AD, Butler RA. The psychophysical basis of monaural localization. Hear Res. 1984;14:185–190. doi: 10.1016/0378-5955(84)90017-0. [DOI] [PubMed] [Google Scholar]
- Musicant AD, Chan JC, Hind JE. Direction-dependent spectral properties of cat external ear: New data and cross-species comparisons. J Acoust Soc Am. 1990;87:757–781. doi: 10.1121/1.399545. [DOI] [PubMed] [Google Scholar]
- Nuding SC, Chen G, Sinex DG. Monaural response properties of single neurons in the chinchilla inferior colliculus. Hear Res. 1999;131:89–106. doi: 10.1016/s0378-5955(99)00023-4. [DOI] [PubMed] [Google Scholar]
- Obrist MK, Fenton MB, Eger JL, Schlegel PA. What ears do for bats: A comparative study of pinna sound pressure transformation in chiroptera. J Exp Biol. 1993;180:119–152. doi: 10.1242/jeb.180.1.119. [DOI] [PubMed] [Google Scholar]
- Parsons CH, Lanyon RG, Schnupp JWH, King AJ. Effects of altering spectral cues in infancy on horizontal and vertical sound localization by adult ferrets. J Neurophysiol. 1999;82:2294–2309. doi: 10.1152/jn.1999.82.5.2294. [DOI] [PubMed] [Google Scholar]
- Palmer AR, King AJ. A monaural space map in the guinea-pig superior colliculus. Hear Res. 1985;17:267–280. doi: 10.1016/0378-5955(85)90071-1. [DOI] [PubMed] [Google Scholar]
- Phillips DP, Calford MB, Pettigrew JD, Aitkin LM, Semple MN. Directionality of sound pressure transformation at the cat‘s pinna. Hear Res. 1982;8:13–28. doi: 10.1016/0378-5955(82)90031-4. [DOI] [PubMed] [Google Scholar]
- Pienkowski M, Harrison RV. Tone frequency maps and receptive fields in the developing chinchilla auditory cortex. J Neurophysiol. 2005;93:454–466. doi: 10.1152/jn.00569.2004. [DOI] [PubMed] [Google Scholar]
- Puria S, Steele C. Tympanic-membrane and malleus incus-complex co- adaptations for high-frequency hearing in mammals. Hear Res. 2010;263:183–190. doi: 10.1016/j.heares.2009.10.013. [DOI] [PMC free article] [PubMed] [Google Scholar]
- Rice JJ, May BJ, Spirou GA, Young ED. Pinna-based spectral cues for sound localization in cat. Hear Res. 1992;58:132–152. doi: 10.1016/0378-5955(92)90123-5. [DOI] [PubMed] [Google Scholar]
- Rife DD, Vanderkooy J. Transfer-function measurement with maximum-length sequences. J Audio Eng Soc. 1989;37:419–444. [Google Scholar]
- Roth GL, Kochhar RK, Hind JE. Interaural time differences: Implications regarding the neurophysiology of sound localization. J Acoust Soc Am. 1980;68:1643–1651. doi: 10.1121/1.385196. [DOI] [PubMed] [Google Scholar]
- Rosowski JJ. The effects of external- and middle-ear filtering on auditory threshold and noise-induced hearing loss. J Acoust Soc Am. 1991;90:124–135. doi: 10.1121/1.401306. [DOI] [PubMed] [Google Scholar]
- Rosowski JJ. In: Comparative Hearing: Mammals. Fay RR, Popper AN, editors. Springer; New York: 1994. pp. 172–247. [Google Scholar]
- Ruggero MA, Rich NC. Chinchilla auditory-nerve responses to low-frequency tones. J Acoust Soc Am. 1983;73:2096–108. doi: 10.1121/1.389577. [DOI] [PubMed] [Google Scholar]
- Ruggero MA, Temchin AN. The roles of the external, middle, and inner ears in determining the bandwidth of hearing. PNAS. 2002;99:13206–13210. doi: 10.1073/pnas.202492699. [DOI] [PMC free article] [PubMed] [Google Scholar]
- Schnupp JWH, King AJ, Carlile S. Altered spectral localization cues disrupt the development of the auditory space map in the superior colliculus of the ferret. J Neurophysiol. 1998;79:1053–1069. doi: 10.1152/jn.1998.79.2.1053. [DOI] [PubMed] [Google Scholar]
- Schnupp JWH, Booth J, King AJ. Modeling individual differences in ferret external ear transfer functions. J Acoust Soc Am. 2003;113 (4):2021–2030. doi: 10.1121/1.1547460. [DOI] [PubMed] [Google Scholar]
- Shaw EAG, Teranishi R. Sound pressure generated in an external ear replica and real human ears by a nearby point source. J Acoust Soc Am. 1968;44:240–249. doi: 10.1121/1.1911059. [DOI] [PubMed] [Google Scholar]
- Shaw EAG. External ear response and sound localization. Localization of Sound: Theory and Applications ~Amphora, Groton, CT! 1982:30–41. [Google Scholar]
- Slee SJ, Young ED. Sound localization cues in the marmoset monkey. Hear Res. 2010;260:96–108. doi: 10.1016/j.heares.2009.12.001. [DOI] [PMC free article] [PubMed] [Google Scholar]
- Songer JE, Rosowski JJ. The effect of superior-canal opening on middle-ear input admittance and air-conducted stapes velocity in chinchilla. J Acoust Soc Am. 2006;120:258–269. doi: 10.1121/1.2204356. [DOI] [PMC free article] [PubMed] [Google Scholar]
- Spezio ML, Keller CH, Marrocco RT, Takahashi TT. Head-related transfer functions of the rhesus monkey. Hear Res. 2000;144:73–88. doi: 10.1016/s0378-5955(00)00050-2. [DOI] [PubMed] [Google Scholar]
- Sterbing SJ, Hartung K, Hoffmann K-P. Spatial tuning to virtual sounds in the inferior colliculus of the guinea pig. J Neurophysiol. 2003;90:2648–2659. doi: 10.1152/jn.00348.2003. [DOI] [PubMed] [Google Scholar]
- Tollin DJ. The Lateral Superior Olive: A Functional Role in Sound Source Localization. The Neuroscientist. 2003;9(2):127–143. doi: 10.1177/1073858403252228. [DOI] [PubMed] [Google Scholar]
- Tollin DJ, Yin TCT. Spectral cues explain illusory elevation effects with stereo sounds in cats. J Neurophysiol. 2003;90:525–530. doi: 10.1152/jn.00107.2003. [DOI] [PubMed] [Google Scholar]
- Tollin DJ, Koka K, Tsai JJ. Interaural level difference discrimination thresholds for single neurons in the lateral superior olive. J Neurosci. 2008;28:4848–4860. doi: 10.1523/JNEUROSCI.5421-07.2008. [DOI] [PMC free article] [PubMed] [Google Scholar]
- Tollin DJ, Ruhland JL, Yin TCT. The vestibulo-auricular reflex. J Neurophysiol. 2009;101:1258–1266. doi: 10.1152/jn.90977.2008. [DOI] [PMC free article] [PubMed] [Google Scholar]
- Tollin DJ, Koka K. Postnatal development of sound pressure transformations by the head and pinnae of the cat: Monaural characteristics. J Acoust Soc Am. 2009a;125(2):980–994. doi: 10.1121/1.3058630. [DOI] [PMC free article] [PubMed] [Google Scholar]
- Tollin DJ, Koka K. Postnatal development of sound pressure transformations by the head and pinnae of the cat: Binaural characteristics. J Acoust Soc Am. 2009b;126(6):3125–3136. doi: 10.1121/1.3257234. [DOI] [PMC free article] [PubMed] [Google Scholar]
- Von Bismark G. MS Thesis. MIT; 1967. The sound pressure transformation function from free field to eardrum of the chinchilla. [Google Scholar]
- Von Bismark G, Pfeiffer RR. On the sound pressure transformation from free field to eardrum. J Acoust Soc Am. 1967;42:1156. [Google Scholar]
- Wakeford OS, Robinson DE. Lateralization of tonal stimuli by the cat. J Acoust Soc Am. 1974;55:1223–1234. doi: 10.1121/1.1914577. [DOI] [PubMed] [Google Scholar]
- Wiener FM, Pfeiffer RR, Backus ASN. On the sound pressure transformation by the head and auditory meatus of the cat. Acta Oto-Laryngol. 1966;61:255–269. doi: 10.3109/00016486609127062. [DOI] [PubMed] [Google Scholar]
- Wightman FL, Kistler DJ. Headphone simulation of free-field listening. I: Stimulus synthesis. J Acoust Soc Am. 1989;85:858–867. doi: 10.1121/1.397557. [DOI] [PubMed] [Google Scholar]
- Woodworth RS. Experimental Psychology. Henry Holt and Co; New York: 1938. [Google Scholar]
- Wotton JM, Haresign T, Simmons JA. Spatially dependent acoustic cues generated by the external ear of the big brown bat, Eptesicus fuscus. J Acoust Soc Am. 1995;98:1423–1445. doi: 10.1121/1.413410. [DOI] [PubMed] [Google Scholar]
- Xu L, Middlebrooks JC. Individual differences in external-ear transfer functions of cats. J Acoust Soc Am. 2000;107:1451–1459. doi: 10.1121/1.428432. [DOI] [PubMed] [Google Scholar]
- Young ED, Rice JJ, Tong SC. Effects of pinna position on head-related transfer functions in the cat. J Acoust Soc Am. 1996;99:3064–3076. doi: 10.1121/1.414883. [DOI] [PubMed] [Google Scholar]