Abstract
Differentiated trophoblast cell lineages arise from trophoblast stem (TS) cells. To date such a stem cell population has only been established in the mouse. The objective of this investigation was to establish TS cell populations from rat blastocysts. Blastocysts were cultured individually on a feeder layer of rat embryonic fibroblasts (REFs) in fibroblast growth factor-4 (FGF4) and heparin supplemented culture medium. Once cell colonies were established REF feeder layers could be replaced with REF conditioned medium. The blastocyst-derived cell lines, in either proliferative or differentiated states, did not express genes indicative of ICM-derived tissues. In the proliferative state the cells expressed established stem cell-associated markers of TS cells. Cells ceased proliferation and differentiated when FGF4, heparin, and REF conditioned medium were removed. Differentiation was characterized by a decline of stem cell-associated marker gene expression, the appearance of large polyploid cells (trophoblast giant cells), and the expression of trophoblast differentiation-associated genes. Collectively, the data indicate that the rat blastocyst-derived cell lines possess many features characteristic of mouse TS cells but also possess some distinct properties. These rat TS cell lines represent valuable new in vitro models for analyses of mechanisms controlling TS cell renewal and differentiation.
Keywords: trophoblast stem cells, trophoblast differentiation, placenta, rat
INTRODUCTION
The hemochorial placenta is comprised of specialized trophoblast cell lineages, which organize into a structure that facilitates nutrient delivery from the maternal uterine vasculature to the developing embryo. These differentiated trophoblast cells arise from a trophoblast stem (TS) cell population (Rossant 2001; Rielland et al. 2008; Sasaki 2010). When isolated, TS cells can self renew and differentiate into distinct populations of specialized trophoblast cells. Such stem cell populations have been established from embryonic day (E) 3.5 mouse blastocysts and E6.5 mouse extraembryonic ectoderm (Tanaka et al. 1998; Uy et al. 2002).
The in vitro expansion of mouse TS cells is dependent upon activation of fibroblast growth factor 4 (FGF4)/FGF receptor 2 (FGFR2; Tanaka et al. 1998; Gotoh et al. 2005; Yang et al. 2006; Abell et al. 2009; Murohashi et al. 2010) and nodal/activin/transforming growth factor-β (TGFβ) signaling pathways (Beck et al. 2002; Erlebacher et al. 2004; Guzman-Ayala et al. 2004; Natale et al. 2009). Typically, TS cells are derived from E3.5 blastocysts cultured on mouse embryonic fibroblast (MEF) feeder layers supplemented with FGF4 and heparin (Oda et al. 2006; Quinn et al. 2006). Once TS cell colonies are established then feeder layers can be replaced by medium conditioned by MEFs (Tanaka et al. 1998; Oda et al. 2006; Quinn et al. 2006) or alternatively with activin or TGFβ (Erlebacher et al. 2004). These conditions promote self-renewal and inhibit differentiation. Removing factors promoting self-renewal leads to differentiation. In vitro differentiation is predominantly directed toward the trophoblast giant cell lineage (Tanaka et al. 1998). Mouse TS cells can also be reintroduced into blastocysts where they become stably incorporated and when transferred into an appropriately timed pseudopregnant mouse can form chimeric placentas, reconstituting all trophoblast cell lineages (Tanaka et al. 1998).
Isolation of a similar FGF4-dependent TS cell population has not been reported for any other species. Some have suggested that there may be some fundamental species differences in the regulation of the trophoblast lineage (Rielland et al. 2008). There are also other reports describing the derivation of TS-like cells from rat and common vole embryos in the absence of FGF4 (Grigor’eva et al. 2009; Chuykin et al. 2010). The latter were bi-products of efforts to derive embryonic stem (ES) cells. TS-like cells have also been established from a transplantable rat choriocarcinoma (Faria and Soares, 1991). These cells exhibit many features in common with mouse TS cells, including their capacity to differentiate along the trophoblast giant cell lineage; however, their maintenance is also independent of FGF4 (Sahgal et al. 2006; Kent et al. 2010).
The purpose of the current investigation was to establish TS cell populations from the E4.5 rat blastocyst. These efforts were successful and demonstrate the conservation of FGF4-dependent mechanisms required for ex vivo establishment of rat TS cells. Rat TS cells self-renew, differentiate into specialized trophoblast lineages following mitogenic withdrawal, and share many commonalities with mouse TS cells. Comparative gene expression analysis indicates that the rat TS may be more developmentally advanced than are mouse TS cells. Rat TS cell lines represent a new set of tools for studying the regulation of TS cell renewal and differentiation.
MATERIALS AND METHODS
Animals
Holtzman Sprague-Dawley (HSD) rats were obtained from Harlan Sprague-Dawley Inc. (Indianapolis, IN). A colony of transgenic rats expressing the enhanced green fluorescence protein (EGFP) driven by a chicken β-actin promoter (chβA-EGFP; Ikawa et al., 1998; Hasuwa et al., 2002) were established. The animals were housed in an environmentally controlled facility with lights on from 0600–2000 h and were allowed free access to food and water. Virgin female rats 8–10 weeks of age were cohabited with adult males (>3 months of age) of the same strain. Mating was assessed by daily inspection of vaginal lavages. The presence of sperm in the vaginal lavage was considered d0.5 of pregnancy. Female rats were made pseudopregnant by mating with vasectomized males. The presence of seminal plugs was designated d0.5 of pseudopregnancy. Embryo transfer was accomplished through collection of d4.5 embryos and transferring them into uteri of d3.5 pseudopregnant recipients. The University of Kansas Animal Care and Use Committee approved protocols for the care and use of animals.
Derivation of TS cells from rat blastocysts
Blastocysts were recovered from uteri of gestation d4.5 HSD rats and transgenic chBA-EGFP rats. Blastocysts were cultured individually on a feeder layer of rat embryonic fibroblasts (REFs) in Basal Culture Medium [RPMI 1640 (Cellgro, Herndon, VA), 20% fetal bovine serum (FBS; Atlanta Biologicals, Norcross, GA), 100 μM 2-mercaptoethanol (Sigma), 1 mM sodium pyruvate (Cellgro), 50 μM penicillin and 50 U/ml streptomycin (Cellgro)] supplemented with 80% REF conditioned medium, FGF4 (37.5 ng/ml; Sigma) and heparin (1.5 μg/ml; Sigma). Feeder layers were prepared from gestation d15.5–17.5 rat fetuses. Fetal limbs, heads, and internal organs were removed and the remaining structure was minced into small pieces, digested with 0.25% trypsin, and collected by centrifugation. The REF cell pellets were resuspended in DMEM culture medium supplemented with 10% FBS and antibiotics. REF conditioned medium was prepared according to the procedure described for the preparation of mouse embryonic fibroblast (MEF) conditioned medium (Quinn et al. 2006). At 4–5 days of blastocyst culture outgrowths were disaggregated and re-plated. TS cell colonies were evident around 7–10 days after the disaggregation. Culture medium was replaced every day or every other day depending on cellular growth rates. Colonies were subcultured once they achieved 50–70% confluence within the culture well. The blastocyst-derived cells could be maintained in REF feeder-free conditions if the culture medium was supplemented with REF conditioned medium (80% by volume). Chromosomal spreads were generated by Colcemid metaphase arrest, exposure to hypotonic KCl buffer to swell the cells, fixation in Carnoy’s (3:1; methanol:acetic acid), staining with Leishman’s Giemsa, and karyotype determination. Genomic DNA was isolated from the cells and the presence of the Sry gene assessed by PCR (An et al. 1997). Primers for Sry and Actb (positive control) genes are shown in Suppl Table 1. Differentiation of the blastocyst-derived cells was induced by removal of FGF4, heparin, and the REF conditioned medium. Established rat blastocyst-derived cell lines were characterized by their morphology, ploidy, and gene expression profiles.
Mouse TS cells
Mouse TS cells were obtained from Dr. Janet Rossant, Hospital for Sick Children, (Toronto, Canada). TS cells were maintained in heparin/FGF-4 supplemented culture medium comprised of 30% TS medium (RPMI 1640 supplemented with 20% FBS, 1 mM sodium pyruvate, 50 μM 2-mercaptoethanol) and 70% MEF conditioned medium as previously described (Tanaka et al. 1998). Heparin and FGF-4 are added to final concentrations of 1 μg/ml and 25 ng/ml, respectively. Differentiation of the cells was induced by removal of FGF4, heparin, and the MEF conditioned medium. (Tanaka et al. 1998).
Mouse embryonic stem (ES) cells and rat ES-like cells
E14Tg2A (E14) mouse ES cells were maintained on feeder-free plates in ES medium [Knockout DMEM (Invitrogen, Carlsbad, CA) supplemented with 15% ES tested- FBS (Invitrogen), 2 mM L-glutamine (Invitrogen), 0.1 mM nonessential amino acids (Invitrogen), 1 mM sodium pyruvate, 55 μM 2-mercaptoethanol, 100 units/ml penicillin, 100 units/ml streptomycin, and 1000 units/ml leukemia inhibitory factor (Chemicon International, Temecula, CA)]. Rat ES-like cells were established by culturing rat embryonic d4.5 blastocysts in 3-Inhibitor culture medium as previously described (Buehr et al. 2008; Li et al. 2008). Mouse ES cells and rat ES-like cells were used as positive controls for Sox2 gene expression.
RT-PCR characterization of the rat blastocyst-derived TS cells
Transcripts reflecting different lineages of blastocyst-derived cells were assessed by RT-PCR. Five μg of total RNA were reverse transcribed using SuperScript II reverse transcriptase (Invitrogen). PCR was performed using GoTaq Flexi DNA polymerase (Promega, Madison, WI) with specific primers (Suppl Table 2). PCR was performed for 27 to 32 cycles (denature, 94°C for 30 sec; anneal, 55°C for 30 sec; extension, 72°C for 30 sec). Amplified products were resolved by electrophoresis in 2% agarose gels and ethidium bromide staining.
qRT-PCR
cDNAs were synthesized with total RNA (3 μg) from each sample using SuperScript II reverse transcriptase (Invitrogen), diluted ten times with water, and subjected to qRT-PCR to quantify mRNA levels of the genes used to characterize the blastocyst-derived TS cells. Primers were designed using Primer3 (Rozen and Skaletsky 2000) and sequences can be found in Suppl Table 3. Real-time PCR amplification of cDNAs was carried out in a reaction mixture (25 μl) containing SYBR GREEN PCR Master Mix (Applied Biosystems, Foster City, CA) and primers (250 nM each). Amplification and fluorescence detection were carried out using the ABI Prism 7500 Real Time PCR System (Applied Biosystems). Cycling conditions included an initial hold step (95 ºC for 10 min) and 40 cycles of a 2-step PCR (92 ºC for 15 s, then 60 ºC for 1 min), followed by a dissociation step (95 ºC for 15 s, 60 ºC for 15 s, and then a sequential increase to 95 ºC). The comparative CT method was used for relative quantification of the amount of mRNA for each sample normalized to 18S RNA.
Analysis of ploidy
DNA content was estimated by flow cytometry as previously described for the analysis of mouse TS cells by Rossant and colleagues (Quinn et al. 2006). Briefly, cells were detached with trypsin and fixed with cold 70% ethanol and then stained with propidium iodide and sorted by flow cytometry using BD LSRII (BD Biosciences, San Jose, CA).
Immunocytochemistry and histological analyses
Immunocytochemical analyses were used to identify differentiating trophoblast cells. Analyses were performed on blastocyst-derived TS cells plated in chamber slides. Following fixation in cold 4% paraformaldehyde solution and blocking in 10% normal goat serum for 30 min at room temperature, incubations were performed overnight at 4ºC with rabbit polyclonal antibodies to CDX2 (1:250 dilution; Orbigen, San Diego, CA), EOMES (1:250 dilution; Orbigen), or TPBPA, which was generously provided by Dr. Kunio Shiota of the University of Tokyo (1:1000 dilution; Iwatsuki et al. 2000). Tetramethylrhodamine isothiocyanate (TRITC) conjugated secondary antibodies (Sigma-Aldrich, St. Louis, MO, 1:400 dilution) were added for 30 min at room temperature. Negative controls were performed with normal rabbit serum and did not exhibit positive reactivity. Fluorescent labeling of filamentous actin was performed on paraformaldehyde fixed and 0.1% Triton X-100 permeabilized cells using rhodamine-conjugated phalloidin (Molecular Probes, Carlsbad, CA) as previously described (Kamei et al. 1997). Cells were counterstained with 4', 6-diamidino-2-phenylindole (DAPI, Molecular Probes). Images were captured using a Leica DMI 4000 microscope equipped with a Leica CCD camera (Leica Microsystems, Welzlar, Germany).
Western blot analysis
CDX2, EOMES, TPBPA, PRL3B1, and α-tubulin protein levels were evaluated by western blot analysis. Rat TS cell lysates were prepared in radioimmunoprecipitation assay (RIPA) buffer (10 mM Tris-HCl, pH 7.2, 1% Triton X-100 or 1% Nonidet P-40, 1% sodium deoxycholate, 0.1% SDS, 150 mM NaCl, 5 mM EDTA, 1 mM sodium orthovanadate, 1 mM phenylmethylsulfonyl fluoride, 10 μg/ml aprotinin). Protein concentrations were determined by the DC protein assay (Bio-Rad, Hercules, CA). Proteins were separated by SDS-PAGE and transferred onto nitrocellulose membranes. Immunoreactive proteins were detected with rabbit antibodies to CDX2 (1:2000 dilution; Epitomics, Burlingame, CA), EOMES (1:1000 dilution; Santa Cruz Biotechnology, Santa Cruz, CA), TPBPA (1:1000 dilution; Iwatsuki et al. 2000), and PRL3B1 (1:2000 dilution; Deb et al. 1989). α-tubulin protein was detected with a mouse monoclonal antibody (1:2000 dilution; Calbiochem, San Diego, CA). Immunoreactive proteins were visualized by enhanced chemiluminescence according to the manufacturer’s instructions (Amersham Biosciences, Piscataway, NJ).
Measurements of progesterone and androstenedione
Progesterone and androstenedione were measured from medium conditioned by rat blastocyst-derived TS cells using 125I-labeled RIA kits according to the manufacturer’s instructions (Siemens Medical Solutions Diagnostics, Los Angeles, CA) as previously described by our laboratory (Yamamoto et al. 1994, 1996).
Statistical analysis
Statistical analyses of two means were performed with Student’s t-test or Welch’s t-test. Comparisons of multiple groups were evaluated with analysis of variance. The source of variation from significant F-ratios was determined with Tukey’s HSD multiple comparison test. Statistical analyses were performed using the R Statistical Package (http://www.r-project.org/).
RESULTS
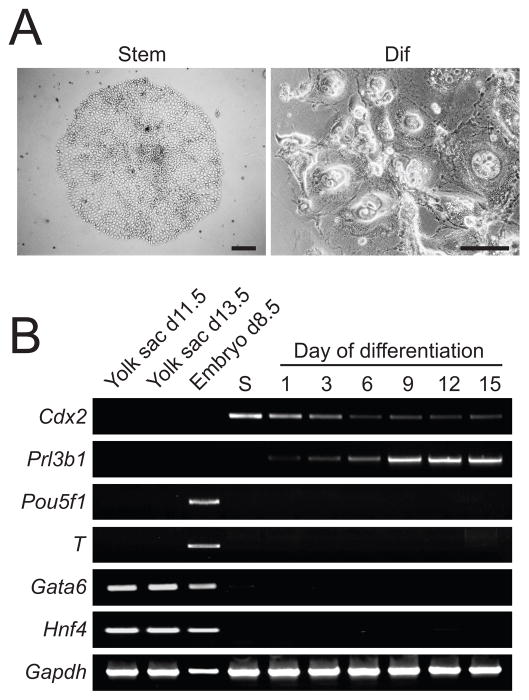
TS cell cultures are readily established from mouse E3.5 blastocysts cultured on MEF feeders with FGF4 and heparin (Tanaka et al. 1998; Oda et al. 2006; Quinn et al. 2006; Tanaka 2006). We used similar cell culture strategies and derived several cell lines from HSD and HSD-GFP rat E4.5 blastocysts. Tightly packed colonies were evident under stem cell conditions (Fig. 1A). Differentiation was induced by removal of mitogenic stimuli and resulted in a dramatic increase in cells with large nuclei (Fig. 1A). All rat blastocyst-derived stem cells were euploid. Both X,X and X,Y cell lines were established. Rat blastocyst-derivation of stem cells appears less efficient (HSD: 7 cell lines/39 blastocysts; HSD-GFP: 6 cell lines/24 blastocysts) than reported for the mouse (~60%; Tanaka et al. 1998). In the mouse, efficiency of TS cell derivation is influenced by genetic background (Oda et al. 2006; Quinn et al. 2006). This was also true for the rat. We have had difficulty in establishing cell lines from some inbred rat strains (Brown Norway and Dahl Salt Sensitive strains). The rat blastocyst-derived stem cell lines were characterized and compared to known features of mouse TS cells. Our analysis included two HSD blastocyst-derived cell lines (H1-3, 42-X,Y and H2-19, 42-X,X). Findings from the experimentation were similar for each of the rat blastocyst-derived stem cell lines.
Fig. 1. Derivation and characterization of stem cell populations from rat blastocysts.
A) A colony of tightly packed cells characteristic of the stem cell state (Stem) and a colony of cells possessing larger nuclei following 8-days of differentiation (Dif). Differentiation was induced by culturing cells in the absence of FGF4, heparin, and REF conditioned medium. Scale bars, 250 μm. B) Germ layer lineage analysis. RT-PCR analysis for lineage markers in the rat blastocyst-derived stem cells in the stem cell state (S) and following 15 days of differentiation. Lineage markers: Cdx2 (trophoblast - stem cell), Prl3b1 (trophoblast - differentiated), T (mesoderm), Pou5f1 (epiblast), Gata6 (endoderm), and Hnf4 (endoderm). RNA isolated from yolk sac and embryos were used as controls for the extraembryonic endoderm and embryonic gene markers, respectively. Gapdh was used as an internal control.
Germ layer lineage analysis
The rat blastocyst-derived cell lines exhibited features consistent with their classification as TS cells. Once the cultures were established the REF feeders could be replaced with medium conditioned by REFs. The rat blastocyst-derived cells expressed the trophoblast stem cell marker gene, Cdx2, and the trophoblast differentiation marker gene, Prl3b1, but did not express genes reflecting an inner cell mass origin (Fig. 1B). Pou5f1 (epiblast), T (mesoderm), Gata6 (endoderm), and Hnf4 (endoderm) were not expressed in proliferating blastocyst-derived cells or in the cells following differentiation. The observations are consistent with a trophoblast origin of the blastocyst-derived cell lines.
TS cell – stem cell marker analyses
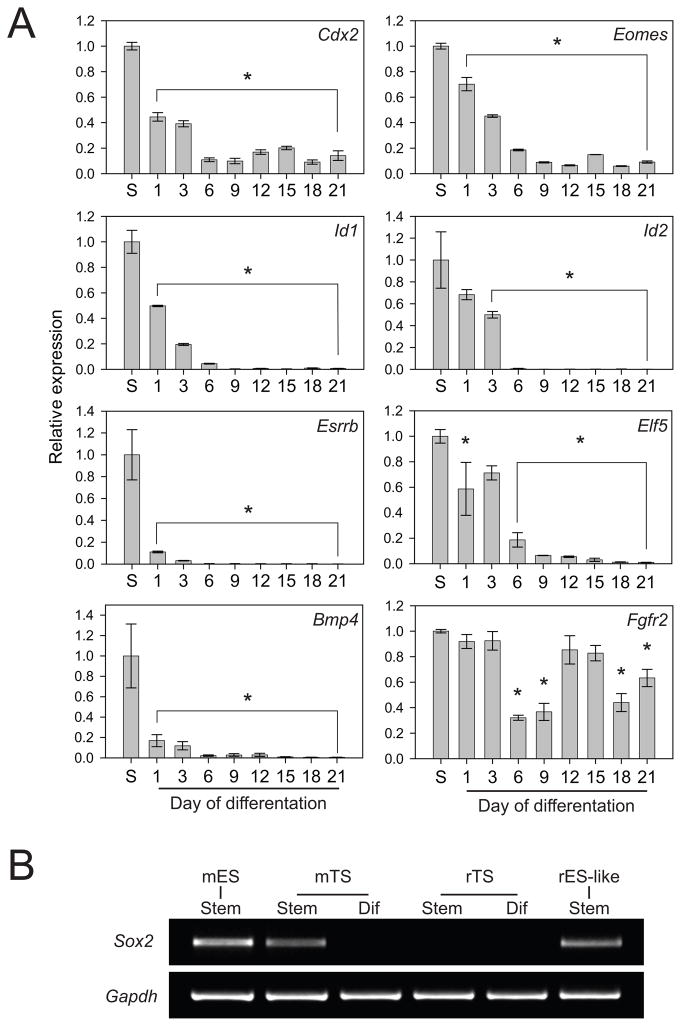
Mouse TS cells undergoing self-renewal express a number of genes, which are viewed as critical for maintaining their stem cell state (Tanaka et al. 1998; Rielland et al. 2008; Kidder and Palmer 2010; Sasaki 2010). Some of these genes exhibit elevated expression in mouse TS cells and are downregulated following differentiation. Expression patterns of a subset of these genes were evaluated in rat blastocyst-derived stem cells (Fig. 2). Cdx2, Eomes, Id1, Id2, Esrrb, Elf5, and Bmp4 transcript levels were each elevated in the stem cell state and precipitously declined during differentiation (Fig. 2A). Fgfr2 mRNA exhibited a more complex pattern of expression (Fig. 2A). Sox2, a gene critical for mouse TS cell derivation (Avilion et al. 2003), was expressed in mouse ES cells, rat ES-like cells, and mouse TS cells in the stem cell state but not following differentiation (Fig. 2B). Sox2 was undetectable in rat blastocyst-derived TS cells (Fig. 2B). Overall, except for Sox2, the stem cell gene marker expression analysis of the rat blastocyst-derived TS cells was remarkably similar to that observed for mouse TS cells (Tanaka et al. 1998; Avilion et al. 2003; Ng et al. 2008).
Fig. 2. Stem cell gene marker analysis in rat TS cells.
Rat TS cells were cultured under stem cell (S) or differentiation conditions for the indicated days, harvested, and RNA extracted. A) qRT-PCR was used to estimate transcript levels for genes known to be expressed in the stem cell state of TS cells: Cdx2, Eomes, Id1, Id2, Esrrb, Elf5, Bmp4, and Fgfr2. Transcript levels were normalized to 18S RNA. Ratios of tested gene CT value to 18S CT value (18S CT value: 13.63 ± 0.027) in the stem cell state: Cdx2, 1.39; Eomes, 1.54; Id1, 1.41; Id2, 1.78; Esrrb, 1.54; Elf5, 1.81; Bmp4, 2.32; Fgfr2, 1.54. Bars represent means ± the standard error of the mean. Differentiation expression values significantly different from the stem cell level of expression are indicated with an asterisk (*P<0.05). B) Sox2 expression in TS cells. Mouse and rat TS cells were cultured under stem cell or differentiation conditions (d6), harvested, and RNA extracted. RT-PCR was used to estimate Sox2 transcript levels. Gapdh was used as an internal control. E14 mouse ES cells and rat ES-like cells were used as positive controls for Sox2 expression. The positive controls express Oct4, Nanog, and Sox2 but do not express Cdx2.
Trophoblast differentiation analyses
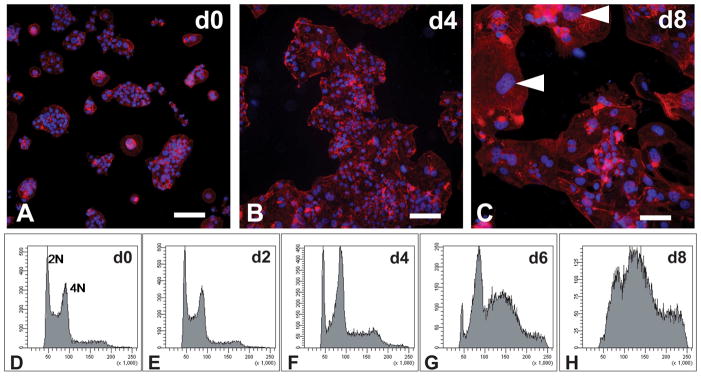
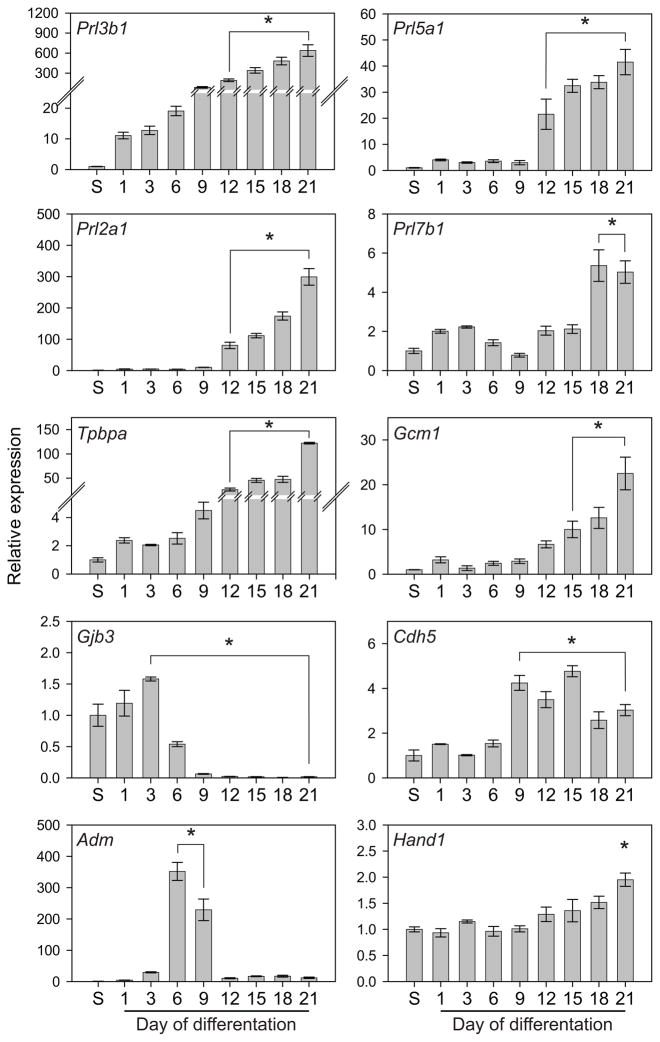
Similar to mouse TS cells, the rat blastocyst-derived stem cells could be induced to differentiate by withdrawal of FGF4, heparin, and REF conditioned medium. Differentiation was accompanied by a change in cell morphology characterized by enlarged nuclei and increases in cell size and DNA content (Fig. 3). This transformation was most striking after eight days of culture in differentiation conditions. The cells with enlarged nuclei resembled trophoblast giant cells. Trophoblast giant cells possess the capacity to produce peptide and steroid hormones (Soares et al. 1996). The prolactin (PRL) family exhibits trophoblast cell- and temporal-specific patterns of gene expression (Soares et al. 1991; Soares 2004; Alam et al. 2006; Soares et al. 2007). Transcript analysis for members of the PRL family indicated a dramatic increase in expression of Prl3b1, Prl5a1, Prl2a1, and Prl7b1 following differentiation (Fig. 4). Trophoblast giant cells express Prl3b1 (Campbell et al. 1990; Faria et al. 1990), whereas Prl5a1, Prl2a1, and Prl7b1 are expressed in invasive trophoblast lineages (Ain et al. 2003; Wiemers et al. 2003). Prl7b1 showed some indications of a biphasic increase during differentiation.
Fig. 3. Rat TS cell differentiation: morphology and endoreduplication.
Rat TS cells were cultured under stem cell conditions (d0; A, D) and differentiation conditions for 2 days (E), 4 days (B, F), 6 days (G), and 8 days (C, H). A–C) The cells were fixed, stained with rhodamine phalloidin, and counterstained with DAPI. Arrowheads show the presence of differentiated cells with trophoblast giant cell morphologies. D–H) DNA contents of the cells were determined by flow cytometry following propidium iodide staining. Scale bar, 100 μm.
Fig. 4. Rat TS cell differentiation: gene expression.
A) Rat TS cells were cultured under stem cell or differentiation conditions for the indicated days, harvested, and RNA extracted. qRT-PCR was used to estimate transcript levels for Prl3b1, Prl5a1, Prl2a1, Prl7b1, Tpbpa, Gcm1, Gjb3, Cdh5, Adm, and Hand1. Transcript levels were normalized to 18S RNA. Ratios of tested gene CT value to 18S CT value (18S CT value: 13.63 ± 0.027) at peak expression: Prl3b1, 1.37; Prl5a1, 1.66; Prl2a1, 1.11; Prl7b1, 2.22; Tpbpa, 1.84; Gcm1, 2.47; Gjb3, 1.42; Cdh5, 1.68; Adm, 1.53; Hand1, 1.27. Bars represent means ± the standard error of the mean. Differentiation expression values significantly different from the stem cell level of expression are indicated with an asterisk (*P<0.05).
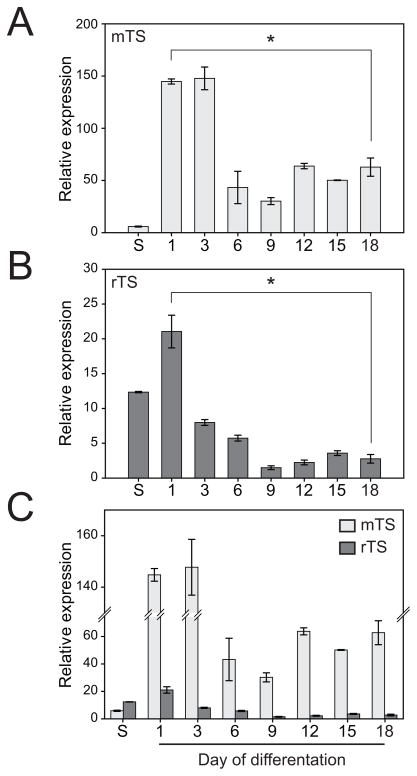
In addition to trophoblast giant cells and invasive trophoblast, mouse TS cells have the ability to differentiate into spongiotrophoblast, glycogen cells, and syncytial trophoblast (Simmons and Cross 2005). Differentiating rat blastocyst-derived cells expressed biomarkers for each of these trophoblast lineages (Fig. 4). Tpbpa and Gcm1 are expressed in spongiotrophoblast and syncytial trophoblast, respectively, and showed a similar ontogeny of expression during differentiation. Gjb3, a glycogen cell marker, was expressed in the stem cell state, transiently increased during early stages of differentiation, and then declined after d3 of differentiation, a pattern inverse to that observed for other indices of trophoblast differentiation. Cdh5 and Adm are activated in trophoblast cells interacting with the vasculature. Cdh5 showed a pattern similar to most differentiation-dependent genes, while Adm exhibited a transient increase during differentiation. Hand1 transcripts were present in both stem and differentiating conditions. A marked difference was noted regarding the expression of Ascl2 in rat blastocyst-derived stem cells versus mouse TS cells (Fig. 5). Ascl2 expression is low/undetectable in mouse TS cells and increases as the cells differentiate. Unlike mouse TS cells, rat blastocyst-derived stem cells exhibit minimal increases in Ascl2 expression during differentiation and instead expression declines (Fig. 5).
Fig. 5. Ascl2 gene expression in TS cells.
A) Mouse TS cells; B) Rat TS cells; C) Normalized mouse and rat TS cell expression of Ascl2 mRNA. Mouse and rat TS cells were cultured under stem cell or differentiation conditions for the indicated days, harvested, and RNA extracted. qRT-PCR was used to estimate Ascl2 mRNA levels. Transcript levels were normalized to 18S RNA. Ratios of Ascl2 CT values to 18S CT values (mouse TS cell 18S CT value: 13.67 ± 0.058; rat TS cell 18S CT value: 13.63 ± 0.027) at peak expression in mouse TS cells: 1.67; and rat TS cells: 1.89. Bars represent means ± the standard error of the mean. Differentiation expression values significantly different from the stem cell level of expression are indicated with an asterisk (*P<0.05).
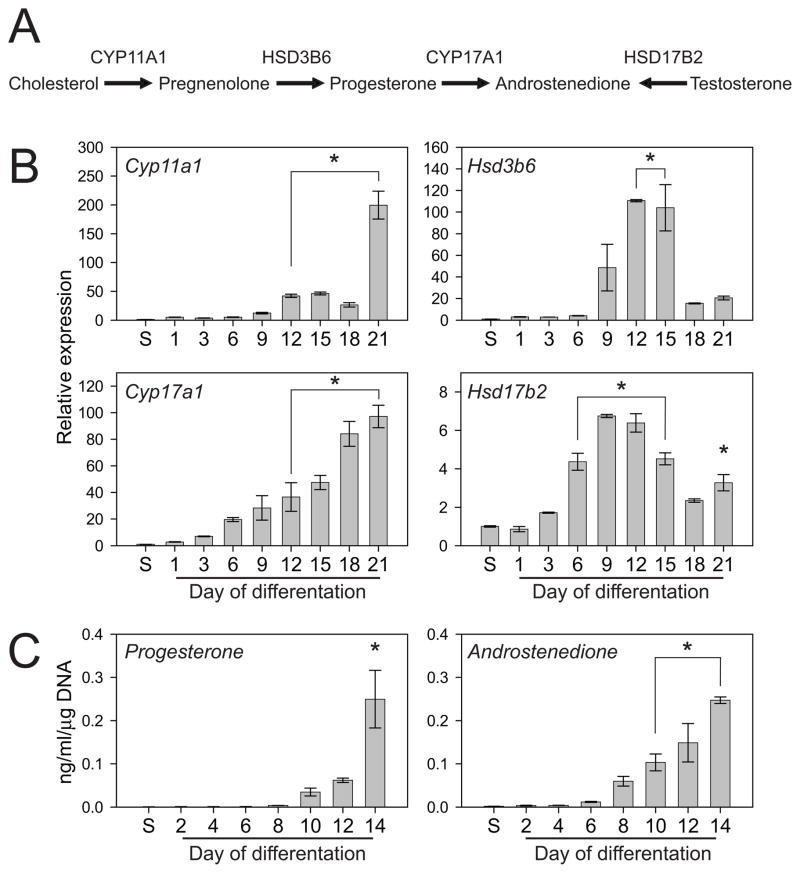
Differentiating rat blastocyst-derived stem cells also exhibited the capacity to express transcripts for mRNAs encoding steroid metabolizing enzymes and produced progesterone and androstenedione (Fig. 6). The time line for steroid hormone biosynthesis was similar to that observed for many of the other differentiation markers.
Fig. 6. Steroidogenic capacity of rat TS cells.
A) Schematic representation of the steroidogenic pathway. B) Rat TS cells were cultured under stem cell or differentiation conditions for the indicated days, harvested, and RNA extracted. qRT-PCR was used to estimate transcript levels for Cyp11a1, Hsd3b6, Cyp17a1, and Hsd17b2. Transcript levels were normalized to 18S RNA. Ratios of tested gene CT value to 18S CT value (18S CT value: 13.63 ± 0.027) at peak expression: Cyp11a1, 1.29; Hsd3b6, 1.41; Cyp17a1, 1.51; Hsd17b2, 1.41. C) Measurements of progesterone and androstenedione production by stem and differentiating rat TS cells. Steroids were measured in medium conditioned by the rat TS cells using radioimmunoassay. Bars represent means ± the standard error of the mean. Differentiation values significantly different from the stem cell level are indicated with an asterisk (*P<0.05).
Collectively, morphological, flow cytometry, and biomarker analyses indicate that rat blastocyst-derived stem cells have the potential to differentiate along each branch of the multi-lineage trophoblast pathway.
Stability of the TS cell phenotype
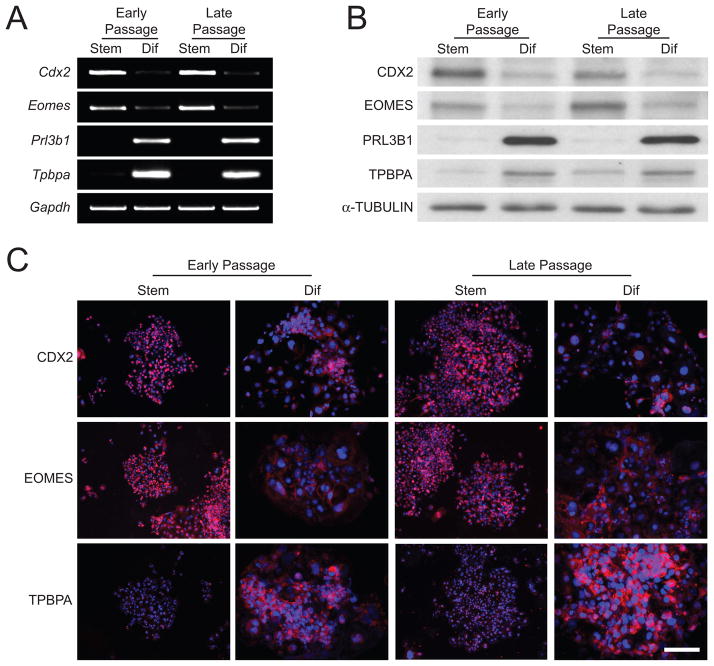
We compared the karyotypes and phenotypes of rat blastocyst-derived stem cells from early and late passages (early: passage 9 versus late: passage 45). Abnormal karyotypes increased in later passages with the euploid cell population ≥ 60%. Early and late passage rat TS cells exhibited similar patterns of stem and differentiated marker gene expression, as assessed by RT-PCR, western blotting, and immunocytochemistry (Fig. 7).
Fig. 7. Stability of the rat TS cell phenotype.
A) Cdx2, Eomes, Prl3b1, and Tpbpa transcript levels measured by RT-PCR in stem cell and differentiated states from early (passage 9) and late (passage 45) passage rat TS cells. Gapdh was used as an internal control. B) CDX2, EOMES, PRL3B1, and TPBPA protein levels measured by western blotting in stem cell and differentiated states from early (passage 9) and late (passage 45) passage rat TS cells. α-Tubulin was used as an internal control. C) CDX2, EOMES, and TPBPA protein expression assessed by immunocytochemistry in stem cell and differentiated states from early (passage 9) and late (passage 45) passage rat TS cells. Scale bar, 250 μm.
DISCUSSION
Early mammalian embryos are a source of stem cell populations, arising from a variety of structures; including inner cell mass, epiblast, extraembryonic endoderm, trophectoderm, and extraembryonic ectoderm (Rossant 2001, 2008; Ralston and Rossant 2005). In the mouse, these stem cell populations can be propagated ex vivo and serve as valuable experimental systems for understanding the regulation of stem cell renewal, differentiation, and fundamental morphogenetic processes involved in tissue organization. In this report, FGF4-dependent stem cell lines were established from rat blastocysts. These cells share many fundamental characteristics with mouse TS cells.
FGF4-dependent rat blastocyst stem cells express key transcriptional regulators required for TS cell self-renewal and pluripotency. Transcripts for Cdx2, Eomes, Id1, Id2, Esrrb, and Elf5 were all upregulated in proliferative rat TS cells and declined precipitously during differentiation. These cells are induced to differentiate by withdrawal of FGF4, heparin, and REF conditioned medium. Differentiation is accompanied by endoreduplication and the activation of genes indicative of each of the mature trophoblast cell lineages, including trophoblast giant cells (Prl3b1, Cyp11a1, Hsd3b, Cyp17a1), invasive trophoblast (Prl2a1, Prl5a1, Prl7b1), spongiotrophoblast (Tpbpa), glycogen cells (Gjb3), and syncytial trophoblast (Gcm1). The self-renewal and differentiation properties of the rat blastocyst-derived stem cells were stable for at least 45 passages. These cellular and molecular attributes are shared with mouse TS cells and provide the basis for classifying the FGF4-dependent rat blastocyst stem cells described in this study as rat TS cells.
All rat TS cells are not alike. A recent report describes the derivation of a TS cell-like population in the absence of FGF4 (Chuykin et al. 2010). Similar methodology led to the establishment of TS-like cells from blastocysts of the common vole (Grigor’eva et al. 2009). The Rcho-1 TS cell model also undergoes stem cell renewal in the absence of exogenous FGF4 (Faria and Soares 1991; Sahgal et al. 2006). Our ability to isolate FGF4-dependent rat TS cells suggests that a conserved TS cell property may be operative. This notion is further supported by Hemberger and colleagues (2010 who identified nests of proliferative TS cells within the developing human placenta containing key TS cell transcriptional regulators (CDX2, EOMES, ELF5) and FGFR2, an essential cellular transducer of FGF4 signals. Do some mammalian blastocysts contain both FGF4-dependent and –independent TS cell populations or alternatively could FGF4-independent TS cells be an aberration? The latter is the probable explanation for the FGF4 independence of Rcho-1 TS cells. These cells are aneuploid and likely possess specific genetic modifications enabling the cells to expand in the absence of FGF4 (Sahgal et al. 2006). In vitro TS cell line derivation represents a selection process dictated by culture conditions. The ES cell culture conditions used by Grigor’eva et al. (2009) and Chuykin et al. (2010) may select for TS cells with epigenetic and genetic modifications resulting in the activation of FGF4/FGFR2 signaling pathways in the absence of exogenous FGF4. Instead, there may be a temporal-dependence on FGF4 or parallel pathways. Early TS cells could progress from an FGF4-independent to an FGF4-dependent phase as they progress. Alternatively, there may be a parallel pathway(s) facilitating trophoblast lineage commitment and TS cell self-renewal in the absence of FGF4. For example, BMP4, a downstream target of FGF4 signaling in TS cells (Gotoh et al. 2005; Murohasi et al. 2010), can induce stem cells derived from the epiblast to develop along the trophoblast lineage (Brons et al. 2007; Hayashi et al. 2010). Additional experimentation is required to resolve these uncertainties.
Based on our analyses rat TS cells are not identical to mouse TS cells. We observed a couple of notable differences in marker gene expression. Sox2, a gene pivotal to mouse TS cell derivation (Avilion et al. 2003) and highly expressed in mouse TS cells, is virtually undetectable in rat TS cells as determined by RT-PCR analysis (present study) and DNA microarray analysis (K. Asanoma and M.J. Soares, unpublished observations). We also noted a profound difference between mouse and rat TS cells in the expression of Ascl2, an early marker of trophoblast differentiation. Ascl2 encodes MASH2 a transcription factor abundantly expressed in the ectoplacental cone and critical for placental development (Guillemot et al. 1994). Mouse TS cells exhibit a dramatic differentiation-dependent induction of Ascl2, whereas, rat TS cells show negligible increases and instead a steady decline in expression during differentiation (Tanaka et al. 1998; present report). Another feature of mouse TS cells is their ability to contribute to all trophoblast lineages of the placenta following reintroduction into the blastocoel environment and transfer to pseudopregnant mice (Tanaka et al. 1998). Our initial attempts to generate chimeric placentas with rat TS cells have not proven successful (81 blastocysts injected with rat TS cells; 41 implanted embryos; no convincing evidence of placental chimerism). These latter results may reflect technical issues that have not been satisfactorily addressed. Alternatively, the differences in gene expression and contributions to placental chimerism may indicate that the rat TS cells described herein do not reflect the same developmental state as do the well-characterized mouse TS cells. The discrepancies in Sox2 and Ascl2 expression may provide insights and represent directions for future investigation.
In summary, we have established cell lines from rat blastocysts that exhibit many characteristics similar to mouse TS cell lines. These rat TS cell lines are valuable new models for analyzing mechanisms controlling TS cell renewal and differentiation.
Research Highlights.
This research describes the isolation and characterization of trophoblast stem (TS) cells from the rat.
We identify similarities and differences in TS cells between the mouse and rat.
These rat TS cell lines represent valuable new in vitro models for analyses of mechanisms controlling TS cell renewal and differentiation.
Supplementary Material
Acknowledgments
This work was supported by grants from the National Institutes of Health (HD20676, HD48861). We thank Dr. Janet Rossant of the Hospital for Sick Children, Toronto, Canada for providing the mouse TS cells, Dr. Jay L. Vivian of the University of Kansas for providing the E14 mouse ES cells, Dr. Kunio Shiota of the University of Tokyo, Japan for providing the TPBPA antibodies, and Dr. Satoshi Tanaka of the University of Tokyo, Japan for helpful advice during early stages of this research. Dr. Masaru Okabe of Osaka University, Japan provided the chμA-EGFP transgenic rats. We also acknowledge Dr. Diane L. Persons and her staff for assistance with the karyotype analysis and Dr. Joyce Slusser for her help with the flow cytometry experiments.
Footnotes
Publisher's Disclaimer: This is a PDF file of an unedited manuscript that has been accepted for publication. As a service to our customers we are providing this early version of the manuscript. The manuscript will undergo copyediting, typesetting, and review of the resulting proof before it is published in its final citable form. Please note that during the production process errors may be discovered which could affect the content, and all legal disclaimers that apply to the journal pertain.
References
- Abell AN, Granger DA, Johnson NL, Vincent-Jordan N, Dibble CF, Johnson GL. Trophoblast stem cell maintenance by fibroblast growth factor 4 requires MEKK4 activation of jun N-terminal kinase. Mol Cell Biol. 2009;29:2748–2761. doi: 10.1128/MCB.01391-08. [DOI] [PMC free article] [PubMed] [Google Scholar]
- Ain R, Canham LN, Soares MJ. Gestational stage-dependent intrauterine trophoblast cell invasion in the rat and mouse: novel endocrine phenotype and regulation. Dev Biol. 2003;260:176–190. doi: 10.1016/s0012-1606(03)00210-0. [DOI] [PubMed] [Google Scholar]
- Alam SMK, Ain R, Konno T, Ho-Chen JK, Soares MJ. The rat prolactin gene family locus: species-specific gene family expansion. Mammalian Genome. 2006;17:858–877. doi: 10.1007/s00335-006-0010-1. [DOI] [PubMed] [Google Scholar]
- An J, Beauchemin N, Albanese J, Abney TO, Sullivan AK. Use of a rat cDNA probe specific for the Y chromosome to detect male derived cells. J Androl. 1997;18:289–293. [PubMed] [Google Scholar]
- Avilion AA, Nicolis SK, Pevny LH, Perez L, Vivian N, Lovell-Badge R. Multipotent cell lineages in early mouse development depend on SOX2 function. Genes Dev. 2003;17:126–140. doi: 10.1101/gad.224503. [DOI] [PMC free article] [PubMed] [Google Scholar]
- Beck S, Le Good JA, Guzman M, Ben Haim N, Roy K, Beerman F, Constam DB. Extraembryonic proteases regulate Nodal signaling during gastrulation. Nat Cell Biol. 2002;4:981–985. doi: 10.1038/ncb890. [DOI] [PubMed] [Google Scholar]
- Brons IG, Smithers LE, Trotter MW, Rugg-Gunn P, Sun B, Chuva de Sousa Lopes SM, Howlett SK, Clarkson A, Ahrlund-Richter L, Pedersen RA, Vallier L. Derivation of pluripotent epiblast stem cells from mammalian embryos. Nature. 2007;448:191–195. doi: 10.1038/nature05950. [DOI] [PubMed] [Google Scholar]
- Buehr M, Meek S, Blair K, Yang J, Ure J, Silva J, McLay R, Hall J, Ying QL, Smith A. Capture of authentic embryonic stem cells from rat blastocysts. Cell. 2008;135:1287–1298. doi: 10.1016/j.cell.2008.12.007. [DOI] [PubMed] [Google Scholar]
- Campbell WJ, Deb S, Kwok SCM, Joslin J, Soares MJ. Differential expression of placental lactogen-II and prolactin-like protein-A in the rat chorioallantoic placenta. Endocrinology. 1989;125:1565–1574. doi: 10.1210/endo-125-3-1565. [DOI] [PubMed] [Google Scholar]
- Chuykin I, Lapidus I, Popova E, Vilianovich L, Mosienko V, Alenina N, Binas B, Chai G, Bader M, Krivokharchenko A. Characterization of trophoblast and extraembryonic endoderm cell lineages from rat preimplantation embryos. PLoS One. 2010;5:e9794. doi: 10.1371/journal.pone.0009794. [DOI] [PMC free article] [PubMed] [Google Scholar]
- Deb S, Hashizume K, Boone K, Southard JN, Talamantes F, Rawitch A, Soares MJ. Antipeptide antibodies reveal structural and functional characteristics of rat placental lactogen-II. Mol Cell Endocrinol. 1989;63:45–56. doi: 10.1016/0303-7207(89)90080-4. [DOI] [PubMed] [Google Scholar]
- Erlebacher A, Price KA, Glimcher LH. Maintenance of mouse trophoblast stem cell proliferation by TGF-μ/activin. Dev Biol. 2004;275:158–169. doi: 10.1016/j.ydbio.2004.07.032. [DOI] [PubMed] [Google Scholar]
- Faria TN, Deb S, Kwok SCM, Talamantes F, Soares MJ. Ontogeny of placental lactogen-I and placental lactogen-II expression in the developing rat placenta. Dev Biol. 1990;141:279–291. doi: 10.1016/0012-1606(90)90384-u. [DOI] [PubMed] [Google Scholar]
- Faria TN, Soares MJ. Trophoblast cell differentiation: establishment, characterization, and modulation of a rat trophoblast cell line expressing members of the placental prolactin family. Endocrinology. 1991;129:2895–2906. doi: 10.1210/endo-129-6-2895. [DOI] [PubMed] [Google Scholar]
- Gotoh N, Manova K, Tanaka S, Murohashi M, Hadari Y, Lee A, Hamada Y, Hiroe T, Ito M, Kurihara T, Nakazato H, Shibuya M, Lax I, Lacy E, Schlessinger J. The docking protein FRS2alpha is an essential component of multiple fibroblast growth factor responses during early mouse development. Mol Cell Biol. 2005;25:4105–4116. doi: 10.1128/MCB.25.10.4105-4116.2005. [DOI] [PMC free article] [PubMed] [Google Scholar]
- Grigor’eva EV, Shevchenko AI, Mazurok NA, Elisaphenko EA, Zhelezova AI, Shilov AG, Dyban PA, Dyban AP, Noniashvili EM, Slobodyanyuk SY, Nesterova TB, Brockdorff N, Zakian SM. FGF4 independent derivation of trophoblast stem cells from the common vole. PLoS One. 2009;4:e7161. doi: 10.1371/journal.pone.0007161. [DOI] [PMC free article] [PubMed] [Google Scholar]
- Guillemot F, Nagy A, Auerbach A, Rossant J, Joyner AL. Essential role of Mash-2 in extraembryonic development. Nature. 1994;371:333–336. doi: 10.1038/371333a0. [DOI] [PubMed] [Google Scholar]
- Guzman-Ayala M, Beh-Haim N, Beck S, Constam DB. Nodal protein processing and fibroblast growth factor 4 synergize to maintain a trophoblast stem cell microenvironment. Proc Natl Acad Sci USA. 2004;101:15656–15660. doi: 10.1073/pnas.0405429101. [DOI] [PMC free article] [PubMed] [Google Scholar]
- Hasuwa H, Kaseda K, Einarsdottir T, Okabe M. Small interfering RNA and gene silencing in transgenic mice and rats. FEBS Letters. 2002;532:227–230. doi: 10.1016/s0014-5793(02)03680-3. [DOI] [PubMed] [Google Scholar]
- Hayashi Y, Furue MK, Tanaka S, Hirose M, Wakisaka N, Danno H, Ohnuma K, Oeda S, Aihara Y, Shiota K, Ogura A, Ishiura S, Asashima M. BMP4 induction of trophoblast from mouse embryonic stem cells in defined culture conditions on laminin. In Vitro Cell Dev Biol Anim. 2010;46:416–430. doi: 10.1007/s11626-009-9266-6. [DOI] [PMC free article] [PubMed] [Google Scholar]
- Hemberger M, Udayashankar R, Tesar P, Moore H, Burton GJ. ELF5-enforced transcriptional networks define an epigenetically regulated trophoblast stem cell compartment in the human placenta. Hum Mol Genet. 2010;19:2456–2467. doi: 10.1093/hmg/ddq128. [DOI] [PubMed] [Google Scholar]
- Ikawa M, Yamada S, Nakanishi T, Okabe M. ‘Green mice’ and their potential usage in biological research. FEBS Letters. 1998;430:83–87. doi: 10.1016/s0014-5793(98)00593-6. [DOI] [PubMed] [Google Scholar]
- Iwatsuki K, Shinozaki M, Sun W, Yagi S, Tanaka S, Shiota K. A novel secretory protein produced by rat spongiotrophoblast. Biol Reprod. 2000;62:1352–1359. doi: 10.1095/biolreprod62.5.1352. [DOI] [PubMed] [Google Scholar]
- Kamei T, Hamlin GP, Chapman BM, Burkhardt AL, Bolen JB, Soares MJ. Signaling pathways controlling trophoblast cell differentiation: Src family protein kinases in the rat. Biol Reprod. 1997;57:1302–1311. doi: 10.1095/biolreprod57.6.1302. [DOI] [PubMed] [Google Scholar]
- Kent LN, Konno T, Soares MJ. Phosphatidylinositol 3-kinase modulation of trophoblast cell differentiation. BMC Dev Biol. 2010;10:97. doi: 10.1186/1471-213X-10-97. [DOI] [PMC free article] [PubMed] [Google Scholar]
- Kidder BL, Palmer S. Examination of transcriptional networks reveals an important role for TCFAP2C, SMARCA4, and EOMES in trophoblast stem cell maintenance. Genome Res. 2010;20:458–472. doi: 10.1101/gr.101469.109. [DOI] [PMC free article] [PubMed] [Google Scholar]
- Li P, Tong C, Mehrian-Shai R, Jia L, Wu N, Yan Y, Maxson RE, Schulze EN, Song H, Hsieh CL, Pera MF, Ying QL. Germline competent embryonic stem cells derived from rat blastocysts. Cell. 2008;135:1299–1310. doi: 10.1016/j.cell.2008.12.006. [DOI] [PMC free article] [PubMed] [Google Scholar]
- Murohashi M, Nakamura T, Tanaka S, Ichise T, Yoshida N, Yamamoto T, Shibuya M, Schleslinger J, Gotoh N. An FGF4-FRS2α-Cdx2 axis in trophoblast stem cells induces BMP4 to regulate proper growth of early mouse embryos. Stem Cells. 2010;28:113–121. doi: 10.1002/stem.247. [DOI] [PubMed] [Google Scholar]
- Natale DRC, Hemberger M, Hughes M, Cross JC. Activin promotes differentiation of cultured mouse trophoblast stem cells towards a labyrinth cell fate. Dev Biol. 2009;335:120–131. doi: 10.1016/j.ydbio.2009.08.022. [DOI] [PubMed] [Google Scholar]
- Ng RK, Dean W, Dawson C, Lucifero D, Madeja Z, Reik W, Hemberger M. Epigenetic restriction of embryonic cell lineage fate by methylation of Elf5. Nature Cell Biol. 2008;10:1280–1290. doi: 10.1038/ncb1786. [DOI] [PMC free article] [PubMed] [Google Scholar]
- Oda M, Shiota K, Tanaka S. Trophoblast stem cells. Methods Enzymol. 2006;419:387–400. doi: 10.1016/S0076-6879(06)19015-1. [DOI] [PubMed] [Google Scholar]
- Quinn J, Kunath T, Rossant J. Mouse trophoblast stem cells. Methods Mol Med. 2006;121:125–148. doi: 10.1385/1-59259-983-4:123. [DOI] [PubMed] [Google Scholar]
- Ralston A, Rossant J. Genetic regulation of stem cell origins in the mouse embryo. Clin Genet. 2005;68:106–112. doi: 10.1111/j.1399-0004.2005.00478.x. [DOI] [PubMed] [Google Scholar]
- Rielland M, Hue I, Renard JP, Alice J. Trophoblast stem cell derivation, cross-species comparison and use of nuclear transfer: new tools to study trophoblast growth and differentiation. Dev Biol. 2008;322:1–10. doi: 10.1016/j.ydbio.2008.07.017. [DOI] [PubMed] [Google Scholar]
- Rossant J. Stem cells from the mammalian blastocyst. Stem Cells. 2001;19:477–482. doi: 10.1634/stemcells.19-6-477. [DOI] [PubMed] [Google Scholar]
- Rossant J. Stem cells and early lineage development. Cell. 2008;132:527–531. doi: 10.1016/j.cell.2008.01.039. [DOI] [PubMed] [Google Scholar]
- Rozen S, Skaletsky HJ. Primer3 on the WWW for general users and for biologist programmers. In: Krawetz S, Misener S, editors. Bioinformatics Methods and Protocols: Methods in Molecular Biology. Humana Press; Totowa, NJ: 2000. pp. 365–386. [DOI] [PubMed] [Google Scholar]
- Saghal N, Canham LN, Canham B, Soares MJ. Rcho-1 trophoblast stem cells. A model system for studying trophoblast cell differentiation. Methods Mol Med. 2006;121:159–178. [PubMed] [Google Scholar]
- Sasaki H. Mechanisms of trophectoderm fate specification in preimplantation mouse development. Develop Growth Differ. 2010;52:263–273. doi: 10.1111/j.1440-169X.2009.01158.x. [DOI] [PubMed] [Google Scholar]
- Simmons DG, Cross JC. Determinants of trophoblast lineage and cell subtype specification in the mouse placenta. Dev Biol. 2005;284:12–24. doi: 10.1016/j.ydbio.2005.05.010. [DOI] [PubMed] [Google Scholar]
- Soares MJ. The prolactin and growth hormone families: pregnancy-specific hormones/cytokines at the maternal-fetal interface. Reprod Biol Endocrinol. 2004;2:51. doi: 10.1186/1477-7827-2-51. [DOI] [PMC free article] [PubMed] [Google Scholar]
- Soares MJ, Chapman BM, Rasmussen CA, Dai G, Kamei T, Orwig KE. Differentiation of trophoblast endocrine cells. Placenta. 1996;17:277–289. doi: 10.1016/s0143-4004(96)90051-x. [DOI] [PubMed] [Google Scholar]
- Soares MJ, Faria TN, Roby KF, Deb S. Pregnancy and the prolactin family of hormones: coordination of anterior pituitary, uterine, and placental expression. Endocr Rev. 1991;12:402–423. doi: 10.1210/edrv-12-4-402. [DOI] [PubMed] [Google Scholar]
- Soares MJ, Konno T, Alam SMK. The prolactin family: effectors of pregnancy-specific adaptations. Trends Endocrinol Metabol. 2007;18:114–121. doi: 10.1016/j.tem.2007.02.005. [DOI] [PubMed] [Google Scholar]
- Tanaka S. Derivation and culture of mouse trophoblast stem cells in vitro. Methods Mol Biol. 2006;329:35–44. doi: 10.1385/1-59745-037-5:35. [DOI] [PubMed] [Google Scholar]
- Tanaka S, Kunath T, Hadjantonakis AK, Nagy A, Rossant J. Promotion of trophoblast stem cell proliferation by FGF4. Science. 1998;282:2072–2075. doi: 10.1126/science.282.5396.2072. [DOI] [PubMed] [Google Scholar]
- Uy GD, Downs KM, Gardner RL. Inhibition of trophoblast stem cell potential in chorionic ectoderm coincides with occlusion of the ectoplacental cavity in the mouse. Development. 2002;129:3913–3924. doi: 10.1242/dev.129.16.3913. [DOI] [PubMed] [Google Scholar]
- Wiemers DO, Shao LJ, Ain R, Dai G, Soares MJ. The mouse prolactin gene family locus. Endocrinology. 2003;144:313–325. doi: 10.1210/en.2002-220724. [DOI] [PubMed] [Google Scholar]
- Yamamoto T, Chapman BM, Johnson DC, Givens CR, Mellon SH, Soares MJ. Cytochrome P450 17 alpha-hydroxylase gene expression in differentiating rat trophoblast cells. J Endocrinol. 1996;150:161–168. doi: 10.1677/joe.0.1500161. [DOI] [PubMed] [Google Scholar]
- Yamamoto T, Roby KF, Kwok SCM, Soares MJ. Transcriptional activation of cytochrome P450 side chain cleavage enzyme expression during trophoblast cell differentiation. J Biol Chem. 1994;269:6517–6523. [PubMed] [Google Scholar]
- Yang W, Klaman LD, Chen B, Araki T, Harada H, Thomas SM, George EL, Neel BG. An Shp2/SFK/Ras/Erk signaling pathway controls trophoblast stem cell survival. Dev Cell. 2006;10:317–327. doi: 10.1016/j.devcel.2006.01.002. [DOI] [PubMed] [Google Scholar]
Associated Data
This section collects any data citations, data availability statements, or supplementary materials included in this article.


