

Abstract
Objective
To examine changes in insulin sensitivity (SI), compensatory acute insulin response (AIR) and β-cell function/disposition index (DI) across puberty in overweight Latino boys and girls.
Study design
253 Latino children followed annually for up to 5 years. Longitudinal modeling was used to examine changes in SI, AIR, DI and fasting and 2-hr glucose and insulin across Tanner stage.
Results
In boys, SI decreased in early puberty with a recovery by late puberty. The compensatory increase in AIR was appropriate in early maturation, but after Tanner 3, AIR declined by more than that predicted from the recovery in SI. For girls, SI decreased in early puberty and across all stages of maturation. In early maturation, there was an appropriate compensatory increase in AIR, but after Tanner 3 AIR decreased. Thus, DI deteriorated across puberty in boys and girls.
Conclusions
In overweight Hispanic youth, compensatory changes in insulin secretion fails after Tanner 3 in both sexes, indicating β-cell deterioration during this critical period of development, thus increasing risk for Type 2 diabetes.
Keywords: Insulin resistance, Beta cell function, puberty, longitudinal, Latino
There has been a global increase in the incidence of pre-diabetes and type 2 diabetes1, and this trend is manifested especially within the Latino community2. In adults, the development of type 2 diabetes is linked to increases in adiposity, particularly increased visceral adiposity, insulin resistance3, and the subsequent inability of pancreatic β-cells to adequately compensate for this insulin resistance4. Adiposity and its associated diabetes risks have also been related to various sex hormones that could explain sex differences in metabolic diseases. In children, this process is likely to be similar but may be exacerbated by the rapid rises in adiposity during the adolescent period, transient insulin resistance that appears during the middle of puberty5,6 and in the increase in sex hormones, in relation to their pre and post pubertal counterparts7.
The pubertal transition is a time during which rapid and dynamic changes occur in various metabolic systems, including hormonal regulations, changes in body fat and its distribution, as well as increased insulin resistance. Insulin sensitivity appears to be highest before the onset of puberty (Tanner stage 1) and reaches its lowest point midway through maturation (Tanner stage 3), approaching near pre-pubertal levels at the end of maturation (Tanner stage 5)6,8. In Caucasian children, insulin secretion is increased to compensate for this transient decrease in insulin sensitivity during adolescence8. Research from our group using longitudinal data investigating the effects of puberty on insulin sensitivity noted a 32% reduction in insulin sensitivity in Caucasian and African American children as they transitioned from Tanner stage 1 to Tanner stage 3, which was consistent across a range of body fatness6.
In a cross-sectional analysis of pubertal effects in overweight Latino children, we have previously shown no differences in insulin sensitivity, acute insulin response, fasting and 2 hour glucose, or β-cell function across the different stages of maturation9. Also, in a limited longitudinal analysis over a 1-year follow-up period in overweight Latino children10, we observed a 24% fall in insulin sensitivity that was partially explained by an increase in body fat but not explained by changes in Tanner stage. Interestingly, subjects in earlier maturation showed a compensatory increase in the acute insulin response (i.e., appropriate beta-cell compensation), whereas subjects in the latter stages of maturation showed poor compensation. The main objective of the current analysis was to expand these earlier findings in a larger sample and over a time frame long enough to encompass the spectrum of maturation. Additionally, we sought to examine whether puberty related changes type 2 diabetes risk factors were different in boys versus girls.
Methods
Participants were enrolled in the SOLAR (Study of Latino Adolescents at Risk) Diabetes Project at the University of Southern California. This study is an ongoing, longitudinal investigation exploring risk factors in a group of boys and girls at high risk for developing type 2 diabetes early in life. Data are collected for each participant annually. We have previously reported several findings from this cohort including a baseline cross-sectional analysis of puberty and a 1-year follow up analysis 9-13.
Data were analyzed from 253 overweight Latino children (143 males, 110 females) recruited through clinics, word of mouth, local newspaper and radio advertisements. Participants met the following study entry inclusion criteria for their initial visit: BMI ≥85th percentile for age and sex 14; age 8–13 years; Latino ancestry (all four grandparents Latino by parental self report); and absence of type 1 or type 2 diabetes using established guidelines2. The participants were not currently taking any medication(s) and did not have a previous clinical diagnosis known to influence body composition, insulin sensitivity, insulin secretion, diet or physical activity. Participants in this longitudinal study attended up to five annual clinic visits. Written informed consent was obtained from both the parents and children before testing began. The Institutional Review Board of the University of Southern California approved this study.
Children were scheduled on an annual basis for an out-patient and an in-patient visit to the University of Southern California General Clinical Research Center (GCRC). For the out-patient visit, children were asked to report at approximately 07:30hr after being instructed to fast overnight and a 2-hour oral glucose tolerance test (OGTT) was performed using a dose of 1.75g glucose/kg body weight (to a maximum of 75 g) as previously described11,12. Blood was sampled for glucose and insulin at times −5 min (“fasting”) and 120 min (“2 h”). Blood samples taken during the OGTT were separated for plasma and immediately transported on ice to the Los Angeles County – USC Medical Center Core Laboratory where glucose was analyzed on a Dimension Clinical Chemistry system using an in vitro Hexokinase method (Dade Behring, Deerfield, IL). The in-patient visit was scheduled within approximately 4 weeks. Children reported to the GCRC in the afternoon and were fasted overnight, with only water permitted after 20:00h. An insulin-modified frequently sampled intravenous glucose tolerance test (FSIVGTT) was used to measure insulin sensitivity, acute insulin response and disposition index as previously described11,12. At time 0, glucose (25% dextrose, 0.3 g/kg body wt) was intravenously administered. Blood samples were collected at time points −15, −5, 2, 4, 8, 19, 22, 30, 40, 50, 70, 100, and 180 min. Insulin (0.02 units/kg body wt, Humulin R [regular insulin for human injection]; Eli Lilly, Indianapolis, IN) was intravenously injected at 20 min. Plasma was analyzed for glucose and insulin, and values were entered into the MINMOD Millennium 2003 computer program (version 5.16) to determine insulin sensitivity, acute insulin response (i.e. insulin area under the curve above basal for the first 10 min of the FSIVGTT), and disposition index (i.e. the product of insulin sensitivity × acute insulin response, an index of pancreatic β-cell function)24. Blood samples from the FSIVGTT were centrifuged immediately for 10 min at 2500 RPM and 8-10°C to obtain plasma, and aliquots were frozen at −70° C until assayed. Glucose was assayed in duplicate on a Yellow Springs Instrument 2700 Analyzer (Yellow Springs Instrument, Yellow Springs, OH) using the glucose oxidase method. Insulin was assayed in duplicate using a specific human insulin ELISA kit from Linco (St. Charles, MO), intra-assay coefficient of variation 4.7-7.0%, interassay coefficient of variation 9.1-11.4%, and cross-reaction with human proinsulin 0%). Height and weight were measured using a beam medical scale and wall-mounted stadiometer, to the nearest 0.1 kg and 0.1 cm, respectively. BMI and BMI percentiles for age and sex were determined using EpiInfo Version 1.1 – 2.0 (CDC, Atlanta, GA). A comprehensive medical history and physical exam including maturation (using the Tanner stage method) was performed by a licensed pediatric health care provider according to the well-established criteria according to pubic hair and breast or genital development16,17. Tanner stage was chosen to capture the changes that occur while adolescents mature physically. Body composition was measured by dual energy x-ray absorptiometry (DEXA) using a Hologic QDR 4500W (Hologic, Bedford, MA).
Statistical Analysis
Data were tested for normality and transformations were made if necessary. Longitudinal Mixed Effects Modeling was used to determine longitudinal patterns across Tanner stages, and to test the influence of sex on each outcome at each Tanner as well as changes across Tanner stages. Linear and nonlinear models were tested to see which was best to describe the development of each outcome. Sex and body composition (total fat and total lean tissue) were the main factors, but age was included as a covariate to account for the age range at each Tanner stage. For the acute insulin response models, insulin sensitivity was also included as a covariate. All modeling was performed using SPSS (Mac version 16); p = 0.05 for all statistics.
Results
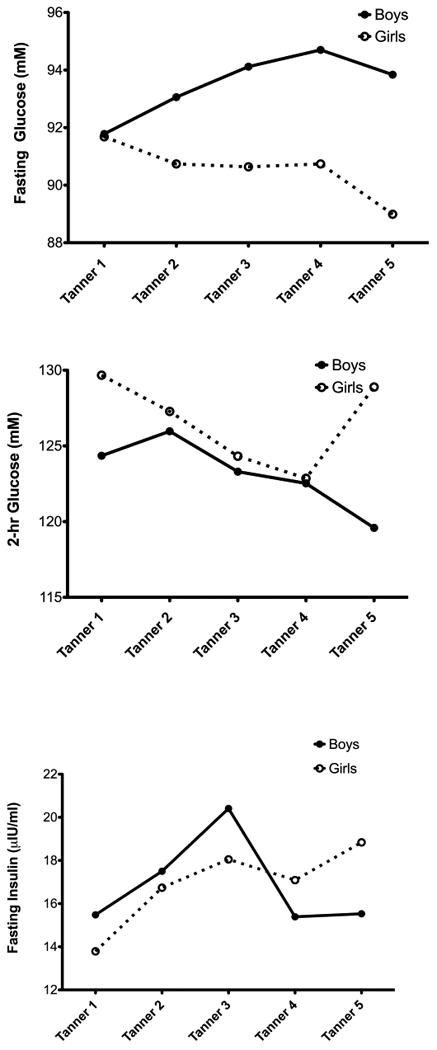
The baseline (Visit 1) characteristics of the 253 participants in the SOLAR cohort are presented in the Table. At baseline, participants included 110 girls and 143 boys. The mean age at baseline was 11.1 ± 1.7 yrs, and analysis included an average of 3.2 ± 1.6 visits per participants for a total of 818 visits. The Table shows the number of observations per Tanner stage. For SI, there was a decrease from Tanner 1-3, after which boys increased in SI, and girls continued to decline (Figure 1, A). This sex difference in the pattern of changes in SI across Tanner stages was significant (p=0.008). There were also significant sex differences in the pattern of change across Tanner stages in the acute insulin response (AIR; Figure 1, B). In particular, during early Tanner stages, boys were relatively stable and girls increased in AIR (p = 0.058). After Tanner stage 3 there was a significant reduction in AIR in both boys and girls. For the disposition index (DI), there was a significant and continuous decline across all Tanner stages in both boys and girls (Figure 1, C). There were no differences between sexes in either level of DI or in rate of decline across Tanner. Boys and girls had opposite trends in the pattern of changes in fasting glucose across Tanner stages (p < 0.001; Figure 2, A), with boys increasing fasting glucose across Tanner stages with girls decreasing (Figure 2, A). For 2-hr glucose, there were different trends in rate of change between boys and girls at early maturity and late maturity (p=0.053 for sex differences). Girls past Tanner 4 increased in 2-hr glucose, and boys continued a linear decline from earlier Tanner stages (Figure 2, B). For fasting insulin, Figure 2, C suggests that boys and girls increased at a similar rate from Tanner 1-3, and then diverged with girls decreasing and boys increasing. However, this sex interaction was not significant in this model.
Table 1. Sample Characteristics (N = 253).
| Boys (N = 143) | Girls (N = 110) | |
|---|---|---|
| Baseline characteristics | M+SD | M+SD |
| Age (years) | 11.2±1.6 | 11.0±1.8 |
| DEXA | ||
| Total Fat Mass (kg) | 24.7±1.1 | 25.5±1.0 |
| Total Lean Mass (kg) | 37.8±1.0 | 35.7±1.0 |
| BMI (kg/m2) | 29.7±6.1 | 30.0±6.0 |
| BMI Percentile | 97.1±4.2 | 94.8±11.7 |
| BMI Z-score | 2.1±0.5 | 2.0±0.6 |
| Tanner at baseline | N (%) | N (%) |
| 1 | 78 (54.5) | 26 (23.6) |
| 2 | 45 (31.5) | 26 (23.6) |
| 3 | 7 (4.9) | 16 (14.5) |
| 4 | 7 (4.9) | 26 (23.6) |
| 5 | 6 (4.2) | 16 (14.5) |
| Total number of observations | 448 | 370 |
| Observations by Tanner | N (%) | N (%) |
| 1 | 147 (32.8) | 35 (9.5) |
| 2 | 116 (25.9) | 57 (15.4) |
| 3 | 45 (10.0) | 57 (15.4) |
| 4 | 68 (15.2) | 99 (122) |
| 5 | 72 (16.1) | 122 (33.0) |
Figure 1. Changes in Insulin Sensitivity, Acute Insulin Response and Disposition Index by Tanner Stage in Boys and Girls (data adjusted for age and body composition).
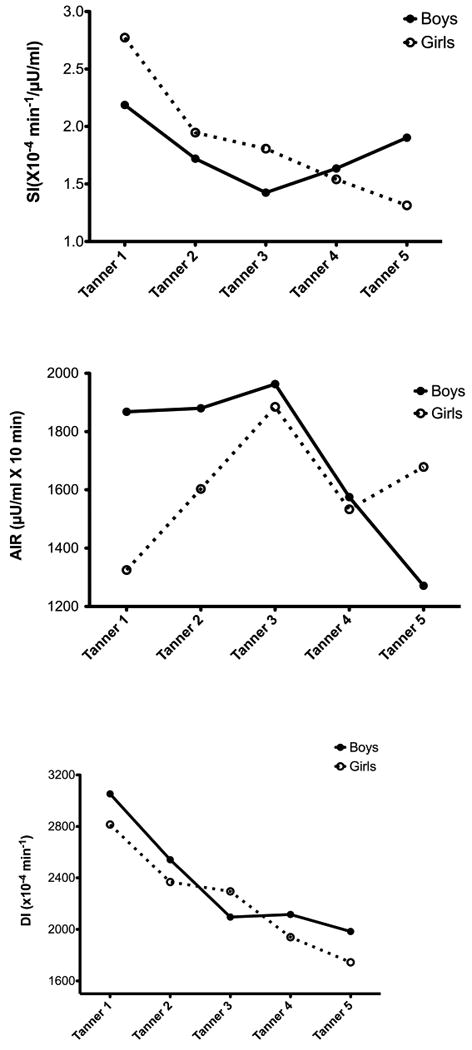
Figure 2. Changes in Fasting Glucose, 2-hour glucose and Fasting Insulin by Tanner Stage in boys and girls (data adjusted for age and body composition).
Discussion
The findings from this analysis indicate that the compensation to pubertal insulin resistance in obese Hispanic children was different by sex in the early stages of maturation, though the end result of a declining disposition index across all stages of puberty was consistent in boys and girls. For boys in early maturation, there was only a marginal improvement in acute insulin response, despite progressive insulin resistance. After Tanner stage 3, insulin sensitivity improved, but acute insulin response declined by more than would be predicted from the improvement in insulin sensitivity. In girls, insulin sensitivity declined across all stages of maturation. In early maturation, acute insulin response was compensating for this decline in insulin sensitivity, but after Tanner 3 acute insulin response did not compensate. Collectively these data show that the compensation to pubertal insulin resistance prior to Tanner 3 was different in boys and girls, but after Tanner stage 3 there was a failure to compensate to changes in insulin sensitivity contributing to an overall progressive decline in the disposition index and beta-cell function in both sexes.
Decreased insulin sensitivity and impaired beta-cell function are two critical components in the pathogenesis of type 2 diabetes. In children, this risk is exacerbated by growth related increases in adiposity and by the transient insulin resistance of puberty. Our findings suggest that this risk profile is further compounded by a pubertal “trigger” as evidenced by the failure to compensate to progressive insulin resistance after Tanner stage 3. Prior cross-sectional studies have showed that the increase in insulin resistance associated with puberty is consistent whether assessed by either the glucose clamp technique or the minimal model method 5,7,18-21. However, there is a paucity of longitudinal research investigating this association. Most studies of insulin sensitivity and insulin secretion in youth have not divided puberty into stages based on sexual maturation and, thus, have not been able to determine how insulin/glucose dynamics changes during the course of puberty. This study investigated the longitudinal effects of insulin sensitivity and insulin secretion across all five Tanner stages in overweight at risk for Type 2 diabetes Latino youth, with positive family history for Type 2 diabetes11. The present study shows significant longitudinal patterns in insulin/glucose dynamics across the course of puberty that these patterns are clearly affected by age and body composition, and that sex is often an effect modifier of these patterns.
Our findings are in part consistent with results of previous longitudinal studies22, 6, 23,18. The Hannon et al22 study used the hyperinsuliemic-eugycemic clamp to assess insulin sensitivity and showed that despite a 50% decrease in insulin sensitivity as participants transitioned from “pre-puberty” to “puberty”, the disposition index was maintained via a compensatory increase in insulin secretion. However, this study was conducted with a very small sample size (n=9) and all but one participant was Caucasian. In a prior longitudinal study, we used the frequently sampled intravenous glucose tolerance test in a large sample of participants (n=60) consisting of a mixed overweight population of Caucasian and African-American youth6. This study found that even after controlling for adiposity as measured by DEXA, age and sex, children transitioning from Tanner 1 to 3 had a 32% decrease in insulin sensitivity and an increase in fasting glucose, insulin and acute insulin response, compared with children remaining at Tanner stage 1 over the same 2-year period. We later expanded on these findings in a larger sample (n=92) across the spectrum of all pubertal stages and showed that once we adjusted for sex, baseline age and fat mass, insulin sensitivity (in both the Caucasian and African American youth) decreased significantly as participants transitioned into puberty but recovered once they reached Tanner stage 523. Acute insulin response significantly decreased across Tanner stage but disposition index decreased across puberty in the African American youth only. These results suggest that African American but not Caucasian children have declining β-cell function during puberty23. Hannon et al22 used the hyperinsuliemic-eugycemic clamp to assess the effects of Tanner stage on sex, ethnicity and BMI on insulin resistance in a large sample (n=357) of Caucasian and African American children. Results of this study demonstrated significant sex differences. Insulin resistance significantly increased from Tanner 2 but returned to near pre-pubertal levels at Tanner 5 and adiposity did not explain the insulin resistance of puberty.
Despite the current and prior longitudinal studies during puberty, there is a scarcity of data that have followed children through to the progression of type 2 diabetes. Therefore it is difficult to project how pubertal changes in insulin resistance might related to risk of transition to type 2 diabetes. One longitudinal study by Weiss et al24 reported data over 2 years from 117 children of whom 8 progressed from impaired glucose tolerance to type 2 diabetes. Severity of obesity, African American ethnicity and glucose intolerance were predictive of future type 2 diabetes, whereas fasting glucose, insulin and c-peptide were not predictive. The specific influence of pubertal insulin resistance and direct measures of insulin sensitivity and insulin secretion were not examined. More data are needed extending observational analysis to the development of type 2 diabetes.
The present study is unique in several aspects, and significantly expands our knowledge of the longitudinal trends in diabetes risk factors across puberty. A special feature of the current study is that longitudinal mixed effects modeling that was used to analyze the data, allowing us to examine these effects with robust models using multiple time point assessments. The study included over 200 Latino participants in a relatively narrow age range with over 800 hospital visits, with repeated rigorous measures of insulin and glucose indices using the Minimal Model and an FSIVGT and of body composition by DEXA. However, although we regard the homogeneity of our sample as a strength, it should be noted that our findings may be specific to our unique study population and therefore cannot be generalized. The clinical implication from our findings is that maintenance of insulin secretion at and following Tanner stage 3 might be critical for protecting obese Hispanics from type 2 diabetes, so in addition to weight loss, reducing the insulin burden during this critical period of development (eg reduced sugar consumption) might be a useful preventive strategy.
Acknowledgments
We are grateful to the project managers, Christina Ayala and Quintilia Avila, to the nurses and nutrition staff at the USC-GCRC. Finally, we express our sincerest gratitude to the participants and their families for making this study possible.
Supported by R01 DK 59211, M01 RR 00043; the American Diabetes Association, Mentor-Based Postdoctoral Fellowship.(F31-DK081276 to C.T-C. under the sponsorship of M.G.), and the USC Center for Transdisciplinary Research on Energetics and Cancer (U54 CA 116848).
Footnotes
The authors declare no conflicts of interest.
Publisher's Disclaimer: This is a PDF file of an unedited manuscript that has been accepted for publication. As a service to our customers we are providing this early version of the manuscript. The manuscript will undergo copyediting, typesetting, and review of the resulting proof before it is published in its final citable form. Please note that during the production process errors may be discovered which could affect the content, and all legal disclaimers that apply to the journal pertain.
References
- 1.King H, Aubert RE, Herman WH. Global burden of diabetes, 1995-2025: prevalence, numerical estimates, and projections. Diabetes Care. 1998;21:1414–31. doi: 10.2337/diacare.21.9.1414. [DOI] [PubMed] [Google Scholar]
- 2.American Diabetes Association. Type 2 diabetes in children and adolescents. Pediatrics. 2000;105:671–680. doi: 10.1542/peds.105.3.671. [DOI] [PubMed] [Google Scholar]
- 3.Boyke EJ, Fujimoto WY, Leonetti DL, Newell-Morriss LL. Visceral adiposity and risk of type 2 diabetes. Diabetes Care. 2000;23:465–472. doi: 10.2337/diacare.23.4.465. [DOI] [PubMed] [Google Scholar]
- 4.Khan SE. The Importance of β-Cell Failure in the Development and Progression of Type 2 Diabetes. J Clin Endocrinol Metab. 2001;86:4047–4058. doi: 10.1210/jcem.86.9.7713. [DOI] [PubMed] [Google Scholar]
- 5.Caprio S, Bronson M, Sherwin RS, Rife R, Tamborlane WV. Co-existence of severe insulin resistance and hyperinsulinema in pre-adolescent obese children. Diabetologica. 1996;39:1489–1497. doi: 10.1007/s001250050603. [DOI] [PubMed] [Google Scholar]
- 6.Goran MI, Gower BA. Longitudinal study on pubertal insulin resistance. Diabetes. 2001:2444–2450. doi: 10.2337/diabetes.50.11.2444. [DOI] [PubMed] [Google Scholar]
- 7.Amiel SA, Sherwin RS, Simonson DC, Lauritano AA, Tamborlane WV. Impaired insulin action in puberty: a contributing factor to poor glycemic control in adolescents with diabetes. N Engl J Med. 1986;315:215–219. doi: 10.1056/NEJM198607243150402. [DOI] [PubMed] [Google Scholar]
- 8.Caprio S, Plewe G, Diamond MP, Simonson DC, Boulware S, Sherwin RS, Tamborlane WV. Increased insulin secretion in puberty: a compensatory response to reductions in insulin sensitivity. J Pediatr. 1989;114:963–967. doi: 10.1016/s0022-3476(89)80438-x. [DOI] [PubMed] [Google Scholar]
- 9.Ball GDC, Weigensberg MJ, Curz ML, Shaibi GQ, Kobaissi HA, Goran MI. Insulin sensitivity, insulin secretion and β-cell function during puberty in overweight Hispanic children with a family history of type 2 diabetes. IJO. 2005;29:1471–1477. doi: 10.1038/sj.ijo.0803044. [DOI] [PubMed] [Google Scholar]
- 10.Goran MI, Shaibi GQ, Weigensberg MJ, Davis JN, Cruz ML. Deterioration Of Insulin Sensitivity And Beta-Cell Function In Overweight, Insulin Resistant Hispanic Children: A Longitudinal Assessment. International Journal of Pediatric Obesity. 2006;1:139–145. doi: 10.1080/17477160600780423. [DOI] [PMC free article] [PubMed] [Google Scholar]
- 11.Kelly LA, Lane CJ, Weigensberg MJ, Koebnick C, Roberts CK, Davis JN, Toledo-Corral, Shaibi GQ, Goran MI. Parental History and risk of Type 2 Diabetes in overweight Latino adolescents: A longitudinal Analysis. Diabetes Care. 2007;30:2700–2705. doi: 10.2337/dc07-0050. [DOI] [PubMed] [Google Scholar]
- 12.Weigensberg MJ, Cruz ML, Goran MI. Association between insulin sensitivity and post-glucose challenge plasma insulin values in overweight Latino youth. Diabetes Care. 2003;26:2094–2099. doi: 10.2337/diacare.26.7.2094. [DOI] [PubMed] [Google Scholar]
- 13.Goran MI, Bergman RN, Avila Q, Watkins M, Ball GD, Shaibi GQ, Weigensberg MJ, Cruz ML. Impaired glucose tolerance and reduced beta-cell function in overweight Latino children with a positive family history for type 2 diabetes. J Clin Endocr Met. 2004;89:207–12. doi: 10.1210/jc.2003-031402. [DOI] [PubMed] [Google Scholar]
- 14.Centers for Disease Control and Prevention. CDC growth Charts. Atlanta, GA: U.S. Department of Health and Human Services, Centers for Disease Control and Prevention, National Center for Health Statistics; 2000. U.S. Publ. no. 314. [Google Scholar]
- 15.Elbein SC, Wegner K, Kahn SE. Reduced beta-cell compensation to the insulin resistance associated with obesity in members of white familial type 2 diabetic kindreds. Diabetes Care. 2000;23:221–227. doi: 10.2337/diacare.23.2.221. [DOI] [PubMed] [Google Scholar]
- 16.Marshall WA, Tanner JM. Variations in pattern of pubertal changes in girls. Arch Dis Child. 1969;44:291–303. doi: 10.1136/adc.44.235.291. [DOI] [PMC free article] [PubMed] [Google Scholar]
- 17.Marshall WA, Tanner JM. Variations in the pattern of pubertal changes in boys. Arch Dis Child. 1970;45:13–23. doi: 10.1136/adc.45.239.13. [DOI] [PMC free article] [PubMed] [Google Scholar]
- 18.Moran A, Jacobs DR, Steinberger J, Hong Cp, Prineas R, Luepker R, Sinako AR. Insulin resistance during puberty: results from clamp studies in 357 children. Diabetes. 1999;48:2039–2044. doi: 10.2337/diabetes.48.10.2039. [DOI] [PubMed] [Google Scholar]
- 19.Cook JS, Hoffman RP, Stene MA, Hansen JR. Effects of maturational stage on insulin sensitivity during puberty. J Clin Endocrinol Metab. 1993;77:725–730. doi: 10.1210/jcem.77.3.7690363. [DOI] [PubMed] [Google Scholar]
- 20.Travers SH, Jeffers BW, Bloch CA, Hill JO, Eckel RH. Gender and Tanner stage differences in body composition and insulin sensitivity in early pubertal children. J Clin Endocrinol Metab. 1995;80:172–178. doi: 10.1210/jcem.80.1.7829608. [DOI] [PubMed] [Google Scholar]
- 21.Amiel SA, Caprio S, Sherwin RS, Plewe G, Haymond MW, Tamborlane WV. Insulin resistance of puberty: a defect restricted to peripheral glucose metabolism. J Clin Endocrinol Metab. 1992;72:277–282. doi: 10.1210/jcem-72-2-277. [DOI] [PubMed] [Google Scholar]
- 22.Hannan TS, Janosky J, Arslanian SA. Longitudinal study of physiologic insulin resistance and metabolic changes of puberty. Pediatr Res. 2006;60:759–763. doi: 10.1203/01.pdr.0000246097.73031.27. [DOI] [PubMed] [Google Scholar]
- 23.Ball GDC, Hung TT, Gower BA, Curz ML, Shaibi GQ, Weigensberg MJ, Goran MI. Longitudinal changes in insulin sensitivity, insulin secretion and beta-cell function during puberty. J Pediatr. 2006;148:16–22. doi: 10.1016/j.jpeds.2005.08.059. [DOI] [PubMed] [Google Scholar]