

Abstract
Background
We aim to determine the economic and social impact of typical interventions proposed by the public health officials and preventive behavioral changes adopted by the private citizens in the event of a “flu-like” epidemic.
Method
We apply an individual-based simulation model to the New River Valley area of Virginia for addressing this critical problem. The economic costs include not only the loss in productivity due to sickness but also the indirect cost incurred through disease avoidance and caring for dependents.
Results
The results show that the most important factor responsible for preventing income loss is the modification of individual behavior; it drops the total income loss by 62% compared to the base case. The next most important factor is the closure of schools which reduces the total income loss by another 40%.
Conclusions
The preventive behavior of the private citizens is the most important factor in controlling the epidemic.
Keywords: Computational Epidemiology, Demographics, Intervention Strategies, Antiviral Distribution
1 Introduction
The threat of a global disease outbreak, such as pandemic Influenza, is an important public health problem facing the world. The current potential for a H1N1 or H5N1 pandemic underscores the conspicuous risk to public health and global economy. In order to plan and respond proportionately to such pandemics, public health officials need to have a systematic assessment of the socio-economic and health impact of the disease, interventions and other mitigation efforts [11, 19, 43]. Policy makers desire an understanding of intervention possibilities and pitfalls for limiting pandemic risk and assisting vulnerable populations [24]. These interventions may include social distancing, a prioritized governmental distribution of vaccines and antiviral medications, and pharmaceutical consumption in the private sector [50, 14]. Individuals may possess strong private incentives to avoid the disease, and are willing to self impose social distancing measures. Traditional models in epidemiology and economics focus on the prevalence of the disease and the cost of treatment respectively but the cost of disease avoidance should be considered as well [43]. With the help of simulations, current research aims to fill this gap and capture the cost of the disease avoidance caused by the modified behavior [42].
The focus of this research is to understand how individuals in various demographic classes react to an outbreak given possible behavioral changes and how this modified behavior affects the spread of the disease. It is well known that people adapt their behavior in response to a threat posed by a potential epidemic, but a systematic study of this kind of behavior has not been undertaken to date. Our previous work shows that certain behavioral changes have potentially harmful side effects during outbreaks [4]. Personal behavior during an epidemic depends on an individuals’ socio-economic status as well as their perception of the epidemic in the community [25]. People maximize their well being by choosing levels of prevention and strategies with respect to their own constraints. A national survey by the Harvard School of Public Health Project was recently conducted to gauge public reaction to social distancing and other non-pharmaceutical interventions that may be enforced during a severe pandemic [11]. The survey highlights the fact that different demographics of people will react differently to the interventions. This research undertakes the important task of measuring the economic and social effects of different social distancing and pharmaceutical interventions that are normally adopted by the public health officials and private citizens in an effort to contain a “flu-like” epidemic. The importance and effects of school closures, antiviral distributions, and private social distancing measures are specifically analyzed. It looks into the fairness of different intervention strategies by examining their economic impact within specific demographic classes. To understand the full impact of a disease, it is important to calculate not only the cost of the disease but also the cost of disease avoidance. The results identify population strata by demographics that are likely to win or lose under such policies. A number of recent reports and Hurricane Katrina have underscored the importance of this kind of work [40, 10].
2 Methodology
We use an individual-based modeling environment called Simdemics [5] for simulating epidemic outbreaks. Simdemics is a network-based epidemiological modeling framework that simulates the spread of a phenomenon across a social contact network. Simdemics builds upon individual-based mobility, activity, and disease transmission models, see Table 1. This type of model allows one to perform studies at an individual level to evaluate the effects of public policy during an emerging infectious disease. See [3, 27, 21, 22, 23, 38] for recent results and discussion on disaggregate models. The simulation approach taken in this study relies on three interacting models: Step 1. Statistical models for the creation of synthetic populations, Step 2. Activity-based model for creating time varying social contact networks, Step 3. Model of disease transmission. To maintain the readability of the paper, these steps are described, in detail, in the Appendix as well as a conference version of this paper [8].
Table 1.
Models and modeling approaches used in Simdemics.
3 The Experimental Design and Its Rationale
3.1 Demographic Classes and Intervention Strategies
This study estimates the differences in economic and social impact on demographic classes caused by various public antiviral distribution and social distancing strategies as well as private behavioral strategies. The study simulates a “flu-like” epidemic in the New River Valley (NRV) region of Southwest Virginia, containing about 150,000 people, using an individual-based simulation model. The synthetic population is generated from US Census data as provided in PUMA (Public Use Microdata Area) and SF3 files (www.census.gov). Demographic classes are based on the three social factors, i.e., household income, family size and the age of the individual. It has been shown that these factors are highly correlated with most other demographic factors such as education, ethnicity, employment etc. and are hence appropriate for stratification. Individuals are aggregated into demographic classes for interpretation of outputs.
Income-based classes are low, medium and high and they correspond to families who make less than $25,000, $25,000–$75,000, and more than $75,000 per year respectively. Similar income thresholds have been used by other researchers [11]. Classes based on household size are defined as those containing a single-member, two to three members, and more than three members. Age-based categories are juveniles (0–18), working adults (19–64), and retirees (65+). Demographic classes were formed through combinations of each of the three factors resulting in a total of 27 different classes [47]. However, 3 of the 27 classes were empty and hence are excluded from the tables. Table 2 displays the categories as well as the proportion of people (in parentheses) in each demographic class. The results for the middle groups (e.g., middle income, small families, and adults) are presented in the appendix (Additional Analysis Section) to simplify the reporting of the more interesting groups on the extremes of each demographic factor. In Table 3, the column “class” lists the classes with an exact count of the individual’s in the class. If there are any adult children living in with their parents, they are counted as adults and assumed to behave as adults.
Table 2.
Demographic classes based on age, household income and size
| HHIncome (population frac) | HHSize (population frac) | Age (population frac) |
|---|---|---|
| 0–25K (0.32) Poor | 1 (0.11) Single | 0–18 (0.20) Child |
| 25K–75K (0.52) Medium Inc. | 2–3 (0.54) Sm. Family | 19–64 (0.69) Adult |
| 75K+ (0.16) High Inc. | 4+ (0.35) Lg. Family | 65+ (0.11) Elderly |
Table 3.
Demographic classes and their respective thresholds to trigger public and private intervention strategies
| Demographic Class (population) | Global Threshold (% sick in the society) | Local Threshold (% sick in class) |
|---|---|---|
| Low Income - No Action | ||
| All family sizes and ages (48,493) | None | None |
| High Income - Buy antivirals | ||
| Single, Elderly (131) | 1 | 2 |
| Lg.Fam., Child (4,430) | .5 | None |
| Lg.Fam., Elderly (275) | 1.5 | 1 |
| Governmental - Antivirals and close schools | ||
| Public | 1 | None |
3.1.1 Individual Strategies
People with different socio-economic background follow different preventive strategies to accommodate their personal constraints. These strategies are based on how people perceive the society is doing as well as how their own peer group/demographic class is doing. We project that change in individual behavior is triggered by the prevalence level of the virus in the overall society (global prevalence) as well as within one’s own demographic class (local prevalence). To model that, thresholds for these two factors were set for each class as shown in Table 3. The basic principles followed in setting these thresholds are (i) the higher the income level, the lower is the overall tolerance for disease risk and hence lower the global threshold, (ii) children have the lowest thresholds since adults are protective of the children and monitor reports of widespread illnesses and absenteeism among children, and (iii) adults have the highest thresholds since they are the most healthy group. As the main income earners, adults have to take more risk with their health although some individuals with a high risk of complications may take less risk with their health. The private interventions are triggered as soon as the local or the global prevalence threshold is met for the class. The threshold is reached based on the aggregated number of new infections in a day exceeding a tolerable limit. Please note that only one set of parameters has been considered here based on our best guess. In real life, there is likely to be a variation in the application of these thresholds across people.
This threshold measure assumes active surveillance, monitoring, and reporting of infection counts per day by public health officials. Three interventions available to the people are: buy antivirals for prophylactic use1; eliminate unnecessary trips such as trips to shopping malls and recreational facilities; and rely on protection resulting from other people taking antivirals. The model assumes that when the threshold is crossed, all affluent household members choose the first option, i.e., purchase over the counter antivirals with a low .3 efficacy for prophylactic use because (1) they can afford to spare resources for the antivirals, and (2) this strategy is least intrusive to their lifestyle. Members of the middle income class choose the second strategy and modify their daily activity schedule by eliminating unnecessary trips. This social distancing technique reduces their potential contact with the infected individuals in the society. The individuals from the poorest income class choose to rely on protective steps being taken by the other members of the society. They find it too expensive to purchase antivirals; and they already take very few unnecessary trips. We assume that all individuals in their demographic classes strictly follow their respective strategies. This may not be true in reality.
Table 3 tabulates the private strategies implemented by the different income classes and the measurements used for global and local thresholds.
3.1.2 Public Strategies
We simulate two common strategies available to public health officials; distribution of antivirals to individuals and school closures, see Table 4. The trigger threshold for the public intervention is set at 1% of the total population becoming infected. The public stockpile of antiviral courses is limited to 10,000.2 The antiviral courses are distributed to the individuals based on the following four selection techniques; randomly selected individuals, poorest individuals, first sick individuals, and those with the highest simulation infection risk probability (high-risk).
Table 4.
Government and Private Intervention Descriptions
| Intervention | Description |
|---|---|
| Poor | Antivirals given to the 10,000 poorest individuals. |
| Random | Antivirals given randomly to 10,000 individuals. |
| High Risk | Antivirals given to the 10,000 most often infected in previous simulations. |
| Sick | Antivirals given to the first 10,000 that fall sick. |
| CS | Schools are closed for a period of two weeks. |
| Social Distancing | Eliminate unnecessary trips and activities. |
The simulation infection probability of an individual is defined as the probability with which the individual gets infected when the disease starts from a random person in the population [6]. We empirically estimate the infection probability of all individuals in the population by running one hundred simulation runs of the epidemic where each run starts from a different random individual. To calculate the percentage, we determine the number of times an individual gets sick and divide it by the total number of runs. For example, if an individual got infected five times during the hundred runs, his simulation infection probability was 0.05. Under the high infection risk strategy, the antiviral courses were distributed to those who had the highest risk value as calculated by the above procedure. This group is the optimal group to work with, as it is the most likely set of individuals to become infected. While identifying this group would not be implementable, it provides a benchmark for strategy comparisons with less optimal groups. It is important to point out that this group does not include people who are at high risk of complications such as obese, diabetics, pregnant, HIV+ etc. The only demographic used to distribute public antivirals is the income level. Note that under all the above strategies, the public stockpile of antivirals is distributed only after the global threshold is met.
For the close school strategy, the trigger threshold is also set at 1% of the total population becoming infected. The schools are kept closed for a period of two weeks. When the schools are closed, at least one adult has to be home to care for young children, age 13 or less, who do not remain alone at home. In the case of both parents working or all adults working, one working parent/adult stays home. We assume that 75% of the children stay at home when their schools are closed. The other 25% students follow their after school activities and hence mix with other children outside the school environment. The 75/25 split is based on the Activity Survey Data described in the Appendix. However it is possible that this split is different when the schools close during the normal term.
Overall, there is a limited mixing of children during the school closure in comparison to the regular school environment. We try various combinations of interventions including school closure and distribution of public antiviral courses, resulting in nine distinct governmental strategies. Refer to Table 5 for previous work investigating these governmental strategies and individual behaviors.
Table 5.
Related work on behavior and policy
4 Results
In order to assess the economic impact of various intervention strategies by demographic class, we develop seven distinctive scenarios based on individual and governmental actions. Five of these scenarios involve private and public interventions. A base case is conducted to determine the economic loss and the size of the epidemic in the absence of any interventions. Finally, a scenario is developed where no government intervention takes place and only private strategies are implemented. This scenario helps isolate the socioeconomic effect of the private strategies. The economic costs for each strategy are derived from direct, indirect, preventive and treatment costs. The direct costs are composed of income losses due to an ill worker not reporting to work. This cost combines personal and corporate economic losses for salaried, wage, and self-employed workers. It is true that all sick leaves do not necessarily result in income loss to the individuals due to the availability of paid sick leave for many individuals. However, sick leave still results in productivity loss which causes loss of income to the society as a whole. Therefore we count all income losses in our calculation. Direct costs also include the cost of treatment such as outpatient visits, prescription costs, co-payments, hospitalization etc. The indirect costs are due to parents staying home to care for ill children. The preventive costs are composed of the governmental actions of distributing 10,000 antiviral kits and closing schools for a two week period. The costs of closing schools is determined by the lost wages for parents staying home to provide child care and workers associated with the school system. Costs for treating infected individuals through hospitalizations and outpatient care are calculated based on [37] and provided as health care costs. Also the rates of outpatient care and hospitalizations of the sick were based on the fractions given in [37].
The costs for individuals in each strategy are aggregated and compared to the base case to describe the economic benefits of each strategy to each demographic group as well as the amount of money spent by the government per person in comparison to the base case epidemic. In all of the scenarios, the interventions by the government and the modified behavior of the private citizens greatly reduced the income loss and the number of infections during the course of the epidemic. Even the least effective intervention diminished the total size of the epidemic to less than half of the base epidemic. The prevalence of the disease at its height was reduced by two thirds. It is important to note that the interventions not only caused the peaks to drop significantly but also delayed the outbreak and reduced the duration of the epidemic. The epidemic curves for each social class and for each strategy is shown in the Appendix. Please note that all strategies reported here include behavior modifications by the private citizens. The only exception is the base case.
4.1 Strategy Label Description
We now describe the strategies that are followed by the public health officials and private citizens in this study. Under all scenarios except the base case, the private citizens follow their respective strategies whenever their local or global thresholds are met. The entire public stockpile of antivirals is distributed by the government to the following people: poorest, highest risk, first sick, and randomly selected individuals. These are labeled as poor (P), high risk (HR), sick(S) and random(R) strategies. CS Strategy closes schools for 14 consecutive days. CS+R strategy refers to closing schools as well as distributing the public stockpile of antivirals to the population at random. Similarly, CS+P, CS+HR and CS+S refer to closing schools plus giving public antivirals to the poorest, highest risk and sick people respectively. NoGovt strategy implies that there is no intervention by the government, i.e., no antivirals are distributed and the schools remain open. This strategy helps isolate the effects of individual behavior.
4.2 Effect of Preventive Behavior
The results show that the most significant reduction in the income loss and the size of the epidemic was caused by the preventive behavior undertaken by the individuals. This can be seen by observing Table 6 where the NoGovt strategy performs 60% better in terms of the total costs and 65% better in terms of attack rate compared to the base strategy. Under the NoGovt strategy, only the private citizens modified their behavior once alerted to the fact that a number of peers in their demographic class and in the society have been infected. In the NoGovt strategy, there is no intervention by the government. The strategies with school closures and antiviral distributions along with preventive behaviors only slightly outperform NoGovt. This implies that the private behavior modification was the main factor in reducing the income loss and the size of the epidemic in all these strategies.
Table 6.
Important statistics by strategy (Std. Dev. based on one hundred simulation runs)
| Strategy | Attack rate (σ) | Sick days | Indirect income loss ($ mil) due to care-taking | Direct income loss ($ mil) due to illness | Preventive costs ($ mil) Govt. | Preventive costs ($ mil) private | Hospital & outpatient cost ($ mil) | All costs ($ mil) | Benefits ($ mil) | $ Spent Per Person Saved |
|---|---|---|---|---|---|---|---|---|---|---|
| Base | 0.732 (±.001) | 581567 | 10.43 (±.011) | 30.32 (±.031) | 0 | 0 | 25.07 (±.035) | 65.82 (±.077) | 0 | 0 |
| NoGovt (no AV dist.) | 0.263 (±.007) | 204930 | 4.24 (±.028) | 11.02 (±.072) | 0 | 1.21 | 9.38 (±.228) | 25.86 (±.329) | 39.95 | 231.69 |
| Random | 0.260 (±.006) | 201767 | 3.82 (±.026) | 9.94 (±.068) | 0.50 | 1.21 | 8.88 (±.239) | 24.35 (±.334) | 41.46 | 216.06 |
| CS+R | 0.154 (±.006) | 119898 | 0.96 (±.007) | 7.89 (±.055) | 18.43 | 1.21 | 5.71 (±.242) | 34.21 (±.304) | 31.61 | 324.74 |
| CS+P | 0.156 (±.006) | 119096 | 0.93 (±.006) | 7.87 (±.052) | 18.43 | 1.21 | 5.68 (±.228) | 34.13 (±.285) | 31.69 | 325.16 |
| CS+HR | 0.090 (±.011) | 88951 | 0.74 (±.009) | 6.25 (±.075) | 18.43 | 1.21 | 4.48 (±.416) | 31.12 (±.500) | 34.69 | 273.20 |
| CS+S | 0.120 (±.011) | 107730 | 0.76 (±.009) | 8.12 (±.093) | 18.43 | 1.21 | 5.54 (±.397) | 34.07 (±.498) | 31.75 | 307.02 |
The second best reduction in the size of the epidemic came from the government strategies that included closing schools which dropped the total income loss and the attack rate by another 40%. However, this strategy increased the preventive costs by about $18 million dollars. Among the public antiviral distribution strategies, the distribution of the antivirals to the highest infection risk individuals proved to be the most effective. Surprisingly, it performed better than the sick strategy in which antivirals are distributed to the first sick individuals. Compared to the sick strategy, the high risk strategy performed 25% better in terms of the attack rate. We believe that this is due to the fact that sick individuals do not go to school and work which reduces their exposure to individuals whereas the high risk people still mingle in the society. Giving antivirals to the high risk group keeps them from being inadvertently infected by the large number of individuals in the society. Strategies involving school closures shifted the peak of the epidemic curves by several days, and the number of infected individuals also tailed off earlier compared to the strategies without school closures. The delay of the epidemic peak is important in real situations for preparing additional responses and medical services. Figure 1, Figure 2, and Figure 3 show the cost of strategies by demographic class.
Figure 1.

Total costs include direct income loss, indirect income loss, preventive, and health care costs
Figure 2.

Total costs include direct income loss, indirect income loss, preventive, and health care costs
Figure 3.

Total costs include direct income loss, indirect income loss, preventive, and health care costs
4.3 Effect of Age
Comparing the performance of intervention strategies across demographic classes highlights their strengths and weaknesses in controlling the epidemic and their usefulness in targeting a particular strata of the population. Please see Figure 1. For example, closing schools for two weeks had the best impact on reducing the children attack rate. although it created a large economic burden on the society; a total of $25 million, of which almost $19 million is in preventive costs. With this government intervention, the disease was almost eliminated within the children segment as the attack rate dropped from 0.84 in the base case to 0.07 in the children class. While closing schools was socially beneficial to the children, the elderly witnessed a less significant improvement. For the elderly, the attack rate dropped from 0.66 in the base case to 0.18 in the CS scenarios. Although the total number of infections are less when the schools are closed, the elderly suffered from increased infections immediately following the opening of schools. This led to a spike in transmissions among all ages which was then followed by a sharp decline in the epidemic curve. According to the base case, the elderly portion of the population had a much lower risk of infection. The infection prevalence in the base case among the elderly was at 66% whereas it was 84% for children. The difference was likely caused by the isolation of the elderly from the rest of the population. The overall population has a generally higher mixing rate compared to elderly. When the schools were closed, the antivirals did not play as key of a role in determining the outcome of the epidemic. Among all the antiviral distribution strategies, distribution of antivirals to the high risk group achieved the largest reduction in the attack rate.
4.4 Effect of Family Size
Family size is an important variable in determining a person’s chances of getting infected. Single individuals are the least likely to become infected as they spend several hours being alone at home without the extensive exposure to family members. Figure 2 shows the total costs encountered by family class. The large families had to incur higher preventive costs for strategies involving school closure. Closing school strategy is least beneficial to singles since they have no exposure to children. Large families with four or more members almost certainly have multiple children, and the impact of school closure is most significant for this class. In general, school closures are very beneficial in reducing the epidemic among all demographics regardless of the family size. The antiviral distribution strategy mixed with the school closures had the most significant impact on reducing the size of the epidemic.
4.5 Effect of Income
As Figure 3 shows, individuals from different income classes were affected differently from the various interventions. Costs from the low income class varied across strategies much more than the costs from the high income class. In terms of net benefits, the low income class gained the most under the CS+HR strategy and least under the NoGovt strategy. For this class, all strategies involving school closure resulted in higher benefits than strategies with no school closures. The government distribution of antivirals did little to reduce the prevalence of the virus. In general, after antiviral interventions the attack rates turn out to be almost the same in the low class and the high income class even though the low income class had not taken any personal action whereas the high income class had modified its behavior. Originally the high income class had a 6% higher attack rate than the low income class but the parity after interventions suggests that higher income class’s ability to change its own behavior had an immense effect on the attack rate. Government interventions did not help reduce the prevalence of the virus in higher income individuals as much as the other classes since they could afford their own medications. However, this class did benefit indirectly by the closing of schools since the epidemic was reduced in the rest of the population. Antiviral distribution to the high risk group had the greatest effect on the high incomes but not on the poorest segment.
4.6 Key Findings
Table 6 outlines the direct and indirect income loss, private and public cost of disease avoidance, attack rate, epidemic size and the total number of sick days by each intervention. A brief summary of the results shown in Table 6 is provided below:
The strategy that results in the smallest attack rate and the least amount of direct and indirect income loss is CS+HR. This strategy drops the attack rate by 87% and the total income loss by 82% compared to the base case. The drop in lost income is 90% due to drop in illness and 10% due to reduced care-taking. Note that the CS+HR strategy performs better than the CS+Sick strategy. Under the CS+Sick strategy, the total income loss drops by 80% compared to the base case. This result shows that a proactive strategy that targets the high risk group performs better economically as well as in containing the epidemic than the reactive strategy in which the sick people are targeted.
The private citizens can greatly influence the epidemic through behavior modifications as shown by the results of the NoGovt strategy. Under this strategy there is no intervention from the government such as school closures or antiviral distribution; only the private strategies stated earlier, i.e., stopping all non-essential activities and taking antivirals prophylactically, are in place. This alone causes a drop in total income loss by 62% and drop in attack rate by 64% compared to the base case.
The performance of the NoGovt and random strategies are statistically indistinguishable. This can be verified by comparing the attack rates, sick days, and income loss columns of these strategies. A similar observation may be made for the CS+R and CS+P strategies. Given the numerical variation in the outcomes of both the strategies, they are practically the same in performance. Under the NoGovt strategy, the government does not distribute any antivirals to people whereas in random strategy the government gives antivirals randomly. However, under all these strategies the private citizens follow their modified behavior. This implies that the distribution of antivirals has only a marginal effect in improving the socio-economic measures. The most significant contribution comes from the modified behavior of the citizens.
The average total cost of saving a person is highest when schools are closed. This is due to added preventive costs such as care-taking of (healthy) children.
The CS strategy in combination with the antiviral distribution to the high-risk class results in the lowest income loss, number of sick days, epidemic size, and attack rate.
Tables 7 and 8 show how different strategies affect people across demographic classes. A summary of the results is as follows:
Table 7.
Important statistics by strategy and by demographics class
| Class | Attack rate | Sick days | Indirect Income loss ($ mil) care-taking | Direct Income loss ($ mil) illness | Preventive cost ($ mil) | Hospital & outpatient cost ($ mil) | All Costs ($ mil) | Benefits ($ mil) | Episize | $ Spent per person saved |
|---|---|---|---|---|---|---|---|---|---|---|
| Base Case | ||||||||||
| LowInc | 0.70 | 178157 | 0.92 | 3.39 | 0 | 5.89 | 10.20 | 0 | 34130 | 0 |
| HighInc | 0.76 | 96869 | 3.77 | 11.55 | 0 | 2.88 | 18.21 | 0 | 18419 | 0 |
| Single | 0.63 | 57045 | 0 | 3.91 | 0 | 2.24 | 6.15 | 0 | 10914 | 0 |
| LgFam | 0.81 | 226984 | 7.43 | 7.98 | 0 | 6.13 | 21.54 | 0 | 43594 | 0 |
| Child | 0.84 | 136015 | 10.43 | 0 | 0 | 3.00 | 13.43 | 0 | 26073 | 0 |
| Elderly | 0.66 | 58724 | 0 | 3.89 | 0 | 3.67 | 7.57 | 0 | 11286 | 0 |
| No Government Strategy | ||||||||||
| LowInc | 0.38 | 98554 | 0.56 | 1.91 | 0 | 3.25 | 5.72 | 1.84 | 18790 | 0 |
| HighInc | 0.36 | 37007 | 2.02 | 5.73 | 1.21 | 1.11 | 10.07 | 7.57 | 8853 | 126.51 |
| Single | 0.24 | 21261 | 0 | 1.24 | 0.02 | .85 | 2.11 | 2.67 | 4085 | 3.05 |
| LgFam | 0.32 | 83893 | 3.12 | 3.23 | 0.55 | 2.27 | 9.18 | 9.05 | 17498 | 21.21 |
| Child | 0.33 | 48349 | 4.24 | 0 | 0.27 | 1.07 | 5.58 | 6.19 | 10258 | 17.27 |
| Elderly | 0.25 | 21287 | 0 | 1.52 | 0.09 | 1.33 | 2.95 | 2.37 | 4339 | 14.09 |
| Random Strategy | ||||||||||
| LowInc | 0.37 | 96541 | 0.49 | 1.72 | 0.16 | 2.97 | 5.35 | 1.84 | 18116 | 10.08 |
| HighInc | 0.36 | 36678 | 1.86 | 5.25 | 1.29 | 1.03 | 9.43 | 8.21 | 8674 | 132.27 |
| Single | 0.22 | 20804 | 0 | 1.10 | 0.08 | .77 | 1.95 | 2.82 | 3822 | 11.00 |
| LgFam | 0.31 | 82668 | 2.84 | 2.96 | 0.73 | 2.08 | 8.62 | 9.61 | 16658 | 27.22 |
| Child | 0.31 | 47759 | 3.82 | 0 | 0.37 | .98 | 5.18 | 6.61 | 9639 | 22.86 |
| Elderly | 0.24 | 20967 | 0 | 1.38 | 0.15 | 1.22 | 2.76 | 2.52 | 4092 | 21.52 |
Table 8.
Important statistics by strategy and by demographics class
| Class | Attack rate | Sick days | Indirect Income loss ($ mil) care-taking | Direct Income loss ($ mil) illness | Preventive cost ($ mil) | Hospital & outpatient cost ($ mil) | All Costs ($ mil) | Benefits ($ mil) | Episize | $ Spent per person saved |
|---|---|---|---|---|---|---|---|---|---|---|
| CS+Rand Strategy | ||||||||||
| LowInc | 0.17 | 41892 | 0.07 | 1.02 | 1.85 | .72 | 3.66 | 3.21 | 8395 | 71.87 |
| HighInc | 0.16 | 16877 | 0.27 | 3.14 | 7.78 | .26 | 11.45 | 11.91 | 3771 | 531.28 |
| Single | 0.16 | 14043 | 0 | 1.03 | 0.07 | .27 | 1.37 | 2.89 | 2760 | 9.57 |
| LgFam | 0.15 | 37892 | 0.73 | 1.87 | 10.34 | .53 | 13.47 | 12.81 | 8012 | 290.64 |
| Child | 0.09 | 11605 | 0.96 | 0 | 0.37 | .12 | 1.46 | 9.48 | 2664 | 16.05 |
| Elderly | 0.18 | 14695 | 0 | 1.04 | 0.15 | .45 | 1.64 | 2.86 | 3039 | 18.78 |
| CS+Poor Strategy | ||||||||||
| LowInc | 0.17 | 40348 | 0.07 | 1.01 | 2.18 | .69 | 3.95 | 3.21 | 8321 | 84.78 |
| HighInc | 0.19 | 16980 | 0.25 | 3.18 | 7.70 | .26 | 11.39 | 11.90 | 3792 | 526.66 |
| Single | 0.16 | 13644 | 0 | 1.00 | 0.19 | .26 | 1.345 | 2.91 | 2748 | 23.49 |
| LgFam | 0.14 | 37825 | 0.69 | 1.86 | 10.23 | .53 | 13.43 | 12.85 | 7753 | 285.48 |
| Child | 0.08 | 11506 | 0.93 | 0 | 0.33 | .12 | 1.38 | 9.50 | 2553 | 14.20 |
| Elderly | 0.18 | 14619 | 0 | 1.09 | 0.15 | .44 | 1.69 | 2.81 | 3093 | 18.91 |
| CS+High Risk Strategy | ||||||||||
| LowInc | 0.12 | 28969 | 0.05 | 0.71 | 1.84 | .40 | 3.00 | 3.55 | 6004 | 65.59 |
| HighInc | 0.12 | 13361 | 0.25 | 2.38 | 7.78 | .17 | 10.58 | 12.69 | 2937 | 502.49 |
| Single | 0.11 | 9713 | 0 | 0.77 | 0.07 | .15 | .99 | 3.15 | 2013 | 7.90 |
| LgFam | 0.12 | 28916 | 0.57 | 0.45 | 10.35 | .33 | 12.74 | 13.35 | 6358 | 278.07 |
| Child | 0.07 | 9228 | 0.74 | 0 | 0.41 | .08 | 1.23 | 9.67 | 2071 | 17.07 |
| Elderly | 0.13 | 11145 | 0 | 0.81 | 0.16 | .28 | 1.24 | 3.09 | 2288 | 17.96 |
| CS+Sick Strategy | ||||||||||
| LowInc | 0.16 | 36307 | 0.05 | 0.98 | 1.69 | .58 | 3.30 | 3.27 | 7785 | 64.08 |
| HighInc | 0.15 | 15515 | 0.25 | 3.11 | 7.70 | .22 | 11.29 | 11.96 | 3559 | 518.40 |
| Single | 0.16 | 12395 | 0 | 1.10 | 0.02 | .22 | 1.34 | 1.10 | 2705 | 2.53 |
| LgFam | 0.14 | 34214 | 0.57 | 1.80 | 10.16 | .45 | 12.98 | 13.03 | 7489 | 281.45 |
| Child | 0.08 | 10463 | 0.76 | 0 | 0.27 | .10 | 1.14 | 9.67 | 2346 | 11.51 |
| Elderly | 0.17 | 13174 | 0 | 1.07 | 0.09 | .37 | 1.54 | 2.83 | 2867 | 11.63 |
In the base case, the children and the large families face the highest attack rates. The singles and elderly face the lowest attack rates.
Closing schools are the most effective strategies across all classes, although children and large families benefit the most. For the children class, the total costs go down by 88%, and for large families, the total income loss goes down by 84% compared to the base case. However, for large families the preventive costs go up by $10 million primarily due to increased care taking of children and lost wages as a result of school closures. Compared to the base case, the attack rate for children, drops from 84% to 8% on an average and for the large families, it drops from 81% to 15%. The singles and the elderly classes benefit the least.
Closing schools combined with distribution of antivirals to the highest risk individuals (i.e., CS+HR strategy) works the best across all demographic classes. It results in the lowest attack rates, lowest number of absolute sick days, lowest epidemic size and lowest income loss among all classes compared to any other strategy. We believe that giving antivirals to the highest risk people fares better than distributing them to the sick because the sick people stay home (from work after falling sick) and stay out of public circulation whereas the high risk people continue to mix in the society.
Under almost all strategies, the lowest income class faces the highest attack rates.
The cost of saving a person is by far the highest in the highest income class across all strategies. For each class, it is calculated by dividing the total income loss for the class by the difference between the base epidemic size and the class epidemic size. Under the CS+HR strategy, this per capita cost of saving a life goes as high as $502 for the high income class whereas it is only $65 for the low income class. This difference is mainly due to the fact that high income families cause higher losses in income and productivity for their sick days. The high income families also have higher preventive costs because their behavioral strategy requires them to buy antivirals when their disease prevalence thresholds are met.
5 Summary and Conclusions
This research shows, in detail, the socio-economic impact of public and private mitigation efforts on different population strata. Note that the results are based on specific thresholds, strategies and assumptions made on behalf of each demographic class. These are unlikely to play out exactly in this manner. However, the results still provide useful insights on the role of behavioral adaptation. They show that the modification of behavior by the private citizens is the most important factor in containing the epidemic. Behavior modification alone drops the total income loss by 62% compared to the base case. Simply limiting the number of non-essential trips and taking antivirals prophylactically can reduce the spread of the virus to almost one third of its base size. These results signify the importance of actions by the private citizens and have implications for their level of compliance to health officials’ calls for social distancing and pharmaceutical measures. The closure of schools results in an additional 10–15% drop in infections after individuals have modified their behavior. The best and most effective strategy turns out to be CS+HR which requires school closures, public distribution of antivirals to the highest risk individuals in the society, and behavior modification by the private citizens.
In light of our results, we believe that activities such as governmental policies and media campaigns that urge the public to modify their behavior in order to reduce exposure to an infectious disease are likely to greatly reduce epidemic attack rates. We find that closing schools mitigates an epidemic better than the provision of antiviral kits. The governmental actions of school closure are more effective although less economically efficient in preventing infections than the distribution of antiviral kits.
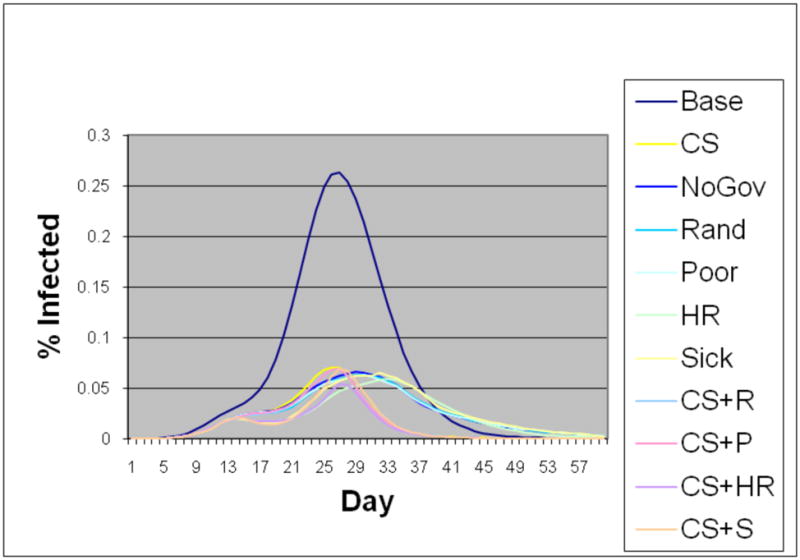
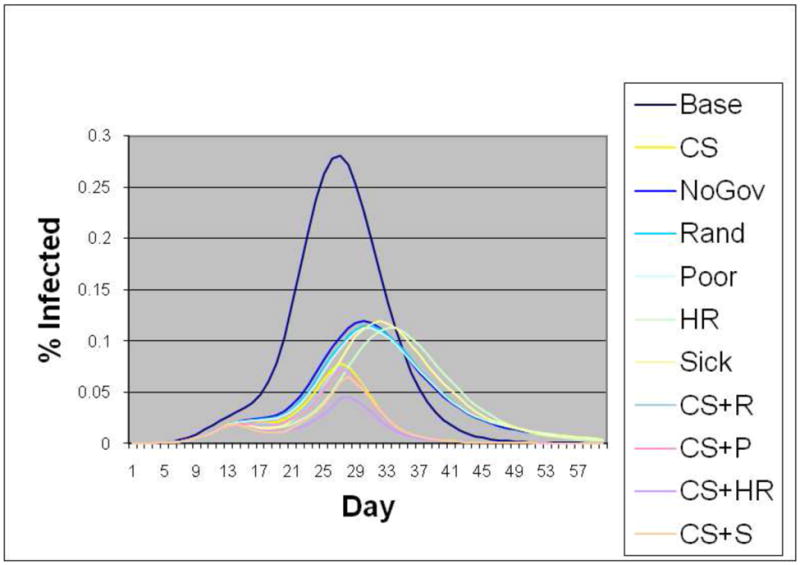
Figure 5.
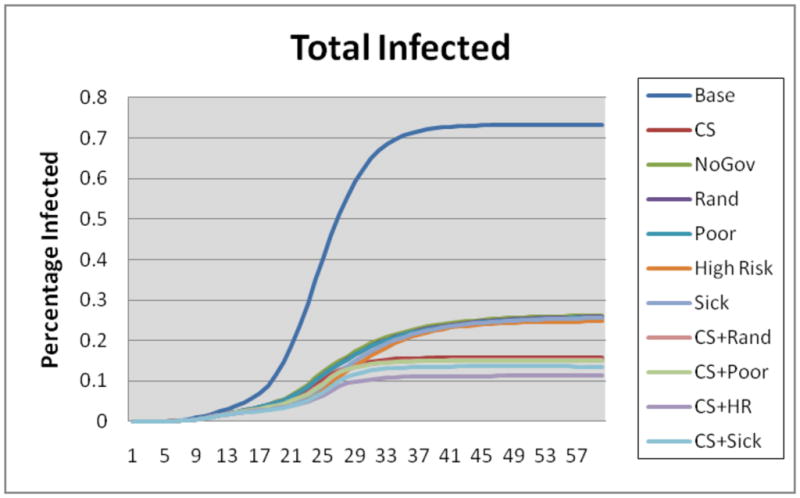
Total number of infected individuals by day
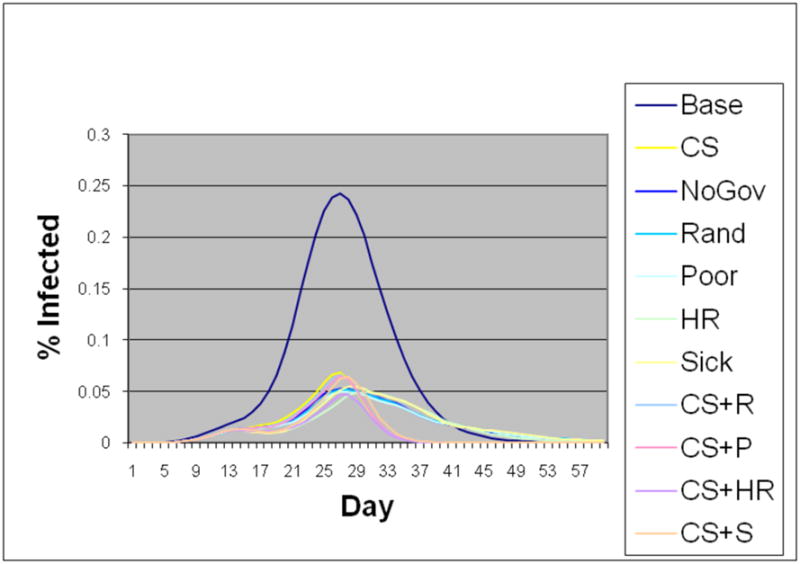
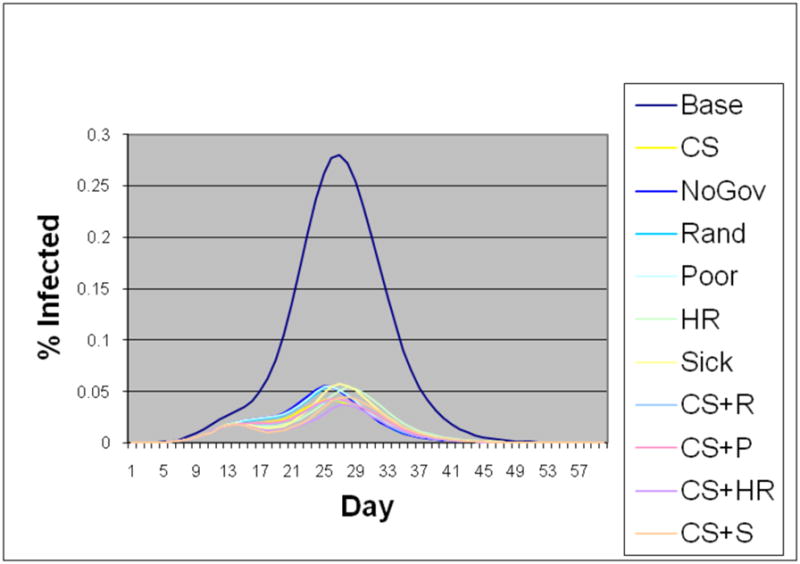
Figure 6.
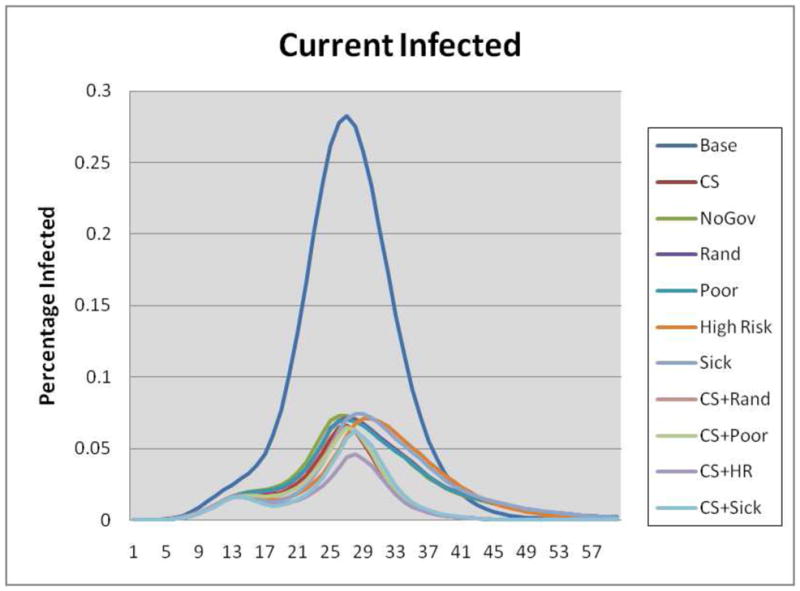
Number of infected individuals by day
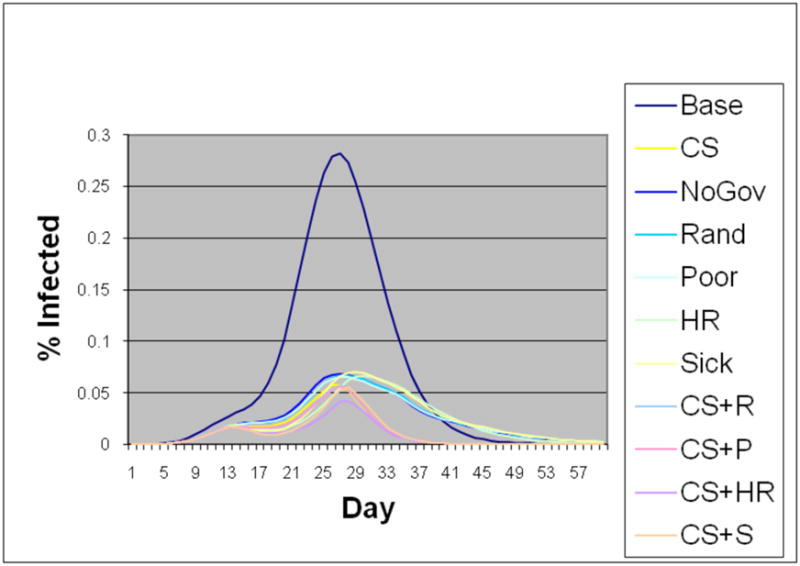
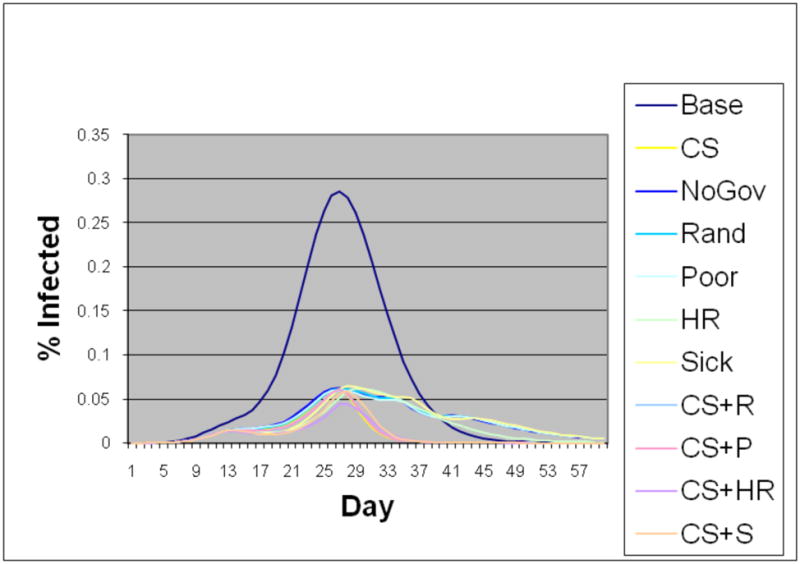
Figure 7.
Epidemic curves of the children class
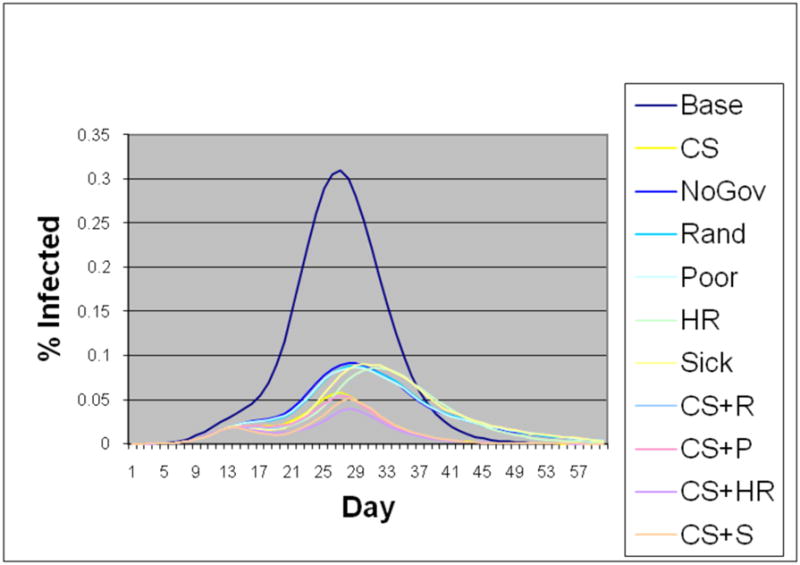
Figure 8.
Epidemic curves of the adult class
Figure 9.
Epidemic curves of the elderly class
Figure 10.
Epidemic curves of the singles class
Figure 11.
Epidemic curves of the small families
Figure 12.
Epidemic curves of the large families
Figure 13.
Epidemic curves of the poor class
Figure 14.
Epidemic curves of the medium income class
Figure 15.
Epidemic curves of the high income class
Acknowledgments
This paper has not been previously published. NSF Nets Grant CNS-062694, CNS-0831633, HSD Grant SES-0729441, CDC Center of Excellence in Public Health Informatics Grant 2506055-01, NIH-NIGMS MIDAS GM070694-05/06, and DTRA CNIMS Grant HDTRA1-07-C-0113. The authors would also like to thank the members of the Network Dynamics and Simulation Science Laboratory and Lisa Koonin at CDC for their helpful comments and suggestions.
Appendix
Assumptions
Below we provide a list of the assumptions used in performing these experiments:
The epidemic starts from five index cases, chosen randomly.
All simulations were performed 100 times by changing the random seed. The economic and infection results are provided as the average cost and mean number of infections per group over the 100 iterations.
School closure always occurs for a 14 day period.
Anti-viral prophylaxis course lasts for 10 days and treatment course lasts for 5 days.
Trigger thresholds for public and private intervention strategies are stated in Table 2. All global thresholds are based on total disease prevalence level in the society and local/personal thresholds are based on people not reporting to work in a person’s demographic class.
The private citizens take the following preventive actions to avoid getting the disease. The high income households buy antivirals, the medium income households stop their non-essential activities such as shopping and recreational trips, and the lowest income households hope their contacts are taking adequate preventative steps and hence take no action. When the high income households buy antivirals for prophylactic use, it is bought for every member of the household.
The public interventions are based on only the global trigger which is set at 1% of the total number of people being sick in the society. The public interventions involve closing schools and distributing antivirals.
When a young child (age 13 or younger) is sick, a non-working older sibling or parent stays home but if all adults are working, a working adult misses work to stay home with a young child for the two week duration schools are closed. We assume that the adult is able to take leave from work as needed.
Infected individuals do not go to work or school. This results in a schedule change for infected workers, infected children, and the working parent of an infected child.
The income of the adult is calculated by dividing the household income by the total number of working adults in the household.
Efficacy of the generic over the counter anti-viral is assumed to be 30%.
The private stockpile of antivirals (or the number of courses available from the market) is unlimited but the public stockpile is limited to 10,000 courses.
Computational Epidemiology Models
Aggregate computational epidemiology models often assume that the population is partitioned into a few sub-populations (e.g. by age) with a regular interaction structure within and between sub-populations. The resulting uniform mixing model can typically be expressed as a set of coupled ordinary differential equations. Such models focus on estimating the number of infected individuals as a function of time and have been useful in understanding population-wide interventions. For example, they can be used to determine the level of immunization required to protect a population from an epidemic. See [3, 2, 31] for more discussion on this class of models. The individual based modeling framework we use is Simdemics [5] which simulating epidemic outbreaks at the individual level of granularity. Simdemics belongs to a new emerging class of models called network based epidemiological models that use a detailed representation of social contact networks; such a representation is crucial for studying the questions related to the role of individual behavior and public policies. This disaggregated, agent based model can represent each interaction between individuals and can thus be used to study critical pathways of the diseases. It can be used to study the effect of public policies and individual behavior on the dynamics of infectious diseases. Disaggregate models require neither partitions of the population nor assumptions about large scale regularity of interactions. The three interacting models used by Simdemics allow for the diffusion of an infectious disease across a network: Step 1. Statistical models for the creation of synthetic populations, Step 2. Activity based model for creating time varying social contact networks, Step 3. Model of disease transmission. More discussion about Simdemics can be found in [3, 21].
Statistical Models of Urban Populations
Step 1 generates a synthetic population by integrating a variety of databases from commercial and public sources into a common architecture for data exchange. The process preserves the confidentiality of the original individuals and produces synthetic agents with realistic attributes and demographics. The population is a set of people and households associated with a set of demographic variables drawn from the census. The population is comprised of a collection of agent objects, each associated with a set of attributes. Each individual is placed in a household with other people and each household is placed geographically in such a way that a census of our modeled population is statistically indistinguishable from the original census, if aggregated to the block group level. Thus, the generated population used in simulations are statistically indistinguishable from the census data. See [9, 45, 46] for additional details.
Activity Based Models of Social Contact Networks
In Step 2, a set of activity templates for households are determined based on several thousand responses to an activity or time-use survey. The modeling methodology is called activity based travel demand models and is now accepted as the de facto standard in transportation science, see [13, 12] for recent overviews. Our early work in this area [9] played an important role in the development of this methodology. The activity templates include the sort of activities each household member performs and the time of day they are performed. Each synthetic household is then matched with one of the survey households using a decision tree based on demographics such as the number of workers in the household, number of children, their ages, etc. The synthetic household is assigned the activity template of its matching survey household. For each household and each activity performed by this household, a preliminary assignment of a location is made based on observed land-use patterns, tax data, etc. For a city, demographic information for each person and location, a minute-by-minute schedule of each person’s activities, and the locations where these activities take place are generated by a combination of simulation and data fusion techniques. These synthetic individuals interact, as real people do, with various degrees of fidelity, with each other and the built infrastructure (shopping locations, offices, work etc.) to produce a realistic social contact network based on the movements and the activities of every individual in the population. The social contact network from the above population is constructed as follows. We have a labeled dynamic bipartite graph GPL, where P is the set of people and L is the set of locations. If a person p ∈ P visits a location l ∈ L, there is an edge (p, l, label) ∈ E(GPL) between them, where label is a record of the type of activity of the visit and its start and end times. Each vertex (person and location) can also have labels. The person labels correspond to demographic attributes such as age, income, etc. The labels attached to locations specify the location’s attributes such as its x and y coordinates, maximum capacity, etc. Note that, there can be multiple edges between a person and a location recording different visits. This produces synthetic individuals that just like real individuals can now carry out other activities like eating, socializing, shopping, etc. An important point to note here is that such data is impossible to collect on this scale by measurements or surveys.
Models of Disease Transmission
Step 3 consists of developing a computational model for representing the disease within individuals and its transmission between them. The model can be viewed as a networked probabilistic timed finite state machine. Each individual is associated with a timed probabilistic finite state machine. Furthermore, the automata are connected to other automata – this coupling is derived from the social contact network. The state transition is probabilistic and is timed (e.g. may represent a distribution of incubation times). It may also depend on the attributes of the people involved (age, income, health status, etc.) as well as the type of contact (intimate, casual, etc.). Individual automata update their states in responses to changes in internal state and state of its neighbors. For this study, a potentially-pandemic disease model for H5N1v influenza was utilized for tracking an individual’s state throughout the stages of disease progression. By combing the disease model with information from the social network, contact timings with infected individuals, individual susceptibility, and the potential use of antiviral medications, synthetic individuals may become infected and follow a probabilistically determined disease path. This culminates in returning to an uninfected state through the usage of antivirals or reaching the removed state where the individual is no longer infectious or susceptible. Figure 4 displays the model used in this study. Each node is a finite state an individual remains in until a certain duration has elapsed. The duration distribution for intervals between 2 to 5 days and 3 to 6 days is included in the figure. The next state is determined probabilistically by selecting one of the outgoing edges to another state. Whether or not the agent has been treated with antiviral medications affects the edge probabilities in the disease model. For simplicity, the edges with a 1.0 probability are not labeled in the figure. This model has been calibrated through and utilize by previous research [4, 21, 20, 30].
Figure 4.

The Disease Model
Model Validation
Extensive efforts have been made to validate the overall approach and specific components of the model. This includes structural validity of models, matching the data produced to field data, and formal specifications of these models for software verification [9, 30, 21]. Results on population mobility and social network construction were presented and reviewed annually at [48]. Epidemiological simulations were also reviewed and discussed as a part of a letter report by the National Academies and published in [30]. Simdemics has been used in more than half a dozen user defined case studies; these case studies have further improved and served to validate the various models [4, 20, 33]. This study illustrates, what we believe is, the first use of high resolution simulation-based microeconomic analysis in the context of public health epidemiology.
Additional Analysis
The results for the Poor, Sick, High Risk, and CS strategies are provided here to allow a simpler comparison between the strategies that combine closing schools with antiviral distributions in the main text. Under the poor, sick, and high risk strategies, the antiviral courses are distributed by the government to the poor, first sick, and high risk respectively in addition to the fact that the private citizens modified their behavior. It is interesting to note that these strategies performed only slightly better than the NoGovt strategy. Tables 9, 10, 11, and 12 complement the tables in the Results section. The tables primarily include information concerning the middle income, small family, and adult classes as well as the poor, sick, high risk, and close school strategies. The following findings involving these classes and strategies were observed:
Table 9.
Demographic classes and their respective thresholds to trigger public and private intervention strategies
| Demographic Class (population) | Global Threshold (% sick in the society) | Local Threshold (% sick in class) |
|---|---|---|
| Medium Income - Stop non-essential activities | ||
| Single, Adult (4,635) | 5 | 2 |
| Single, Elderly (992) | 2 | 1 |
| Sm.Fam., Child (4,844) | 5 | None |
| Sm.Fam., Adult (32,095) | 5 | 4 |
| Sm.Fam., Elderly (5,494) | 3 | 1 |
| Lg.Fam., Child (13,573) | 5 | None |
| Lg.Fam., Adult (16,861) | 5 | 4 |
| Lg.Fam., Elderly (738) | 3 | 1 |
| High Income - Buy antivirals | ||
| Single, Adult (285) | 2 | 5 |
| Sm.Fam., Child (1,034) | .5 | None |
| Sm.Fam., Adult (10,132) | 2 | 3 |
| Sm.Fam., Elderly (1,552) | 1.5 | 3 |
| Lg.Fam., Adult (6,364) | 2 | 2 |
Table 10.
Important statistics by strategy (Std. Dev. based on one hundred simulation runs)
| Strategy | Attack rate (σ) | Sick days | Indirect income loss ($ mil) due to care-taking | Direct income loss ($ mil) due to illness | Preventive costs ($ mil) Govt. | Preventive costs ($ mil) private | Hospital & outpatient cost ($ mil) | All costs ($ mil) | Benefits ($ mil) | $ Spent Per Person Saved |
|---|---|---|---|---|---|---|---|---|---|---|
| Poor | 0.259 (±.008) | 200457 | 3.79 (±.031) | 10.10 (±.083) | 0.50 | 1.21 | 8.86 (±.285) | 24.46 (±.399) | 41.358 | 217.09 |
| High Risk | 0.248 (±.006) | 189945 | 4.32 (±.029) | 11.23 (±.077) | 0.50 | 1.21 | 9.00 (±.237) | 26.26 (±.343) | 39.56 | 234.74 |
| Sick | 0.257 (±.006) | 199049 | 4.36 (±.028) | 11.39 (±.074) | 0.50 | 1.21 | 9.37 (±.227) | 26.83 (±.330) | 38.98 | 242.24 |
| CS (no AV dist.) | 0.157 (±.006) | 124710 | 0.97 (±.007) | 7.75 (±.054) | 17.93 | 1.21 | 5.91 (±.243) | 33.78 (±.303) | 32.04 | 319.46 |
Table 11.
Important statistics by strategy and by demographics class
| Class | Attack rate | Sick days | Indirect Income loss ($ mil) care-taking | Direct Income loss ($ mil) illness | Preventive cost ($ mil) | Hospital & outpatient cost ($ mil) | All Costs ($ mil) | Benefits ($ mil) | Episize | $ Spent per person saved |
|---|---|---|---|---|---|---|---|---|---|---|
| Base Case | ||||||||||
| MedInc | 0.74 | 323000 | 5.74 | 15.38 | 0 | 9.31 | 30.43 | 0 | 58869 | 0 |
| SmFam | 0.70 | 297536 | 2.99 | 18.42 | 0 | 9.71 | 31.14 | 0 | 56910 | 0 |
| Adult | 0.71 | 386825 | 0 | 26.42 | 0 | 11.41 | 37.82 | 0 | 74059 | 0 |
| No Government Strategy | ||||||||||
| MedInc | 0.17 | 72414 | 1.67 | 3.38 | 0 | 2.02 | 7.07 | 16.07 | 14057 | 0 |
| SmFam | 0.25 | 99774 | 1.12 | 6.55 | 0.63 | 3.27 | 11.58 | 13.75 | 20117 | 17.28 |
| Adult | 0.26 | 135292 | 0 | 9.49 | 0.84 | 3.99 | 14.32 | 16.92 | 27103 | 17.87 |
| Random Strategy | ||||||||||
| MedInc | 0.16 | 71566 | 1.47 | 2.97 | 0.26 | 1.864 | 6.56 | 16.68 | 12670 | 5.62 |
| SmFam | 0.23 | 98294 | 0.98 | 5.88 | 0.90 | 3.01 | 10.77 | 14.56 | 18980 | 23.70 |
| Adult | 0.25 | 133039 | 0 | 8.56 | 1.18 | 3.66 | 13.39 | 17.86 | 25729 | 24.41 |
| Poor Strategy | ||||||||||
| LowInc | 0.37 | 94376 | 0.50 | 1.72 | 0.50 | 3.04 | 5.33 | 2.01 | 18001 | 31.00 |
| MedInc | 0.16 | 72675 | 1.51 | 2.99 | 0 | 1.93 | 6.44 | 16.62 | 12748 | 0 |
| HighInc | 0.35 | 36459 | 1.79 | 5.39 | 1.21 | 1.05 | 9.43 | 8.15 | 8561 | 122.76 |
| Single | 0.22 | 20294 | 0 | 1.11 | 0.19 | .77 | 2.07 | 2.81 | 3770 | 26.85 |
| SmFam | 0.24 | 97545 | 0.96 | 6.01 | 0.89 | 3.05 | 10.91 | 14.46 | 19123 | 23.68 |
| LgFam | 0.30 | 82617 | 2.84 | 2.98 | 0.62 | 2.12 | 8.57 | 9.59 | 16417 | 22.94 |
| Child | 0.31 | 47505 | 3.79 | 0 | 0.33 | 1.00 | 5.12 | 6.64 | 9566 | 20.24 |
| Adult | 0.25 | 132082 | 0 | 8.68 | 1.22 | 3.70 | 13.61 | 17.73 | 25630 | 25.22 |
| Elderly | 0.24 | 20868 | 0 | 1.41 | 0.15 | 1.24 | 2.81 | 2.49 | 4114 | 21.60 |
| High Risk Strategy | ||||||||||
| LowInc | 0.37 | 92376 | 0.55 | 1.84 | 0.15 | 2.19 | 4.67 | 1.92 | 17807 | 9.60 |
| MedInc | 0.18 | 71729 | 1.86 | 3.73 | 0.27 | 1.40 | 7.26 | 15.53 | 14326 | 6.00 |
| HighInc | 0.33 | 28849 | 1.92 | 5.65 | 1.28 | .61 | 9.46 | 7.75 | 8075 | 124.35 |
| Single | 0.22 | 19905 | 0 | 1.28 | 0.07 | .55 | 1.90 | 2.63 | 3876 | 9.99 |
| SmFam | 0.24 | 92967 | 1.14 | 6.68 | 0.89 | 2.12 | 10.84 | 13.61 | 19469 | 23.88 |
| LgFam | 0.31 | 77072 | 3.18 | 3.27 | 0.74 | 1.46 | 8.65 | 6.96 | 16863 | 27.90 |
| Child | 0.32 | 44771 | 4.32 | 0 | 0.41 | .69 | 5.43 | 6.11 | 9941 | 25.39 |
| Adult | 0.25 | 125997 | 0 | 9.74 | 1.14 | 2.60 | 13.48 | 16.68 | 26286 | 23.84 |
| Elderly | 0.23 | 19175 | 0 | 1.48 | 0.16 | .84 | 2.49 | 2.41 | 3981 | 22.12 |
Table 12.
Important statistics by strategy and by demographics class
| Class | Attack rate | Sick days | Indirect Income loss ($ mil) care-taking | Direct Income loss ($ mil) illness | Preventive cost ($ mil) | Hospital & outpatient cost ($ mil) | All Costs ($ mil) | Benefits ($ mil) | Episize | $ Spent per person saved |
|---|---|---|---|---|---|---|---|---|---|---|
| Sick Strategy | ||||||||||
| LowInc | 0.39 | 95770 | 0.56 | 1.93 | 0 | 2.61 | 5.10 | 1.82 | 18831 | 0 |
| MedInc | 0.18 | 70682 | 1.80 | 3.64 | 0 | 1.64 | 7.08 | 15.68 | 14089 | 0 |
| HighInc | 0.36 | 35589 | 2.00 | 5.82 | 1.21 | .89 | 9.93 | 7.50 | 8729 | 124.89 |
| Single | 0.24 | 20692 | 0 | 1.31 | 0.02 | .55 | 1.90 | 2.63 | 4098 | 3.05 |
| SmFam | 0.25 | 96908 | 1.15 | 6.82 | 0.63 | 2.63 | 11.24 | 13.46 | 20228 | 17.34 |
| LgFam | 0.32 | 81448 | 3.22 | 3.26 | 0.55 | 1.82 | 8.86 | 8.93 | 17323 | 21.07 |
| Child | 0.33 | 47115 | 4.36 | 0 | 0.27 | .86 | 5.50 | 6.07 | 10148 | 17.16 |
| Adult | 0.26 | 131389 | 0 | 9.85 | 0.84 | 3.21 | 13.90 | 16.57 | 27201 | 17.91 |
| Elderly | 0.25 | 20543 | 0 | 1.54 | 0.09 | 1.07 | 2.71 | 2.36 | 4300 | 14.01 |
| Close Schools Strategy | ||||||||||
| LowInc | 0.18 | 45041 | 0.06 | 1.02 | 1.68 | .79 | 3.57 | 1.02 | 8949 | 67.04 |
| MedInc | 0.15 | 66249 | 0.63 | 3.62 | 9.88 | .97 | 15.11 | 16.86 | 12070 | 211.16 |
| HighInc | 0.16 | 17375 | 0.27 | 3.11 | 7.70 | .27 | 11.36 | 11.94 | 3905 | 530.76 |
| Single | 0.17 | 14797 | 0 | 1.02 | 0.02 | .29 | 1.33 | 2.89 | 2968 | 2.62 |
| SmFam | 0.17 | 70406 | 0.24 | 4.93 | 9.09 | 1.18 | 15.45 | 16.25 | 13782 | 210.78 |
| LgFam | 0.15 | 39505 | 0.72 | 1.79 | 10.16 | .56 | 13.25 | 12.89 | 8174 | 286.90 |
| Child | 0.08 | 12164 | 0.96 | 0 | 0.27 | .13 | 1.37 | 9.46 | 2660 | 11.67 |
| Adult | 0.18 | 97244 | 0 | 6.69 | 18.90 | 1.43 | 27.02 | 19.73 | 19175 | 344.41 |
| Elderly | 0.18 | 15300 | 0 | 1.06 | 0.09 | .48 | 1.64 | 2.84 | 3089 | 11.94 |
| CS+Rand Strategy | ||||||||||
| MedInc | 0.15 | 65066 | 0.62 | 3.73 | 10.14 | 13.87 | 28.36 | 60.09 | 11868 | 215.78 |
| SmFam | 0.16 | 67962 | 0.22 | 5.00 | 9.35 | 1.12 | 15.70 | 16.20 | 13262 | 214.31 |
| Adult | 0.18 | 93597 | 0 | 6.85 | 19.24 | 1.34 | 27.43 | 19.57 | 18331 | 345.31 |
| CS+Poor Strategy | ||||||||||
| MedInc | 0.15 | 65722 | 0.61 | 3.69 | 9.88 | 14.03 | 28.21 | 60.24 | 11689 | 209.45 |
| SmFam | 0.16 | 67626 | 0.23 | 5.01 | 9.35 | 1.11 | 15.70 | 16.18 | 13301 | 214.40 |
| Adult | 0.17 | 92970 | 0 | 6.78 | 19.28 | 1.32 | 27.39 | 19.64 | 18156 | 344.96 |
| CS+High Risk Strategy | ||||||||||
| MedInc | 0.13 | 49541 | 0.44 | 3.16 | 10.15 | 10.77 | 24.52 | 63.93 | 10011 | 207.73 |
| SmFam | 0.13 | 50321 | 0.18 | 3.99 | 9.35 | .68 | 14.20 | 17.25 | 10581 | 201.80 |
| Adult | 0.14 | 68577 | 0 | 5.44 | 19.20 | .80 | 25.45 | 20.97 | 14593 | 322.91 |
| CS+Sick Strategy | ||||||||||
| MedInc | 0.15 | 59529 | 0.46 | 4.03 | 9.88 | 12.78 | 27.15 | 61.30 | 11994 | 210.82 |
| SmFam | 0.16 | 61120 | 0.19 | 5.22 | 9.09 | .94 | 15.43 | 16.02 | 13144 | 207.72 |
| Adult | 0.17 | 84092 | 0 | 7.05 | 18.90 | 1.12 | 27.07 | 19.37 | 18125 | 337.94 |
Closing schools (CS) is the second largest single factor in reducing the income loss and epidemic size (modified individual behavior is the largest factor). Under the CS strategy, the income loss due to care taking (of sick children) drops by 93% and the income loss due to illness drops by 75% compared to the base case. The epidemic size is lowered by 87,237 or 78% compared to the base case.
Closing schools results in fewer number of sick children and sick adults, and hence lower productivity and income loss due to sickness. Our results show that more children fall sick when schools are open, and more working adults have to stay home to take care of the sick children. Keeping schools open results in more than $4 million in indirect income loss whereas CS results in less than $1 million in indirect income loss. However, closing schools, results in much higher cost of disease avoidance ( $18 million) because many working adults have to forgo work and stay home with children.
In the base case, the direct income loss is highest to the adults and small families.
In terms of the absolute numbers, the adults and the medium income class face the highest epidemic size, sick days and income loss. This is due to the fact that a higher proportion of the population belongs to these classes.
In case of high risk strategy, the cost of saving a life for the low income class goes as low as $9.60.
The total income losses are the highest for the adult class and lowest for the singles class across all strategies. This is due to the fact that 70% of the population belongs to the adult class and only 11% population is single.
The absolute total cost benefit is highest for the adult class and lowest for the singles and elderly class for the same reason. Benefits are difference between the base cost and strategy cost.
Footnotes
A recent study [20] by NIH considered the scenario where private citizens could purchase antivirals in the open market for prophylactic use.
To test the sensitivity of the number of antiviral courses available in the public stockpile, we repeated the entire experiment in which the public antiviral stockpile was limited to only 1,000 courses. The results of that experiment were not statistically significantly different from the results of 10,000 course experiment.
Potential conflicts of interest: None.
Publisher's Disclaimer: This is a PDF file of an unedited manuscript that has been accepted for publication. As a service to our customers we are providing this early version of the manuscript. The manuscript will undergo copyediting, typesetting, and review of the resulting proof before it is published in its final citable form. Please note that during the production process errors may be discovered which could affect the content, and all legal disclaimers that apply to the journal pertain.
Contributor Information
Chris Barrett, Email: cbarrett@vbi.vt.edu.
Keith Bisset, Email: kbisset@vbi.vt.edu.
Jonathan Leidig, Email: leidig07@vbi.vt.edu.
Achla Marathe, Email: amarathe@vbi.vt.edu.
Madhav Marathe, Email: mmarathe@vbi.vt.edu.
References
- 1.Arinaminpathy N, McLean A. Antiviral treatment for the control of pandemic influenza: some logistical constraints. J R Soc Interface. 2008;5(22):545–53. doi: 10.1098/rsif.2007.1152. [DOI] [PMC free article] [PubMed] [Google Scholar]
- 2.Bailey N. The Mathematical Theory of Infectious Diseases and its Applications. Hafner Press; 1975. [Google Scholar]
- 3.Barrett C, Smith JP, Eubank S. Modern Epidemiology Modeling. Scientific American; Mar, 2005. [PubMed] [Google Scholar]
- 4.Barrett C, Beckman R, Bisset K, et al. NDSSL Technical Report. Sept, 2008. An analysis of layered interventions to support Homeland Defense. [Google Scholar]
- 5.Barrett C, Bisset K, Eubank S, Feng Z, Marathe M. EpiSimdemics: an efficient algorithm for simulating the spread of infectious disease over large realistic social networks. Proc. of ACM/IEEE Conference on Supercomputing; 2008. pp. 1–12. [Google Scholar]
- 6.Barrett C, Chen J, Eubank S, Kumar VSA, Lewis B, Marathe A, Marathe M. Role of Vulnerable and Critical Nodes in Controlling Epidemicsin Social Networks. Epidemics Conference; 2008. [Google Scholar]
- 7.Barrett C, Beckman R, Khan M, Kumar V, Marathe M, Stretz P, Dutta T, Lewis B. Generation and Analysis of Large Synthetic Social Contact Networks. Winter Simulation Conference.2009. [Google Scholar]
- 8.Barrett C, Bisset K, Leidig, Marathe A, Marathe M. Estimating the Impact of Public and Private Strategies for Controlling an Epidemic: A Multi-Agent Approach. Innovative Applications in Artificial Intelligence. 2009 [Google Scholar]
- 9.Beckman RJ, Baggerly KA, McKay MD. Creating synthetic base-line populations. Transportation Research Part A – Policy and Practice. 1996;30(6):415–429. [Google Scholar]
- 10.Blaser M. Pandemics and Preparations. J Infect Dis. 2006;194:S70–2. doi: 10.1086/507564. [DOI] [PubMed] [Google Scholar]
- 11.Blendon R, Koonin L, Benson J, Cetron M, Pollard W, Mitchell E, Weldon K, Herrmann M. Public Response to Community Mitigation Measures for Pandemic Influenza. Emerg Infect Dis. 2008;14(5) doi: 10.3201/eid1405.071437. [DOI] [PMC free article] [PubMed] [Google Scholar]
- 12.Bowman J, Bradley M, Shiftan M, Lawton K, Ben-Akiva M. Demonstration of an Activity Based Model System in Portland. Proc. 8th World Conference on Transportation Research; 1998. p. 3. [Google Scholar]
- 13.Bowman J, Ben-Akiva M. Activity Based Disaggregate Travel Demand Model System. Transportation Research Part A. 2001;35(1):1–28. [Google Scholar]
- 14.Bruin W, Fischhoff B, Brilliant L, Caruso D. Expert judgements of pandemic influenza risks. Glob Public Health. 2006;1(2):178–193. doi: 10.1080/17441690600673940. [DOI] [PubMed] [Google Scholar]
- 15.Cauchemez S, Ferguson N, Wachtel C, Tegnell A, Saour G, Duncan B, Nicoll A. Closure of schools during an influenza pandemic. The Lancet Infectious Diseases. 2009;9(8):473–481. doi: 10.1016/S1473-3099(09)70176-8. [DOI] [PMC free article] [PubMed] [Google Scholar]
- 16.Davey V, Glass R, Min H, Beyeler W, Glass L. Effective, robust design of community mitigation for pandemic influenza: a systematic examination of proposed US guidance. PLoS One. 2008;3(7):e2606. doi: 10.1371/journal.pone.0002606. [DOI] [PMC free article] [PubMed] [Google Scholar]
- 17.Del Valle S, Hethcote H, Hyman J, Castillo-Chavez C. Effects of behavioral changes in a smallpox attack model. Mathematical Biosciences. 2005;195(2):228–251. doi: 10.1016/j.mbs.2005.03.006. [DOI] [PubMed] [Google Scholar]
- 18.Elveback L, Fox J, Ackerman E, Langworthy A, Boyd M, Gatewood L. An influenza simulation model for immunization studies. American Journal of Epidemiology. 1976;103(2):152–165. doi: 10.1093/oxfordjournals.aje.a112213. [DOI] [PubMed] [Google Scholar]
- 19.Epstein J, Parker J, Cummings D, Hammond R. Center on Social and Economic Dynamics Working Paper No. 50. Oct, 2007. Coupled Contagion Dynamics of Fear and Disease: A Behavioral Basis for the 1918 Epidemic Waves: Mathematical and Computational Explorations. [Google Scholar]
- 20.Epstein J, Eubank S, Lipsitch M, et al. Modeling of Distribution Alternatives of Home Antiviral Drug Stockpiling. NIH MIDAS Meeting; June 17, 2008. [Google Scholar]
- 21.Eubank S, Guclu H, Kumar A, Marathe M, Srinivasan A, Toroczkai Z, Wang N. Modeling Disease Outbreaks in Realistic Urban Social Networks. Nature. 2004;429:180–184. doi: 10.1038/nature02541. [DOI] [PubMed] [Google Scholar]
- 22.Ferguson N, Cummings DAT, Cauchemez S, et al. Strategies for containing an emerging influenza pandemic in Southeast Asia. Nature. 2005;43:209–214. doi: 10.1038/nature04017. [DOI] [PubMed] [Google Scholar]
- 23.Ferguson N, Cummings D, Fraser C, Cajka J, Cooley P, Burke D. Strategies for mitigating an influenza pandemic. Nature. 2006;442:448–452. doi: 10.1038/nature04795. [DOI] [PMC free article] [PubMed] [Google Scholar]
- 24.Fineberg H, Wilson M. Epidemic Science in Real Time. Science. 2009;324(5930):987. doi: 10.1126/science.1176297. [DOI] [PubMed] [Google Scholar]
- 25.Fischhoff B, Bostrom A, Quadrel MJ. Risk perception and communication. In: Detels R, Holland W, McEwen J, Omenn GS, editors. Oxford Textbook of Public Health. Oxford, UK: Oxford Univ. Press; pp. 987–1002. [Google Scholar]
- 26.Galvani A, Reluga T, Chapman GB. Long-standing influenza vaccination policy is in accord with individual self-interest but not with the utilitarian optimum. Proc Natl Acad Sci USA. 2007;104(13):5692–5697. doi: 10.1073/pnas.0606774104. [DOI] [PMC free article] [PubMed] [Google Scholar]
- 27.Germann TC, Kadau K, Longini IM, Macken CA. Mitigation strategies for pandemic influenza in the United States. Proc Natl Acad Sci U S A. 2006;103(15):5935–5940. doi: 10.1073/pnas.0601266103. [DOI] [PMC free article] [PubMed] [Google Scholar]
- 28.Gersovitz M, Hammer JS. Infectious diseases, public policy, and the marriage of economics and epidemiology. World Bank Res Obsr. 2003;18(2):129–157. [Google Scholar]
- 29.Halloran ME, Longini IM, Cowart DM, Nizam A. Community interventions and the epidemic prevention potential. Vaccine. 2002;20(27–28):3254–62. doi: 10.1016/s0264-410x(02)00316-x. [DOI] [PubMed] [Google Scholar]
- 30.Halloran M, Ferguson NM, Eubank S, et al. Modeling targeted layered containment of an influenza pandemic in the United States. Proc Natl Acad Sci USA. 2008;105:4639–4644. doi: 10.1073/pnas.0706849105. [DOI] [PMC free article] [PubMed] [Google Scholar]
- 31.Hethcote H. The Mathematics of Infectious Diseases. SIAM Rev Soc Ind Appl Math. 2000;42(4):599–653. [Google Scholar]
- 32.Inglesby T, Nuzzo J, O’Toole T, Henderson D. Disease mitigation measures in the control of pandemic influenza. Biosecur Bioterror. 2006;4:366–375. doi: 10.1089/bsp.2006.4.366. [DOI] [PubMed] [Google Scholar]
- 33.Lewis B, Beckman R, Kumar VS, et al. NIH DHHS Study Final report. 2007. Simulated Pandemic Influenza Outbreaks in Chicago. Tech Report TR-NDSSL-07–004. [Google Scholar]
- 34.Longini I, Halloran M, Nizam A, Yang Y. Containing Pandemic Influenza with Antiviral Agents. American Journal of Epidemiology. 2004;159(7) doi: 10.1093/aje/kwh092. [DOI] [PubMed] [Google Scholar]
- 35.Longini I, Nizam A, Xu S, Ungchusak K, Hanshaworakul W, Cummings D, Hollaran E. Containing Pandemic Influenza at the source. Science. 2005;309(5737):1083–1087. doi: 10.1126/science.1115717. [DOI] [PubMed] [Google Scholar]
- 36.McCaw J, McVernon J. Prophylaxis or treatment? Optimal use of an antiviral stockpile during an influenza pandemic. Mathmetical Biosciences. 2007;209:336–360. doi: 10.1016/j.mbs.2007.02.003. [DOI] [PubMed] [Google Scholar]
- 37.Meltzer M, Cox N, Fukuda K. The Economic Impact of Pandemic Influenza in the United States: Priorities for intervention. Emerg Infect Dis. 1999;5(5):659–671. doi: 10.3201/eid0505.990507. [DOI] [PMC free article] [PubMed] [Google Scholar]
- 38.Meyers L, Newman M, Martin M, Schrag S. Applying network theory to epidemics: Control measures for outbreaks of Mycoplasma pneumonia. Emerg Infect Dis. 2003;9(2):204–210. doi: 10.3201/eid0902.020188. [DOI] [PMC free article] [PubMed] [Google Scholar]
- 39.Mniszewski S, Del Valle S, Stroud P, Riese J, Sydoriak S. EpiSimS simulation of a multi-component strategy for pandemic influenza. SpringSim ’08: Proceedings of the 2008 Spring simulation multi-conference; 2008. pp. 556–563. [Google Scholar]
- 40.National Research Council. NRC of the National Academies. National Academic Press; Washington DC: Critical Infrastructure Protection and the Law: An Overview of Key Issues. [Google Scholar]
- 41.Newman M. The Structure and Function of Complex Networks. SIAM Review. 2003;45:167–256. [Google Scholar]
- 42.Philipson T, Posner R. Private choices and public health: The AIDS epidemic in an economic perspective. Cambridge and London: Harvard University Press; 1993. [Google Scholar]
- 43.Philipson T. Economic epidemiology and infectious diseases. In: Cuyler A, Newhouse JP, editors. Handbook of Health Economics. Amsterdam: North Holland; 2000. [Google Scholar]
- 44.Sander B, Nizam A, Garrison LP, Postma MJ, Halloran ME, Longini IM. Economic Evaluation of Influenza Pandemic Mitigation Strategies in the United States Using a Stochastic Microsimulation Transmission Model. Value Health. 2008;12(2):226–233. doi: 10.1111/j.1524-4733.2008.00437.x. [DOI] [PMC free article] [PubMed] [Google Scholar]
- 45.Speckman P, Vaughn K, Pas W. Generating Household Activity-Travel Patterns (HATPs) for Synthetic Populations. Transportation Research Board; Annual Meeting.1997. [Google Scholar]
- 46.Speckman P, Vaughn K, Pas W. A Continuous Spatial Interaction Model: Application to Home-Work Travel in Portland. Transportation Research Board; Annual Meeting.1997. [Google Scholar]
- 47.Thompson W, Comanor L, Shay D. Epidemiology of Seasonal Influenza: Use of Surveillance Data and Statistical Models to Estimate the Burden of Diease. J Infect Dis. 2006;194:S82–91. doi: 10.1086/507558. [DOI] [PubMed] [Google Scholar]
- 48.TRBC. 5th – 9th biennial national academies transportation research board conferences on application of transportation planning methods.1995–2003. [Google Scholar]
- 49.TRB. Transportation Research Board annual meetings.1998–2006. [Google Scholar]
- 50.Whitley R, Barlett J, Hayden F, Pavia A, Michael T, Monto A. Seasonal and Pandemic Influenza: Recommendations for Preparedness in the United States. J Infect Dis. 2006;195:S155–61. doi: 10.1086/507557. [DOI] [PubMed] [Google Scholar]
- 51.World Health Organization Writing Group. Nonpharmaceutical interventions for pandemic influenza, national and community measures. Emerg Infect Dis. 2006;12:88–94. doi: 10.3201/eid1201.051371. [DOI] [PMC free article] [PubMed] [Google Scholar]