

Abstract
Background
Obsessive–compulsive disorder (OCD) is probably an etiologically heterogeneous condition. Many patients manifest other psychiatric syndromes. This study investigated the relationship between OCD and co-morbid conditions to identify subtypes.
Method
Seven hundred and six individuals with OCD were assessed in the OCD Collaborative Genetics Study (OCGS). Multi-level latent class analysis was conducted based on the presence of eight co-morbid psychiatric conditions [generalized anxiety disorder (GAD), major depression, panic disorder (PD), separation anxiety disorder (SAD), tics, mania, somatization disorders (Som) and grooming disorders (GrD)]. The relationship of the derived classes to specific clinical characteristics was investigated.
Results
Two and three classes of OCD syndromes emerge from the analyses. The two-class solution describes lesser and greater co-morbidity classes and the more descriptive three-class solution is characterized by: (1) an OCD simplex class, in which major depressive disorder (MDD) is the most frequent additional disorder; (2) an OCD co-morbid tic-related class, in which tics are prominent and affective syndromes are considerably rarer; and (3) an OCD co-morbid affective-related class in which PD and affective syndromes are highly represented. The OCD co-morbid tic-related class is predominantly male and characterized by high conscientiousness. The OCD co-morbid affective-related class is predominantly female, has a young age at onset, obsessive–compulsive personality disorder (OCPD) features, high scores on the ‘taboo’ factor of OCD symptoms, and low conscientiousness.
Conclusions
OCD can be classified into three classes based on co-morbidity. Membership within a class is differentially associated with other clinical characteristics. These classes, if replicated, should have important implications for research and clinical endeavors.
Keywords: Latent class, OCD, subtypes
Introduction
Obsessive–compulsive disorder (OCD) is common, with a prevalence of 1–3% (Karno et al. 1988; Fontenelle et al. 2006; Ruscio et al. 2008). Individuals with OCD frequently have additional psychiatric disorders concomitantly or at some time during their lifetime (Angst et al. 2005), although not unique to OCD (Brown et al. 2001). It is useful to understand the relationship between the co-morbid conditions.
There are several explanations. First, OCD could increase the vulnerability to other disorders, similar to the way that immune deficiency syndromes increase vulnerability to illnesses. Second, there could be a common etiology between disorders; for example, smoking results in lung carcinoma and cardiovascular disease although the two are unrelated. Third, these conditions may be epiphenomena of the same condition, with the same etiology, only with diverse expression (Hettema, 2008).
The explanation of the relationship between OCD and its co-morbid conditions requires identification of an etiological agent(s) and/or underlying pathophysiological process(es). In this study we contribute to the explanatory process by investigating the hypothesis that co-morbid disorders are expressions of one or more latent classes, identification of which will reduce OCD heterogeneity and provide parsimonious phenotypic classes. We recognize that this approach assumes a categorical structure for the phenotype and that a dimensional structure is equally feasible (cf. Olatunji et al. 2007). We conducted multi-level latent class analysis of cases from the OCD Collaborative Genetic Study (OCGS). The relationship of the derived classes to specific clinical characteristics was investigated.
Method
Sample and diagnostic assessment
The OCGS is a collaboration among six US sites: Brown University; Columbia University; Johns Hopkins University (JHU) (coordinating center); Massachusetts General Hospital (MGH); The National Institute of Mental Health (NIMH); and the University of California at Los Angeles (UCLA). The details of the study are described elsewhere (Samuels et al. 2006). In brief, 999 subjects in 238 families were enrolled and are the focus of this paper.
Families with two or more members with DSM-IV OCD and symptom onset before age 18 years were assessed. Probands with schizophrenia, severe mental retardation, Tourette syndrome (TS) or OCD occurring exclusively during depression were excluded. Subjects were at least 7 years old. Written, informed consent (or assent, for children), approved by the institutional review boards, was obtained.
The Structured Clinical Interview for DSM-IV (SCID; Spitzer et al. 1992) was used for assessing Axis I diagnoses; amended for additional diagnoses (pathological nail biting, pathological skin picking, tricho-tillomania). The OCD section was adapted from the Schedule for Affective Disorders and Schizophrenia – Lifetime Anxiety Version Revised (SADS-LA-R; Mannuzza et al. 1986; Fyer et al. 1990). Inter-rater reliability (κ) was: 0.81 obsessions, 0.88 compulsions, 0.81 OCD, 0.77 separation anxiety disorder (SAD), 1.00 panic disorder (PD), 0.60 generalized anxiety disorder (GAD), and 0.82 major depressive disorder (MDD).
In adults, the Structured Instrument for the Diagnosis of DSM-IV Personality Disorders (SIDP-IV; Pfohl et al. 1989) was used to assess obsessive–compulsive personality disorder (OCPD). Individual OCPD criteria were summed to operationalize an OCPD score. Adult subjects self-completed the Revised NEO Personality Inventory (NEO-PI-R) questionnaire, a five-factor model of personality; T scores were used (Costa & McCrae, 1992).
Two expert research psychiatrists reviewed all diagnostic material independently to reach consensus on diagnoses and age at onset. All diagnostic assessments were reviewed at JHU to ensure inter-site comparability.
Five OCD symptom dimensions (symmetry/ordering, hoarding, doubt/checking, contamination/cleaning, and taboo thoughts) were developed from the Yale–Brown Obsessive–Compulsive Scale (YBOCS) symptoms (Pinto et al. 2008). A unit-based scoring method was developed by summing items with a factor loading >0.30. Correlation of these scales with the corresponding factor dimensions was excellent (Pearson’s r): symmetry/ordering (0.89); taboo thoughts (0.90); hoarding (0.99); doubt/checking (0.92); contamination/cleaning (0.98).
Both ‘definite diagnoses’ (all criteria met) and ‘probable diagnoses’ (most criteria met and no required criterion absent) of the eight disorders were used except for MDD and tics, which required a definite diagnosis.
Statistical methods
We used multi-level latent class analysis (MLCA) to explain associations among disorders by categorical latent class variables in multi-level or clustered samples. The latent class component describes the overall prevalence of each ‘ class ’ and the prevalence of each disorder within each class. The multi-level component characterizes strength of association between class memberships of family members by assuming that subjects from the same family share cluster-specific class prevalences that vary as ‘random effects’ from family to family. Vermunt (2003) described a model linking family-wise variation in class prevalences to normally distributed random effects. We used an alternative model assuming a Dirichlet distribution for the family-wise prevalences because it describes heterogeneity on the prevalence scale rather than transformation, complicating interpretation, and provides a convenient measure of heritability as the correlation between indicators of family members belonging to the same class.
Here we present a brief description of our multilevel model; a paper providing more details is available on request. Suppose that Yijk indicates whether the jth individual from the ith family has the kth disorder (1 if so, 0 otherwise), k=1, …, 8; Ỹij is the ‘pattern’ (vector) of 0/1 indicators across all disorders; and ηij denotes the subtype membership, among M types. A first-level equation describes the probabilities of all possible patterns in which disorder occurs, exactly like a standard latent class model:
| (1) |
The second-level equation allows the probabilities of class membership to vary from family to family, as Dirichlet-distributed random effects ui=(ui1, ui2, …, uiM):
| (2) |
As in the model of Vermunt, the assumption is that all correlation can be described by associations in true class memberships, and not in the occurrence of individual disorders once class membership is accounted for (Vermunt, 2003). As in traditional latent class analysis (LCA), the assumption is that all inter-disorder associations are accounted for by class memberships. If we take α0=α1+α2+···+αM, the average prevalence of class m in the population is given by αm/α0, and the correlation between variables indicating same-class membership among relatives can be calculated as
| (3) |
This quantity is a discrete-class analog of a heritability, or intra-class correlation (ICC), coefficient.
MLC models were fitted, by maximum likelihood estimation, to the binary diagnostic data, where subjects were assessed to be either ‘affected’ or ‘not affected ’. Eight disorders were included: GAD; MDD; SAD; PD; grooming disorders (GrD: trichotillomania, pathological skin picking); somatization disorders [Som; body dysmorphic disorder (BDD) and hypochondriasis]; bipolar disorder (Mania), and tics. Two-, three- and four-class models were fitted. The Bayesian Information Criterion (BIC; Schwartz, 1978) and residual checking (Hagenaars, 1988) were used to guide our choice among models with different numbers of classes. A lower BIC value implies a superior trade-off between model fit and model complexity, and thus is preferred. Multi-level structure complicates the interpretation of BIC; to overcome this, we evaluated the number of classes in a subset into which one subject per family was randomly selected, a valid approach by equation (1), and the reduction to a single level by the randomization procedure.
Once latent classes were specified, we determined relationships between class memberships and age at OCD symptom onset, gender, OCPD counts, NEO-PI-R factor scores, and unit-weighted OCD symptom factor scores. We conceptualized this as a latent polytomous logistic regression of class membership on the covariates. As memberships are not observed, we approximated this regression by first estimating each subject’s ‘ posterior ’ probability of belonging to each class implied by equations (1) and (2) above; applying a generalized logit transformation; and regressing the transformed probabilities (henceforth, ‘membership scores ’) on the covariates. Because the probability for the first class is determined by knowing the remaining probabilities, the number of independent membership scores is one less than the number of probabilities. We took the first class as the reference; then, membership scores are log odds of membership in each jth class as opposed to the first class, with j running from 2 to the number of classes, and exponentiated covariate coefficients are interpreted as odds ratios (ORs). Regression models were fitted by generalized estimating equations (GEEs; Liang & Zeger, 1986) to account for correlations between membership scores in the same subject and family. ‘Robust’ variance estimators were used to obtain standard errors; these are valid even if the analysis does not specify the correct correlation structure. Fitting was applied with both independence and exchangeable working correlation structures; the two methods yielded similar results.
Results
Seven hundred and six subjects (624 with definite OCD and 82 with probable OCD) of the 999 participants in the OCGS are included. Table 1 reports sample characteristics. There is missing information for most diagnoses (range 1.4–8.9%); most of these missing data are due to inconclusive information regarding diagnoses, an unfortunate consequence of limitations of a ‘one-occasion’ diagnostic assessment.
Table 1.
Obsessive–compulsive clinical features in subjects with OCDa in the OCD Collaborative Genetics Study sample
| Number of subjects with OCD | 706 |
| Gender, n (%) | |
| Men | 249 (35) |
| Women | 457 (65) |
| Age at interview (years), mean (range) | 36.3 (7–96) |
| Age at onset of OC symptomsb (years), mean (range) | 10.5 (5–70) |
| Co-morbid disorders, n (%) | |
| Generalized anxiety disorder (GAD) | 289 (43.1) |
| Separation anxiety disorder (SAD) | 161 (24.7) |
| Panic disorder (PD) | 132 (19.2) |
| Tics | 176 (26.2) |
| Major depressive disorder (MDD) | 243 (37.7) |
| Bipolar disorder, mania (Mania) | 47 (6.8) |
| Grooming disorders (GrD) | 256 (39.3) |
| Somatic disorders (Som) | 148 (23.0) |
| Obsessive–compulsive personality disorder (OCPD) | 91 (16.4) |
| YBOCS severity scorec, mean (range) | 24.4 (3–40) |
| OCD factor scoresd, mean (range) | |
| Taboo thoughts | 2.44 (0–14) |
| Symmetry/ordering | 2.31 (0–7) |
| Hoarding | 0.66 (0–2) |
| Doubt/checking | 2.27 (0–12) |
| Contamination/cleaning | 2.76 (0–13) |
| NEO-PI-R factor scorese, mean (range) | |
| Neuroticism | 62.4 (25.8–97.6) |
| Extraversion | 46.3 (9.62–81.4) |
| Openness | 51.8 (19.8–86.0) |
| Agreeableness | 48.6 (–2.33 to 87.2) |
| Conscientiousness | 45.5 (8.85–77.8) |
| Ever treated for OCD symptoms, n (%) of subjects | 489 (73) |
OCD, Obsessive–compulsive disorder; YBOCS, Yale–Brown Obsessive–Compulsive Scale; NEO-PI-R, Revised NEO Personality Inventory.
Definite and probable OCD.
Age at onset of obsessive–compulsive symptoms.
Worst-ever episode.
Unit-based scores.
NEO-PI-R T scores: average scores in the population are 50 (S.D.=10).
Model fitting
The BIC values for the two-, three- and four-class solutions were 1031, 1062 and 1093 respectively. Taken in isolation, these statistics suggest selection of the two-class model. Residual checking also suggested adequacy for describing the empirical data. However, sample sizes such as ours have limited statistical power to detect the need for expanded class structure, and the BIC is well known to underestimate the number of classes in such cases (Yang, 2006). In addition, as described later, the three-class model lends itself to better differentiation of major clinical characteristics of OCD. Therefore, we report both two- and three-class models. The former model found less and more highly co-morbid classes with respective estimated prevalences of 0.665 and 0.335 (Table 2). Disorder prevalences in the less co-morbid class ranged from <0.1 (Mania, PD, Som) to 0.16 (SAD) to approximately 0.25 (Tics, MDD, GrD, GAD); and in the more highly co-morbid class, from 0.17 (Mania) and 0.31 (Tics) to approximately 0.4 (PD, SAD) to 0.5–0.7 (Som, GrD, MDD, GAD). Tics were least distinguishing, and Som, MDD and GAD were most distinguishing. Table 3 presents the three-class solution.
Table 2.
Model fitting from the two-class multi-level latent class model
| Disorder | Class 1 |
Class 2 |
||
|---|---|---|---|---|
| Prob | 95% CI | Prob | 95% CI | |
| GAD | 0.30 | 0.24–0.36 | 0.69 | 0.59–0.77* |
| SAD | 0.16 | 0.11–0.21 | 0.42 | 0.34–0.51* |
| PD | 0.07 | 0.05–0.16 | 0.42 | 0.32–0.52* |
| Tics | 0.24 | 0.20–0.29 | 0.31 | 0.24–0.39 |
| MDD | 0.25 | 0.20–0.32 | 0.63 | 0.52–0.72* |
| Mania | 0.02 | 0.005–0.05 | 0.17 | 0.12–0.24* |
| GrD | 0.28 | 0.23–0.34 | 0.60 | 0.51–0.69* |
| Som | 0.08 | 0.05–0.14 | 0.52 | 0.41–0.62* |
| Average prevalence | 0.67 | 0.56–0.76 | 0.34 | 0.24–0.44 |
| Intra-cluster correlation | 0.35 (0.21–0.53) | |||
Prob, Probability; CI, confidence interval; GAD, generalized anxiety disorder; SAD, separation anxiety disorder; PD, panic disorder; MDD, major depressive disorder; GrD, grooming disorders (trichotillomania, pathological skin picking); Mania, bipolar disorder, mania; Som, somatic disorders (body dysmorphic disorder and hypochondriasis).
p<0.001.
Table 3.
Model fitting from the three-class multi-level latent class model
| Disorder | Class 1 |
Class 2 |
Class 3 |
|||
|---|---|---|---|---|---|---|
| Prob | 95% CI | Prob | 95% CI | Prob | 95% CI | |
| GAD | 0.12 | 0.05–0.25 | 0.56 | 0.42–0.69c | 0.67 | 0.58–0.76a |
| SAD | 0.11 | 0.05–0.20 | 0.26 | 0.17–0.37d | 0.41 | 0.33–0.50a |
| PD | 0.10 | 0.06–0.17 | 0.03 | 0.00–0.21 | 0.48 | 0.38–0.59af |
| Tics | 0.13 | 0.07–0.23 | 0.41 | 0.30–0.52c | 0.27 | 0.20–0.35b |
| MDD | 0.27 | 0.20–0.36 | 0.24 | 0.15–0.35 | 0.68 | 0.56–0.77ae |
| Mania | 0.03 | 0.01–0.09 | 0.00 | 0.00–1.00 | 0.19 | 0.13–0.27a |
| GrD | 0.16 | 0.08–0.28 | 0.48 | 0.37–0.59c | 0.59 | 0.50–0.68a |
| Som | 0.06 | 0.02–0.13 | 0.16 | 0.09–0.26 | 0.53 | 0.43–0.63af |
| Average prevalence | 0.34 | 0.27–0.52 | 0.32 | 0.20–0.46 | 0.30 | 0.22–0.39 |
| Intra-cluster correlation | 0.44 (0.30–0.59) | |||||
Prob, Probability; CI, confidence interval; GAD, generalized anxiety disorder; SAD, separation anxiety disorder; PD, panic disorder; MDD, major depressive disorder; GrD, grooming disorders (trichotillomania, pathological skin picking); Mania, bipolar disorder (mania); Som, somatic disorders (body dysmorphic disorder and hypochondriasis).
3 v. 1; p<0.001;
3 v. 1; p<0.05;
2 v. 1; p<0.001;
2 v. 1; p<0.05;
3 v. 2; p<0.001;
3 v. 2; p<0.05.
(1) The results in Table 3 are exponentiated coefficients. The interpretation for 0.517 in Table 1 model 1 is: Pr(C=2|female)/Pr(C=1|female)=0.52×Pr(C=2|male)/Pr(C=1|male).
(2) The model only includes 2 v. 1, 3 v. 1 parts. The 3 v. 2 results were calculated after fitting the models.
(3) Male is the reference group for gender.
(4) The number of subjects in the various models changes depending upon the subjects, with available clinical data for the variables entered into the model.
The prevalences of GAD (0.56 v. 0.12), Tics (0.41 v. 0.13) and GrD (0.48 v. 0.06) distinguish class 2 from class 1. Class 3 is different from class 1 in all eight of the disorder categories. Only Tics (0.41 v. 0.27) has higher loadings in class 2 compared to class 3 (p=0.07), whereas the loadings for PD (0.48 v. 0.03), MDD (0.68 v. 0.24), Mania (0.19 v. 0.00) and Som (0.53 v. 0.16) are greater in class 3 than in class 2. The most parsimonious construal of this class structure is that class 1 represents a ‘simple OCD’ class with limited or no co-morbidity; class 2 represents a class with greater co-morbidity than class 1, driven predominantly by Tics, GrD and GAD; and class 3 has a high level of co-morbidity with a substantial affective component (the term ‘affective’ is used in this paper to indicate emotional features that include anxiety and depression). Figure 1 illustrates the three-class structure. Each class is prevalent in one-third of the sample; thus, the three-class model divides the first class, in the two-class model, in half.
Fig. 1.
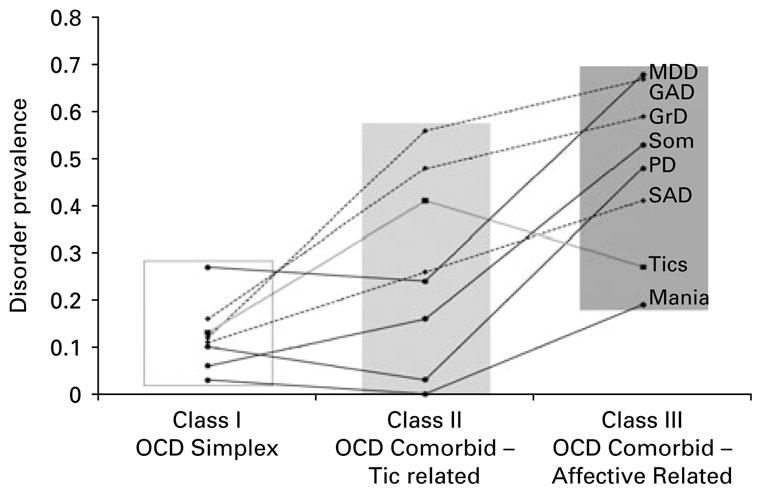
Prevalence of eight co-morbid disorders in three obsessive–compulsive disorder (OCD) classes. MDD, Major depressive disorder; GAD, generalized anxiety disorder; GrD, grooming disorders (trichotillomania, pathological skin picking); Som, somatic disorders; PD, panic disorder; SAD, separation anxiety disorder.
Estimated heritabilities were 0.35 for the two-class model [with 95% confidence interval (CI) 0.21–0.52] and 0.44 for the three-class model (with 95% CI 0.30–0.59).
Relationship of the classes to the additional clinical characteristics
Four regression models were fit, in which clinical variables were added sequentially. We report models predicting three-class memberships (Table 4); findings for the two-class models were very similar to those between classes 3 and 1 in what now follows. Comparing classes 2 and 1 in the three-class model, the sole significant finding is that subjects in class 2 are more likely to be male (OR for being female 0.48, p<0.05). Heightened risk for membership in this class was observed among subjects with a younger age at onset, less OCPD features, more symmetry/ordering and contamination/cleaning features and less doubt/checking, taboo thoughts, and hoarding, but none were significant. Membership in class 3 was associated with being female (OR 2.8, p<0.001), a younger age at onset (OR 0.96, p<0.05), greater OCPD features (OR 1.27, p<0.01), and greater symmetry/ordering (OR 1.27, p<0.01), taboo thoughts (OR 1.33, p<0.001), and hoarding symptoms (OR 1.40, N.S.), compared to class 1.
Table 4.
The results from regression of posterior class membership probabilities on covariates and OCD symptom factor scores
| Model 1 (n=691) | Model 2 (n=546) | Model 3 (n=691) | Model 4 (n=546) | |
|---|---|---|---|---|
| Class 2 versus class 1 | ||||
| Gender (female) | 0.52* | 0.49* | 0.52* | 0.48* |
| Age of onset | 0.99 | 0.99 | 0.99 | 0.99 |
| OCPD count | 0.99 | 0.99 | ||
| Unit-weighted factor scores | ||||
| Symmetry/ordering | 0.96 | 1.02 | ||
| Taboo thoughts | 0.98 | 0.95 | ||
| Hoarding | 0.92 | 0.92 | ||
| Doubt/checking | 0.91 | 0.92 | ||
| Contamination/cleaning | 1.06 | 1.06 | ||
| Class 3 versus class 1 | ||||
| Gender (female) | 2.69*** | 2.78** | 2.65*** | 2.84*** |
| Age of onset | 0.94*** | 0.93*** | 0.97* | 0.96* |
| OCPD count | 1.38*** | 1.27** | ||
| OCD symptom factor scores | ||||
| Symmetry/ordering | 1.27** | 1.27** | ||
| Taboo thoughts | 1.32** | 1.33*** | ||
| Hoarding | 1.48** | 1.40 | ||
| Doubt/checking | 0.99 | 0.94 | ||
| Contamination/cleaning | 1.04 | 1.06 | ||
| Class 3 versus class 2 | ||||
| Gender (female) | 5.20*** | 5.66*** | 5.06*** | 5.94*** |
| Age of onset | 0.95* | 0.94* | 0.99 | 0.98 |
| OCPD count | 1.39** | 1.29* | ||
| OCD symptom factor scores | ||||
| Symmetry/ordering | 1.32* | 1.25 | ||
| Taboo thoughts | 1.34** | 1.40** | ||
| Hoarding | 1.61* | 1.53 | ||
| Doubt/checking | 1.09 | 1.01 | ||
| Contamination/cleaning | 0.97 | 1.00 | ||
OCD, Obsessive–compulsive disorder; OCPD, obsessive–compulsive personality disorder.
p<0.05,
p<0.01,
p<0.001.
There was a similar, though even stronger, profile when comparing classes 3 and 2. Relative risk for class 3 subjects compared to class 2 subjects was much higher among females (OR 5.94, p<0.001), higher OCPD scores (OR 1.29, p<0.05), greater symmetry/ordering (OR 1.29, N.S.), taboo thoughts (OR 1.40, p<0.01), and hoarding symptoms (OR 1.53, N.S.). It should be noted that the ORs for both the hoarding factor and OCPD declined marginally in the model in which they are both included, reinforcing previous findings of a strong relationship between these two characteristics (Samuels et al. 2007). It should be borne in mind that for OCPD scores and OCD symptom factor scores, the ORs indicate the odds of an increase in one unit on the relevant scale.
The same four regression models were computed comparing the different classes but substituting the NEO-PI-R domains for the OCD symptom factors. (These were not included in the same models because sparse data precluded those analyses.) Controlling for the same variables as in Table 4, relative risk for membership in class 2 versus class 1 was heightened among subjects higher in neuroticism (OR 1.04, p<0.05) and conscientiousness (OR 1.03, p<0.05). Relative risk for membership in class 3 versus class 2 was heightened among subjects who were higher in neuroticism (OR 1.04, N.S.) and lower in conscientiousness (OR 0.944, p<0.001).
Age at interview
Age at interview could potentially affect the findings because participants may not have passed through the age of risk for a given disorder; retrospective recall bias; or different syndromes in children and adults. We therefore repeated the regression analyses, adding age at interview to the models. Exploratory plots suggested a linear relationship with this variable for the class 2 versus class 1 comparison but showed clear curvature for the class 3 versus class 1 comparison. To capture the curvature we modeled the latter comparison with a linear spline with a knot at 40 years of age (i.e. two lines constrained to connect at age 40), commensurate with the exploratory plot. In the analog of model 2, older age at interview was associated with reduced relative risk of class 2 type, as opposed to class 1 type OCD (yearly OR 0.977, 95% CI 0.959–0.996). There was a trivial relationship of age with the relative risk of class 3 type as opposed to class 1 type OCD among younger individuals but a tendency to decreased relative risk after age 40 (OR decreased by 5.82% per year, 95% CI 0.2–11.2). Including NEO scores, the association with the class 2 versus class 1 comparison was attenuated well below statistical significance, but the class 3 versus class 1 association was exacerbated. With factor scores included, both age relationships were attenuated to marginal significance. This suggests that younger individuals are more likely to be in class 2, and the much older individuals (>40) are likely to exhibit fewer co-morbid conditions.
Discussion
Class structure
The MLCA found co-morbidity occurrence to be consistent with the presence of OCD classes, that is subtypes. Two classes distinguished less, and more, co-morbidity, (respectively two-thirds, and one-third, of the cases). Being more highly co-morbid was associated with female sex, younger age at onset, more OCPD features, symmetry/ordering, taboo thoughts and hoarding symptoms, and greater neuroticism and less conscientiousness; consistent with prior reports (Hasler et al. 2007; Samuels et al. 2007; de Mathis et al. 2008). An analysis distinguishing subtypes essentially split the less co-morbid class into an ‘OCD Simplex’ group and an ‘OCD Co-morbid tic-related ’ group, with significantly higher loadings than the OCD Simplex group for GAD, Tics and GrD, and the highest Tic loading of any class. This group was significantly distinguished from the OCD Simplex group by 2:1 odds among men as compared to women and heightened occurrence among highly neurotic, and highly conscientious, persons. These distinctions indicate a different patient profile, one that appears meaningful in distinguishing the two classes.
In the OCD Simplex group, the disorder with the highest loading was MDD. This could suggest that MDD is an exceptionally common accompaniment of OCD. We would assert that it is a secondary event and not necessarily part of the syndrome in the OCD Simplex case (Nestadt et al. 2001).
The classes could be construed as having increasing co-morbidity on moving from class 1 to class 3; this may suggest increasing severity, and may even be seen as a dimension of severity. Class 3 would be construed as a ‘highly co-morbid’ class (on average, participants in this class have about five additional psychiatric diagnoses) or as an ‘affective OCD’ class.
Alternatively, class 2 could be seen as a group of cases primarily marked by the presence of tics. The higher loading for the GrDs in this case may support the hypothesis that these impulse control disorders are indeed a part of the tic/TS family as proposed by Lochner et al. (2005). Furthermore, it is reasonably well established that anxiety is a common accompaniment of tic disorders (Swain et al. 2007). There has been interest in the relationship between TS and OCD; OCD and tic disorders ‘run’ in the same families (Pauls et al. 1995). Findings from this study may suggest a discrete OCD subtype related to tic disorders (class 2 OCD Co-morbid tic-related). Against this interpretation is the relatively high loading of lifetime tics in class 3; the difference between the probabilities of tics in class 2 versus class 3 is marginal (p=0.07).
It is of note that the heritability estimates of the class structures ranged from 0.37 to 0.49. These estimates are consistent with heritability estimates of OCD in the literature. This also provides support for the utility of these disorder classes in future genetic studies.
Sex differences
The strongest finding is that males are over-represented in class 2, whereas class 3 has an over-representation of females. This is consistent with construing class 2 as a ‘ tic ’ class, typically male, and class 3 as an ‘affective’ class, typically female. This construal would suggest that ‘maleness’ increased the likelihood of one set of disorders and ‘femaleness’ another, a potential example of sexual dimorphism. Neither is etiologically distinct from the other, this being exclusively an epiphenomenon. However, it is plausible that there are etiologically distinct forms of ‘male-related OCD’ and ‘female-related OCD’. In support of this latter hypothesis are certain genetic studies that have found a differential association with respect to specific candidate genes and OCD (Arnold et al. 2006; Dickel et al. 2006). Our own work has identified significant linkage findings to chromosome 11 exclusively among male probands’ families (Wang et al. 2008).
Age at onset
The three classes have progressively earlier ages at onset. Studies have consistently found a higher degree of familiality in younger age-at-onset cases (Pauls et al. 1995; Nestadt et al. 2000; Hanna et al. 2005). There are also reports that tic-related OCD has a younger age at onset and a higher level of co-morbidity in the younger age-at-onset patients (Diniz et al. 2006). Carter et al. (2004) showed that OCD, PD, GAD and MDD co-occurred frequently, particularly in early-onset OCD cases.
Obsessive–compulsive personality
A relationship between OCD and OCPD has been described since Pierre Janet’s original description of psychaesthenia (Janet, 1903). In this study we treated OCPD as the raw score of a dimension of the DSM-IV criteria rather than a DSM-IV diagnosis (Nestadt et al. 2006). OCPD features were significantly associated with elevated risk for membership in class 3. This suggests that the relationship of OCPD features to OCD is most strongly linked to that subgroup with a greater affective disorder component. This is compatible with work by Coles et al. (2008), who reported that OCPD in conjunction with OCD indicated a potential OCD subtype; finding, as we have, younger age at onset and a higher frequency of anxiety disorders. Two groups (Eisen et al. 2006; Fineberg et al. 2007) have proposed the importance of an OCPD-OCD subgroup as well as including OCPD within the purview of OCD.
OCD symptom factors
There is substantial agreement between studies to classify OCD symptoms into four or five dimensions. In this study we investigated the relationship between five symptom factor dimensions (as a unit-based dimensional score; Pinto et al. 2008) and the disorder classes. The dimensions ‘taboo thoughts’ and, to a lesser extent, ‘hoarding’ were strongly related to class 3. ‘Taboo thoughts’, which include obsessions of an aggressive, religious and sexual nature, include the symptoms most likely to be related to affective syndromes. The expected positive relationship between hoarding and OCPD is borne out in these analyses. Hoarding is related strongly to class 3, but with OCPD in the same model this relationship weakens. It is a surprise that ‘symmetry/order’, which is typically associated with tics (Leckman et al. 2003), shows a stronger relationship to class 3 than class 2. However, the symmetry/ordering category was strongly related to OCPD in an OCD sample (Coles et al. 2008); this is also consistent with the report by Hasler et al. (2005), who found a strong relationship between symmetry/ordering and bipolar disorder.
The five-factor model of personality
Samuels et al. (2000) have shown a strong relationship between both neuroticism and conscientiousness and OCD. This is borne out in this study in which neuroticism scores are extremely high for OCD subjects, and tend to be even higher for both class 2 and class 3, the highly co-morbid classes. This suggests that the likelihood of additional psychiatric syndromes increases with increasing neuroticism.
A more interesting, and potentially more useful, finding is that higher conscientiousness scores are associated with elevated risk for class 2 type comorbidity, whereas lower conscientiousness scores are associated with elevated risk for class 3 type comorbidity. It might be anticipated that the prototypical ‘compulsive’ individual would score high on conscientiousness and, by extension, individuals with OCD. However, Samuels et al. (2000) have shown that the opposite is true; that individuals with OCD typically score low on this personality dimension. The finding that class 2 patients score high on conscientiousness may suggest that this personality trait may be useful in distinguishing the classes (adding to the utility of having three as opposed to two classes), and could represent an important element of an endophenotype of these potential OCD syndromes.
Prior latent class study
We previously conducted a study to identify OCD subgroups based on co-morbid conditions that suggested two OCD subclasses: one characterized by increasing co-morbidity with depression, GAD, impulse control disorders, and eating disorders; and another in which panic disorder and tics predominated (Nestadt et al. 2003). Reinterpreting the findings of that study, in the light of the present study, suggests that distinctions based on frequency of co-morbidity are consistent between studies; however, the two studies are inconsistent with respect to the earlier study’s identification of a tic and PD class, whereas the current study suggests that PD be classified with other affective conditions and not with tics. In both studies tics occurred in all classes and were not unique to any of the classes, and may not be a particularly sensitive or specific characteristic for classification. Moreover, the two studies differ in important ways that may also have influenced the results. The current study includes exclusively familial cases of OCD, whereas the earlier study included non-familial cases of OCD and also their relatives who were not diagnosed with OCD. This study has a larger sample size and uses more sophisticated statistical techniques, including taking familial clustering into account.
Future implications
A high level of co-morbidity is a dilemma from both a clinical and a research perspective. Although patients do present with multiple independent disorders, diagnosing several disorders in a single patient, if these disorders are related, is unsatisfactory. There may be several alternate explanations: a common risk factor; or disorders lead to each other; or pleotropy, in which the same condition is expressed differently. This study approached the co-morbidity ‘head on’ and offers a particular solution offering a viable testable hypothesis. Further studies are essential.
These findings have a bearing on the development of DSM-V. There is controversy as whether to include OCD among anxiety disorders; whether to include OCPD with OCD in the nomenclature; and whether to include other ‘OCD spectrum’ conditions with OCD. These findings offer a further alternative; different subtypes of OCD may have different relationships to other Axis I conditions, and may be more heterogeneous than previously recognized. Reducing heterogeneity has enormous implications for research and treatment. It provides the opportunity to focus on specific OCD subpopulations, both to identify more specific treatment strategies and to investigate etiology and pathology with reduced misclassification marring the effort.
Limitations
The sample included in this study was ascertained to conduct genetic studies and is highly familial. The lack of independence within family members was dealt with in the analytic procedure. Nevertheless, the findings may be valid only in a familial sample and may not be representative of all cases of OCD. Only probands with age at onset <18 years were included in the sample. This may also reduce generalizability.
We limited the number of Axis I disorders in the analysis to facilitate the analytic strategy. We were selective in the inclusion of disorders; increasing the number and including different disorders may have led to different results. The selection was based on a subjective review of the literature; based on frequency of co-morbidity and likelihood that the disorders may distinguish subgroups. Eating disorders or attention deficit hyperactivity disorder (ADHD), for instance, could have been included had we not wanted to limit the number of included disorders. We combined certain disorders, specifically trichotillomania and nail biting (GrD), and hypochondriasis and BDD (Som), into groups that we believed to be congruous, to reduce the number of disorders. This combination was arbitrary and could have led to unforeseen biases. TS in probands was an exclusion criterion to reduce the heterogeneity of the sample; it may have led to an underestimate of the prevalence of cases in class 2.
There was an uneven distribution of missing data for the different variables. No imputation procedure was used, as we expected that to be less helpful than to use only the subjects with known data points. However, latent class models were fit by the expectation–maximization algorithm (Dempster et al. 1977) and thus did not exclude subjects with partial data. Subsequent regression analyses did exclude individuals without data on the primary predictors, notably OCPD features and the NEO scores, and in some circumstances this did markedly reduce the number of subjects available. Both analyses are valid up to missing at random (Rubin, 1976); that is, so long as there were no systematic differences on missing responses after accounting for systematic differences in measured responses, to the extent that the exchangeable association analysis is reasonable.
The selection of class number is a difficult task, particularly in samples that are moderately sized and yet must consider a wide range of indicators (i.e. disorders). However, it should be kept in mind that ‘model selection ’ in exploratory latent class models is based upon the ‘conditional independence’ criterion, that is seeking the smallest number of classes that appear to account for all inter-disorder relationships. Our formal model selection process did not strongly support an added benefit for describing symptom co-occurrence by splitting the lightly co-morbid class into simplex and Tics/GAD/GrD groups. This could reflect actual population structure or low power for detecting an added benefit. In either case, conditional independence is only one, and not necessarily the most clinically relevant, criterion for distinguishing groups. However, these classes provide a useful (and, it is hoped, etiologically significant) solution: the one class with conscientious males with tics, and the other without these features. Replication should be pursued.
We used a five-factor model for the OCD symptom factors (Pinto et al. 2008). Other investigators have used four-factor models (Hasler et al. 2007). It should be noted that the five-factor model is based on individual OCD symptoms rather than presupposed symptom categories.
Acknowledgments
We thank the many families participating in the study, Drs D. Housman, K. Merikangas, A. Pulver and A. Wilson for consultation, and clinicians and coordinators at each site. This work was funded by National Institute of Health grants R01-MH-50214, K23-MH-64543 and NIH/NCRR/OPD-GCRC RR00052.
Footnotes
Declaration of Interest
None.
References
- Angst J, Gamma A, Endrass J, Hantouche E, Goodwin R, Ajdacic V, Eich D, Rossler W. Obsessive-compulsive syndromes and disorders: significance of comorbidity with bipolar and anxiety syndromes. European Archives of Psychiatry and Clinical Neuroscience. 2005;255:65–71. doi: 10.1007/s00406-005-0576-8. [DOI] [PubMed] [Google Scholar]
- Arnold PD, Sicard T, Burroughs E, Richter MA, Kennedy JL. Glutamate transporter gene SLC1A1 associated with obsessive-compulsive disorder. Archives of General Psychiatry. 2006;63:769–776. doi: 10.1001/archpsyc.63.7.769. [DOI] [PubMed] [Google Scholar]
- Brown TA, Campbell LA, Lehman CL, Grisham JR, Mancill RB. Current and lifetime comorbidity of the DSM-IV anxiety and mood disorders in a large clinical sample. Journal of Abnormal Psychology. 2001;110:585–599. doi: 10.1037//0021-843x.110.4.585. [DOI] [PubMed] [Google Scholar]
- Carter AS, Pollock RA, Suvak MK, Pauls DL. Anxiety and major depression comorbidity in a family study of obsessive-compulsive disorder. Depression and Anxiety. 2004;20:165–174. doi: 10.1002/da.20042. [DOI] [PubMed] [Google Scholar]
- Coles ME, Pinto A, Mancebo MC, Rasmussen SA, Eisen JL. OCD with comorbid OCPD: a subtype of OCD? Journal of Psychiatric Research. 2008;42:289–296. doi: 10.1016/j.jpsychires.2006.12.009. [DOI] [PubMed] [Google Scholar]
- Costa PT, McCrae RR. Revised NEO Personality Inventory (NEO-PI-R) and NEO Five-Factor Inventory (NEO-FFI) Professional Manual. Psychological Assessment Resources, Inc; Odessa, FL: 1992. [Google Scholar]
- de Mathis MA, do Rosario MC, Diniz JB, Torres AR, Shavitt RG, Ferrão YA, Fossaluza V, de Bragança Pereira CA, Miguel EC. Obsessive-compulsive disorder: influence of age at onset on comorbidity patterns. European Journal of Psychiatry. 2008;3:187–194. doi: 10.1016/j.eurpsy.2008.01.002. [DOI] [PubMed] [Google Scholar]
- Dempster AP, Laird NM, Rubin DB. Maximum likelihood from incomplete data via the EM algorithm. Journal of the Royal Statistical Society, Series B. 1977;39:1–22. [Google Scholar]
- Dickel DE, Veenstra-VanderWeele J, Cox NJ, Wu X, Fischer DJ, Van Etten-Lee M, Himle JA, Leventhal BL, Cook EH, Jr, Hanna GL. Association testing of the positional and functional candidate gene SLC1A1/EAAC1 in early-onset obsessive-compulsive disorder. Archives of General Psychiatry. 2006;63:778–785. doi: 10.1001/archpsyc.63.7.778. [DOI] [PubMed] [Google Scholar]
- Diniz JB, Rosario-Campos MC, Hounie AG, Curi M, Shavitt RG, Lopes AC, Miguel EC. Chronic tics and Tourette syndrome in patients with obsessive-compulsive disorder. Journal of Psychiatric Research. 2006;40:487–493. doi: 10.1016/j.jpsychires.2005.09.002. [DOI] [PubMed] [Google Scholar]
- Eisen JL, Coles ME, Shea MT, Pagano ME, Stout RL, Yen S, Grilo CM, Rasmussen SA. Clarifying the convergence between obsessive compulsive personality disorder criteria and obsessive compulsive disorder. Journal of Personality Disorders. 2006;20:294–305. doi: 10.1521/pedi.2006.20.3.294. [DOI] [PMC free article] [PubMed] [Google Scholar]
- Fineberg NA, Sharma P, Sivakumaran T, Sahakian B, Chamberlain SR. Does obsessive-compulsive personality disorder belong within the obsessive-compulsive spectrum? CNS Spectrum. 2007;12:467–482. doi: 10.1017/s1092852900015340. [DOI] [PubMed] [Google Scholar]
- Fontenelle LF, Mendlowicz MV, Versiani M. The descriptive epidemiology of obsessive-compulsive disorder. Progress in Neuropsychopharmacology and Biological Psychiatry. 2006;30:327–337. doi: 10.1016/j.pnpbp.2005.11.001. [DOI] [PubMed] [Google Scholar]
- Fyer AJ, Endicott J, Mannuzza S, Klein DF. Updated for DSM-III-R (SADS-LA-R). Anxiety Family Genetic Unit. New York State Psychiatric Institute; New York: 1990. Schedule for Affective Disorders and Schizophrenia – Lifetime Version, Modified for the Study of Anxiety Disorders. [DOI] [PubMed] [Google Scholar]
- Hagenaars JA. Latent structure models with direct effects between indicators: local dependence models. Sociological Methods and Research. 1988;16:379–405. [Google Scholar]
- Hanna GL, Himle JA, Curtis GC, Gillespie BW. A family study of obsessive-compulsive disorder with pediatric probands. American Journal of Medical Genetics, Part B: Neuropsychiatric Genetics. 2005;134:13–29. doi: 10.1002/ajmg.b.30138. [DOI] [PubMed] [Google Scholar]
- Hasler G, LaSalle-Ricci VH, Ronquillo JG, Crawley SA, Cochran LW, Kazuba D, Greenberg BD, Murphy DL. Obsessive-compulsive disorder symptom dimensions show specific relationships to psychiatric comorbidity. Psychiatry Research. 2005;135:121–132. doi: 10.1016/j.psychres.2005.03.003. [DOI] [PubMed] [Google Scholar]
- Hasler G, Pinto A, Greenberg BD, Samuels J, Fyer AJ, Pauls D, Knowles JA, McCracken JT, Piacentini J, Riddle MA, Rauch SL, Rasmussen SA, Willour VL, Grados MA, Cullen B, Bienvenu OJ, Shugart YY, Liang KY, Hoehn-Saric R, Wang Y, Ronquillo J, Nestadt G, Murphy DL. OCD Collaborative Genetics Study. Familiality of factor analysis-derived YBOCS dimensions in OCD-affected sibling pairs from the OCD Collaborative Genetics Study. Biological Psychiatry. 2007;61:617–625. doi: 10.1016/j.biopsych.2006.05.040. [DOI] [PubMed] [Google Scholar]
- Hettema JM. What is the genetic relationship between anxiety and depression ? American Journal of Medical Genetics, Part C: Seminars in Medical Genetics. 2008;148:140–146. doi: 10.1002/ajmg.c.30171. [DOI] [PubMed] [Google Scholar]
- Janet P. Obsessions and Psychasthenia [in French] Bailliere; Paris: 1903. [Google Scholar]
- Karno M, Golding JM, Sorenson SB, Burnham MA. The epidemiology of obsessive-compulsive disorder in five US communities. Archives of General Psychiatry. 1988;45:1094–1099. doi: 10.1001/archpsyc.1988.01800360042006. [DOI] [PubMed] [Google Scholar]
- Leckman JF, Pauls DL, Zhang H, Rosario-Campos MC, Katsovich L, Kidd KK, Pakstis AJ, Alsobrook JP, Robertson MM, McMahon WM, Walkup JT, van de Wetering BJ, King RA, Cohen DJ. Tourette Syndrome Association International Consortium for Genetics. Obsessive-compulsive symptom dimensions in affected sibling pairs diagnosed with Gilles de la Tourette syndrome. American Journal of Medical Genetics, Part B: Neuropsychiatric Genetics. 2003;116:60–68. doi: 10.1002/ajmg.b.10001. [DOI] [PubMed] [Google Scholar]
- Liang KY, Zeger SL. Longitudinal data analysis using generalized linear models. Biometrika. 1986;73:13–22. [Google Scholar]
- Lochner C, Hemmings SM, Kinnear CJ, Niehaus DJ, Nel DG, Corfield VA, Moolman-Smook JC, Seedat S, Stein DJ. Cluster analysis of obsessive-compulsive spectrum disorders in patients with obsessive-compulsive disorder: clinical and genetic correlates. Comprehensive Psychiatry. 2005;46:14–19. doi: 10.1016/j.comppsych.2004.07.020. [DOI] [PubMed] [Google Scholar]
- Mannuzza S, Fyer AJ, Klein DF, Endicott J. Schedule for Affective Disorders and Schizophrenia – Lifetime Version modified for the study of anxiety disorders (SADS-LA): rationale and conceptual development. Journal of Psychiatric Research. 1986;20:317–325. doi: 10.1016/0022-3956(86)90034-8. [DOI] [PubMed] [Google Scholar]
- Nestadt G, Addington A, Samuels J, Liang KY, Bienvenu OJ, Riddle M, Grados M, Hoehn-Saric R, Cullen B. The identification of OCD-related subgroups based on comorbidity. Biological Psychiatry. 2003;53:914–920. doi: 10.1016/s0006-3223(02)01677-3. [DOI] [PubMed] [Google Scholar]
- Nestadt G, Hsu FC, Samuels J, Bienvenu OJ, Reti I, Costa PT, Jr, Eaton WW. Latent structure of the Diagnostic and Statistical Manual of Mental Disorders, Fourth Edition, personality disorder criteria. Comprehensive Psychiatry. 2006;47:54–62. doi: 10.1016/j.comppsych.2005.03.005. [DOI] [PubMed] [Google Scholar]
- Nestadt G, Samuels J, Riddle M, Bienvenu OJ, 3rd, Liang KY, LaBuda M, Walkup J, Grados M, Hoehn-Saric R. A family study of obsessive-compulsive disorder. Archives of General Psychiatry. 2000;57:358–363. doi: 10.1001/archpsyc.57.4.358. [DOI] [PubMed] [Google Scholar]
- Nestadt G, Samuels J, Riddle MA, Liang KY, Bienvenu OJ, Hoehn-Saric R, Grados M, Cullen B. The relationship between obsessive-compulsive disorder and anxiety and affective disorders: results from the Johns Hopkins OCD Family Study. Psychological Medicine. 2001;31:481–487. doi: 10.1017/s0033291701003579. [DOI] [PubMed] [Google Scholar]
- Olatunji BO, Williams BJ, Haslam N, Abramowitz JS, Tolin DF. The latent structure of obsessive-compulsive symptoms: a taxometric study. Depression and Anxiety. 2007 doi: 10.1002/da.20387. Published online 17 October 2007. [DOI] [PubMed] [Google Scholar]
- Pauls DL, Alsobrook JP, Goodman W, Rasmussen S, Leckman JF. A family study of obsessive-compulsive disorder. American Journal of Psychiatry. 1995;152:76–84. doi: 10.1176/ajp.152.1.76. [DOI] [PubMed] [Google Scholar]
- Pfohl B, Blum N, Zimmerman M, Stangl D. Structured Interview for DSM-IIIR Personality (SIDP-R) University of Iowa College of Medicine; Iowa City, IA: 1989. [Google Scholar]
- Pinto A, Greenberg BD, Grados MA, Bienvenu OJ, 3rd, Samuels JF, Murphy DL, Hasler G, Stout RL, Rauch SL, Shugart YY, Pauls DL, Knowles JA, Fyer AJ, McCracken JT, Piacentini J, Wang Y, Willour VL, Cullen B, Liang K, Hoehn-Saric R, Riddle MA, Rasmussen SA, Nestadt G. Further development of YBOCS dimensions in the OCD Collaborative Genetics Study: symptoms vs. categories. Psychiatry Research. 2008;15:83–93. doi: 10.1016/j.psychres.2007.07.010. [DOI] [PMC free article] [PubMed] [Google Scholar]
- Rubin DB. Inference and missing data. Biometrika. 1976;63:581–590. [Google Scholar]
- Ruscio AM, Stein DJ, Chiu WT, Kessler RC. The epidemiology of obsessive-compulsive disorder in the National Comorbidity Survey Replication. Molecular Psychiatry. 2008 doi: 10.1038/mp.2008.94. Published online 26 August 2008. [DOI] [PMC free article] [PubMed] [Google Scholar]
- Samuels J, Nestadt G, Bienvenu OJ, Costa PT, Jr, Riddle MA, Liang KY, Hoehn-Saric R, Grados MA, Cullen BA. Personality disorders and normal personality dimensions in obsessive-compulsive disorder. British Journal of Psychiatry. 2000;177:457–462. doi: 10.1192/bjp.177.5.457. [DOI] [PubMed] [Google Scholar]
- Samuels JF, Bienvenu OJ, 3rd, Pinto A, Fyer AJ, McCracken JT, Rauch SL, Murphy DL, Grados MA, Greenberg BD, Knowles JA, Piacentini J, Cannistraro PA, Cullen B, Riddle MA, Rasmussen SA, Pauls DL, Willour VL, Shugart YY, Liang KY, Hoehn-Saric R, Nestadt G. Hoarding in obsessive-compulsive disorder: results from the OCD Collaborative Genetics Study. Behavior Research and Therapy. 2007;45:673–686. doi: 10.1016/j.brat.2006.05.008. [DOI] [PubMed] [Google Scholar]
- Samuels JF, Riddle MA, Greenberg BD, Fyer AJ, McCracken JT, Rauch SL, Murphy DL, Grados MA, Pinto A, Knowles JA, Piacentini J, Cannistraro PA, Cullen B, Bienvenu OJ, 3rd, Rasmussen SA, Pauls DL, Willour VL, Shugart YY, Liang KY, Hoehn-Saric R, Nestadt G. The OCD Collaborative Genetics Study: methods and sample description. American Journal of Medical Genetics, Part B: Neuropsychiatric Genetics. 2006;141:201–207. doi: 10.1002/ajmg.b.30224. [DOI] [PMC free article] [PubMed] [Google Scholar]
- Schwartz G. Estimating the dimension of a model. Annals of Statistics. 1978;6:461–464. [Google Scholar]
- Spitzer RL, Williams JBW, Gibbon M, First MB. The structured clinical interview for DSM-III-R. I: History, rationale, and description. Archives of General Psychiatry. 1992;49:624–629. doi: 10.1001/archpsyc.1992.01820080032005. [DOI] [PubMed] [Google Scholar]
- Swain JE, Scahill L, Lombroso PJ, King RA, Leckman JF. Tourette syndrome and tic disorders: a decade of progress. Journal of the American Academy of Child and Adolescence Psychiatry. 2007;46:947–968. doi: 10.1097/chi.0b013e318068fbcc. [DOI] [PubMed] [Google Scholar]
- Vermunt JK. Multilevel latent class models. Sociological Methodology. 2003;33:213–239. [Google Scholar]
- Wang Y, Samuels J, Chang Y, Grados M, Greenberg B, Knowles J, McCracken J, Rauch S, Murphy D, Rasmussen S, Cullen B, Hoehn-Saric R, Pinto A, Fyer A, Piacentini J, Pauls D, Bienvenu O, Riddle M, Shugart Y, Liang K, Nestadt G. Gender differences in genetic linkage and association on 11p15 in obsessive-compulsive disorder families. American Journal of Medical Genetics, Part B: Neuropsychiatric Genetics. 2008 doi: 10.1002/ajmg.b.30760. Published online 18 April 2008. [DOI] [PubMed] [Google Scholar]
- Yang CC. Evaluating latent class analysis models in qualitative phenotype identification. Computational Statistics and Data Analysis. 2006;50:1090–1104. [Google Scholar]