Abstract
Objective
Although it is well-established that the application of local heat causes a biphasic increase in skin blood flow, the responsible microvessels have not been identified.
Methods
A bifurcating network of arterioles (1st-5th orders, 60-15 μm, n=10 per group) of the intact, unanesthetized, translucent bat wing were visualized on a transparent heat plate via intravital microscopy. Similar to previous bat wing studies, plate temperature was set at 25°C for 10 min then increased to 37°C for 20 min. Vessel diameter and red blood cell velocity were recorded and used to calculate resistance and blood flow.
Results
The average flow response in arterioles was biphasic (p=0.02) and proportional to the temporal decrease in total resistance calculated from 1st-5th order arterioles. Metarteriole (i.e., 5th order arteriole) resistance had the greatest impact on total resistance (-67.0±20.7%), and exhibited a biphasic trend that was opposed by temporal changes in resistance of 1st-4th order arterioles.
Conclusion
Metarterioles are not only necessary, but sufficient to explain the origin of the biphasic flow response in skin blood flow.
Keywords: Local Heat, Bat Wing, Microcirculation, Skin Blood Flow
INTRODUCTION
Local heat produces a biphasic flow response
Human skin blood flow responds to a local temperature increase with a biphasic increase in flow [16,26]. With heat, skin blood flow initially increases and peaks at 3-5 minutes, encounters a brief nadir, then returns to peak values after 10 minutes [5]. The initial phase is sensorineural mediated, and the response can be reduced with the application of local anesthetics. The second phase is due to a nitric oxide (NO)-dependent mechanism, and the response can be reduced with nitric oxide synthase (NOS) inhibitors [5,14,16,26]. Typically, measurements are made in human subjects via Laser Doppler Fluximetry (LDF) on a portion of non-glabrous, or “hairy”, skin. Because of an inherent inability of LDF studies to quantify individual vessel diameters, the particular microvessels responsible for the biphasic increase in flow have not been identified. Nonetheless, investigators have attempted to develop diagnostic tools for such pathologies as peripheral vascular disease [20,27] based on the biphasic flow response (BFR) to heat.
Pallid bat wing is a thermoregulatory organ with a biphasic arteriolar flow response
The bat wing has long been used as a model to study the microcirculation in a controlled, non-invasive, in vivo preparation [7,41,42]. This model was favored because investigators could characterize the hemodynamics and structure of individual vessels of the thin, translucent wing without the confounding effects of anesthesia and surgical trauma. Arterioles have been found to dilate with decreased pressure (the myogenic effect) [9,42], deinnervation [41], and increased metabolic factors [1,2]. The bat wing has also been found to be innervated by the autonomic nervous system [12]. Additionally, the bat wing microcirculation has been reported to constrict with epinephrine and norepinephrine [25] and dilate with acetylcholine, serotonin [37], and increased luminal flow [8]. Most importantly, the bat wing model previously has been shown to be a thermoregulatory organ analogous to human skin, and the application of heat increases vascular diameter, vasomotion, interstitial pressure, and blood flow [3,18,33,38]. Relying on the ability to quantify blood flow in individual arterioles, Widmer et al. [39] reported a biphasic flow increase with the application of local heat. The initial phase is largely governed by sensorineural mechanisms and the secondary phase is primarily mediated by NO [39]. Although capillary recruitment has been recently shown to be responsible for nearly half the increase in blood flow with local heat, the temporal increase in capillary recruitment does not explain the origin of the BFR [40].
Total resistance in a network determines blood flow
Changes in blood flow in a particular arteriole may not correlate with changes in its radius [13], because blood flow depends on total resistance of the arteriolar network. The mechanical factors that affect total network resistance can be identified by intravital microscopy. First, the quantity of smooth muscle (and thus the wall thickness to radius ratio) is related to the ability of an arteriole to maximally dilate [15,19,30]. Second, changes in luminal radii of an arteriole with local heat can be characterized [39]. Third, changes in resistance of an arteriole can be estimated from measurement of both radius and length. Determining how individual vessels impact total arteriolar resistance (and thus blood flow), however, requires the implementation of a network model [21]. We therefore used the Pallid bat wing and a simple network model to determine the origin of the biphasic flow response to local heat.
MATERIALS AND METHODS
Experimental procedures and animal care were performed in compliance with the Texas A&M University Institutional Animal Care and Use Committee. Experimental procedures were similar to those reported previously [39]. Female bats (n=10) were utilized for these studies, because male bats were resistant to training. Training over a period of months made bats amenable to light restraint, and bats refrained from moving their wings, even when awake. Additionally, no individual bat was used for experimentation more than once per week, and no bats were used for consecutive experiments. Bats were housed in a room with a constant temperature year-round. This thermal stability results in the lack of a true estrus cycle, as well as low circulating estrogen and progesterone levels similar to those of the late summer months [28]. Unanesthetized bats were placed in a plastic box attached to a heat plate connected to a temperature controller (Olympus Tokai Hit, 2004). The vascular area was visualized with an intravital microscope (Olympus BX61WI Fixed Stage Upright Microscope, 2003) utilizing a water-immersion lens at 400x magnification, and the image was recorded via digital video recorder (Panasonic KR222 S-Video Camera, 2004). The computer recorded and analyzed the image with specially-designed diameter tracker software (LabView 7.1) [24]. Additionally, an optical Doppler velocimeter (Optical Doppler Velocimeter Model #4, A&M Health Systems, 2003) was attached to the microscope to record centerline red blood cell velocity. Vessel diameter and velocity were recorded by the LabView 7.1 software at 30 frames per second. In accordance with accepted practice for optical Doppler velocimeters with a slit width of 0.87 mm [6], mean velocity was estimated by dividing centerline velocity by 1.3 in vessels with diameters greater than 25 μm and 1.2 in vessels with diameters less than 25 μm [10].
The temperature of the room was maintained at a constant 25.0 °C throughout the duration of experimentation. The region of the wing pressed down on the glass of the heat plate was restricted to the specific area of study, no larger than the microvascular network (4 cm2).
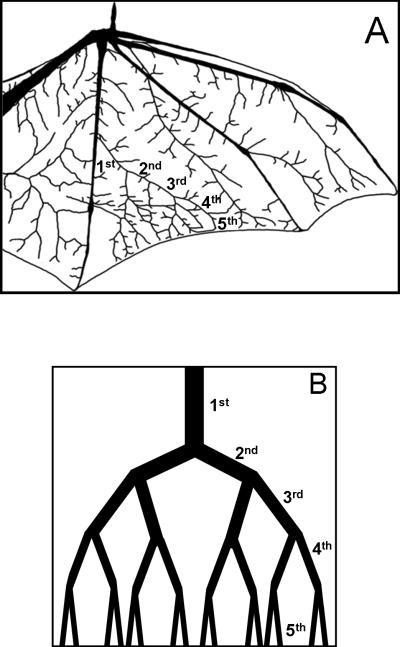
We located one set of branching arterioles with at least four visible generations of arterioles forming a large arcade (Figure 1A) on the medial portion of the wing membrane between the fourth and fifth phalanges. Arterioles for each bat were selected based on increasing branching order (1st-5th) resulting in vessels ranging from 60 μm – 15 μm that decreased ~10 μm in diameter with each bifurcation. Fifth order arterioles were found just proximal to capillaries similar to previous reports in the bat wing [6]. For each experiment, studies were performed on the most lateral arteriole of each major bifurcation. Data were collected from each branch of the network beginning with a 1st order arteriole and continuing to a 5th order, or metarteriole, in each bat (Figure 1A).
Figure 1.
A) The Pallid bat wing and the arterial bifurcations (1st-5th order) used in classifying the network architecture. B) A schematic representation of the thermoregulatory microvascular network (1st-5th order) used to calculate total arteriolar resistance and conductance.
After a vessel of interest was located, continuous diameter and velocity data were collected. Wing temperature was recorded at the end of every minute using a laser thermometer (Raytek Raynger ST Pro, 2003). A baseline period of at least 10 minutes was established at the heat plate temperature of 25.0°C. The heat plate temperature was then increased to 37.0°C. The increase in temperature was complete within 1 min, and recording of diameter and velocity began once the plate sensor read 37.0°C. This temperature was chosen after pilot studies revealed this was the highest plate temperature tolerated without causing the bats to move [39] or suspected to cause a vascular response regulated by pain receptors [17]. Data were recorded for 20 minutes at the elevated local temperature.
Baseline values established during the 10 minute period at 25.0 °C prior to heating were used as baseline for all subsequent measurements. Blood flow was calculated as the product of cross-sectional area and mean red cell velocity. To streamline analysis, we averaged the final 10 seconds of each data set for each minute. Data were then pooled for each minute throughout the experiment, and then averaged across the entire group of bats for that particular minute in the protocol. The first phase of the biphasic response was defined as min 1-4, and the second phase was considered anything beyond min 10.
The thickness of the smooth muscle layer was measured on the side of the artery contralateral to the paired venule. Our in vivo preparation allows for distinction between the inner vessel wall, medial layer, and the surrounding adventitia. To allow for greater contrast in detecting these differences, 2% weight by volume Evan's Blue dye in isopropyl alcohol was applied to the top of the wing membrane. After 30 min, the excess dye was removed with deionized water, and the wing was placed under the intravital microscope at 25.0 °C. The arteriolar smooth muscle thickness on the opposing side from the adjacent venule was measured in three distinct areas of each bifurcating segment. Although application of Evans Blue and isopropyl alcohol did not alter diameters from baseline values, all vessel orders were similarly treated to minimize possible bias. Measurements were made with custom image analysis software [24]. Each measurement was recorded three times to create a total of nine measurements per vessel segment per bat. Smooth muscle thickness to diameter ratios were established for each vessel, and averaged across the entire set of data for that vessel segment.
Resistance of each vessel was calculated from the measured radii and lengths of 1st-5th order vessels (Figure 1A) using Poiseuille's Law, as is described in detail elsewhere [29]. Briefly, Poiseuille's Law was formulated in terms of resistance, the pressure drop divided by the flow through a vessel. Vessel lengths from the whole-wing scans of three bats were measured using custom image analysis software [24].
To estimate total conductance of the entire microvascular network, a more involved mathematical model is necessary (Figure 1B). Based on a simple branching pattern [32], the network was assumed to be symmetrical (with equal sized daughter vessels). Total resistance was calculated from the parallel and series combinations of 1st-5th order vessel radii and lengths as is commonly practiced [22,29,31,32] (i.e., series resistances were added, and parallel resistances were halved). We excluded arteriovenous anastamoses from this model, since they have been previously thought to be below the level of the 5th order vessels, and have not been observed in the Pallid Bat [11]. Furthermore, adding arcuate arterioles to this model would not change the results, since they would connect vessels at same pressure, and thus there would be no flow through them [32]. The relative contribution of each vessel order to total network resistance was calculated and plotted. Total vascular conductance was calculated as the inverse of total vascular resistance. Percent increases in total vascular conductance from baseline values were then compared to the percent increases in total flow into the arteriolar network (i.e., 1st order blood flow) at minutes 1, 5, and 15 of local heat. To determine if 5th order vessels are necessary for the network to have a biphasic conductance, total conductance of a vascular network consisting of vessel orders 1-4 (i.e., without contribution from the 5th order) was calculated and plotted. To determine if 5th order vessels are sufficient for the network to have a biphasic conductance, the conductance of the 5th order vessels alone were calculated and plotted.
Data are presented as mean values ± standard error of the mean, and also normalized to percent increases from baseline ± standard error of the mean. Repeated measures ANOVA was then performed to determine statistical significance, and then followed by Fishers LSD post-hoc statistical examination when necessary. A p-value of less than 0.05 was considered significant.
RESULTS
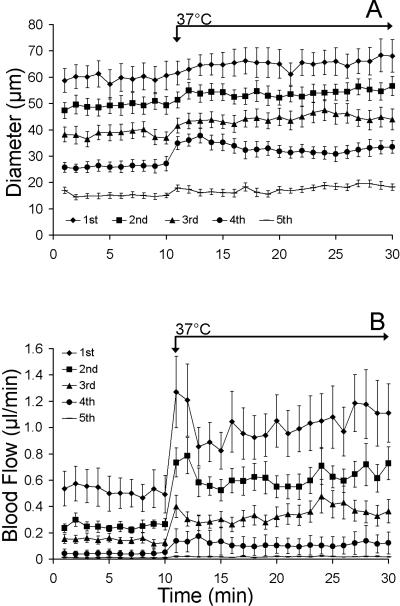
With local heat, arteriolar diameters and blood flows significantly increased from baseline throughout the network (Figures 2-3). Figure 2A illustrates how the diameters of vessel orders 1-5 change with the application of local heat. Each point represents an average diameter for 10 bats measured at a particular vessel order at a particular minute. Fourth order arterioles dilated with the greatest magnitude (44.4 +16.1%, Figure 2A), but did not exhibit a biphasic dilatory response. Figure 2B illustrates how calculated blood flows change with the application of local heat. The flow into the first order arteriole peaked within a minute of heating, encountered a brief nadir, and then returned to near peak values.
Figure 2.
A) Diameter increases with local heat across the vascular network (1st-5th order vessels, n=10 each group) presented as mean diameters ± SEM. B) Flow increases in a biphasic manner across the vascular network with local heat, presented as mean flow per min (diameters ± SEM, n=10 for each group). The first three orders of vessels display a biphasic flow response (BFR).
Figure 3.
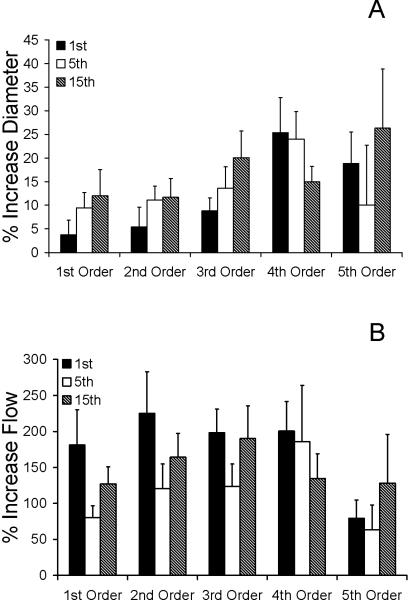
Percent increases of diameter and flow after 1st, 5th, and 15th min of applied local heat. Percent increases in both flow and diameter during min 1, 5, and 15 were significantly elevated from baseline (p<0.05). A) Only 5th order vessels displayed a trend (p=0.08) toward a biphasic vasodilatory response with min 1 and 15 being significantly higher than min 5. B) With the exception of the 4th order, all vessel orders displayed a trend toward a biphasic flow response (BFR) to local heat, though not statistically detectable by repeated-measures ANOVA.
Figure 3 clarifies these trends by presenting the same results, but only for minutes 1, 5, and 15. In particular, Figure 3A illustrates the diameters of arteriole orders 1-5, expressed as a percent increase from baseline values. Although the fifth order vessels exhibit a biphasic dilatory response, it was not statistically significant. Figure 3B illustrates the calculated flows through arteriole orders 1-5, expressed as a percent increase from baseline values. All but the fourth order vessel exhibited trend toward a biphasic flow response. The percent changes in both diameter (Figure 3A) and flow (Figure 3B) were not statistically significant among minute 1, 5, and 15 in any vessel order.
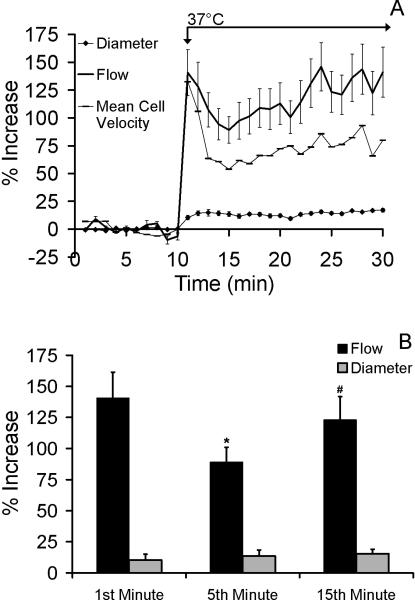
To capture the global changes in flow and diameters throughout the network, the responses in vessel orders 1-5 illustrated in Figures 2 and 3 are averaged across the entire network. Figure 4A illustrates the mean percent increase in diameter, flow and velocity at each minute averaged over all five vessel orders. Figure 4B illustrates the same data, but only for minutes 1, 5, and 15. The net increases in flow in all vessels across the network after the application of heat were significantly higher in min 1 and min 15 of heating compared to minute 5 (p=0.003, and p<0.001; Figure 4B).
Figure 4.
A) Mean network flow (solid line) and average network mean red cell velocity (connected dashes) (± SEM) increase across the microvascular network (n=10 per vessel group) in a biphasic manner with the application of local heat. Data are presented as mean percent increases from baseline (± SEM). Network flow, velocity, and diameter were significantly elevated with local heat. B) Mean percent increases in flow (black) and diameter (grey) (± SEM) for the entire network (n=10 per vessel group). Increases in flow were significantly elevated (p=0.03) compared to baseline, yet significantly reduced during the 5th minute (p=0.05) compared to the 1st minute (*), and preceding the 15th minute (#).
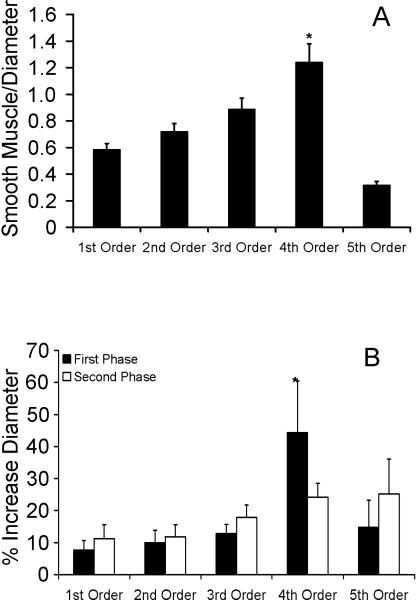
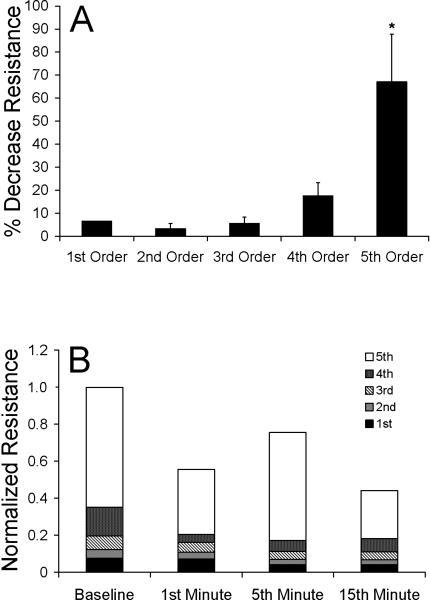
Smooth muscle to lumen diameter ratios increased from the 1st through 4th order vessels (Figure 5A). This measure was significantly lower in the 5th order vessels when compared to the remaining vessel groups (p<0.001). Fourth order vessels displayed a significantly higher smooth muscle to lumen ratio (1.24 ± 0.14, p<0.0001) than the larger three vessel segments (Figure 5A). Fourth order vessels also display the largest initial percent increase in diameter (Figure 5B). Lengths of 1st-5th order vessels were 35.7+7.4 μm, 29.2+2.2 μm, 33.7±1.9 μm, 25.4±0.2 μm, and 27.9±2.7 μm, respectively. Fifth order arterioles exhibited the greatest percent decrease in resistance from baseline after 20 min of local heat (Figure 6A). Statistically significant changes in resistance among min 1, 5, and 15 were not detected in any vessel order—including 5th order. Although changes in resistance for 5th order vessels were not statistically different between min 1, 5, and 15, they showed the strongest trend toward a biphasic response (ANOVA, p=0.088).
Figure 5.
A) Smooth muscle to lumen diameter ratios throughout the microvascular network of the bat wing presented as mean ratios (± SEM). These ratios are significantly (p<0.00001) larger in 4th order vessels (*) when compared to the other vessel groups (n=10 per vessel group). B) Mean percent increases from baseline in diameter (± SEM) during the first phase (black) and during the second phase (white) of the biphasic response (n=10 per vessel group). Fourth order vessels increased significantly more than others in the network (*, p=0.027).
Figure 6.
A) Mean percent decrease from baseline of total resistance (± SEM) for 1st-5th order vessels (n=10 per vessel group) after application of local heat for 20 min. Resistance normalized to the percent change in total resistance. Fifth order vessels exhibited the greatest decrease in resistance after 20 min of heating (*, p<0.00001), providing evidence that they substantially affect flow in the microcirculation with the application of local heat. B) Relative contributions of vessel orders 1-5 on total resistance of the network during 1st, 5th, and 15th minute of local heat. Total resistance normalized by baseline total resistance. Fifth order vessels play the largest role in altering total network resistance throughout local heating.
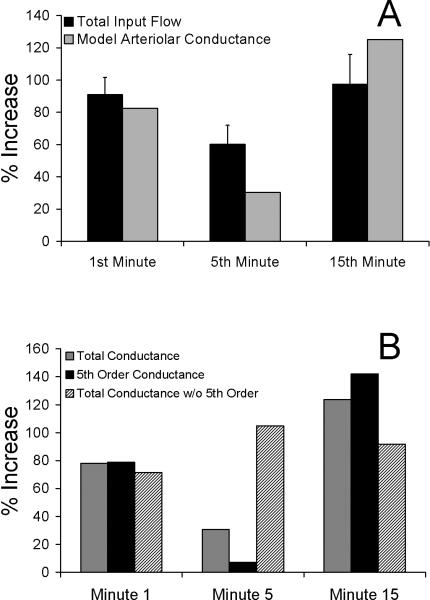
Estimated total arterial conductance in the network (gray bars, Figure 7A) indicated a biphasic response similar to the increase in total flow into the network (black bars, Figure 7A). Calculated conductance of 5th order vessels closely resembled total arteriolar conductance, exhibiting a biphasic response (black bars, Figure 7B). Theoretically removing the 5th order vessels from the network (i.e., calculating network conductance of 1st-4th order vessels) abolished the biphasic conductance response (hatched bars, Figure 7B). In fact, removing the 5th order vessels from the network caused conductance to be highest in minute 5, in direct opposition to the decrease in flow in minute 5, a fundamental characteristic of the BFR.
Figure 7.
A) Percent increase from baseline in total input flow (black) (± SEM) compared to model-derived percent increase from baseline in total arteriolar conductance (gray), calculated from the model depicted in Figure 1B. Total arteriolar conductance, estimated from measured 1st-5th order arteriolar radii (Figure 2A), exhibits a biphasic response like the biphasic flow response (BFR). B) Calculated conductance of only the 5th order vessels (black) exhibits a similar biphasic response as the total network conductance (grey). Calculated total network conductance of vessel orders 1-4 (i.e., total conductance with 5th order vessels removed) do not show a biphasic response. Fifth order changes in conductance are thus both necessary and sufficient for the biphasic flow response to local heat.
CONCLUSIONS
Utilizing the previously established bat wing preparation and a simple mathematical model, we conclude that the biphasic flow response (BFR) to local heat originates in the 5th order arterioles (i.e., 15 μm diameter metarterioles). Knowledge of individual vessel diameter and resistance changes was necessary, but not sufficient to identify the origin of the BFR. Analysis of measured changes in radii revealed that metarterioles display a trend toward a biphasic conductance response that is close to statistical significance (p=0.08). To positively identify the fifth order arterioles as the origin of the BFR, it was necessary to employ a mathematical model.
Use of mathematical modeling to positively identify the origin of the biphasic flow response
By relating measured changes in radii of 1st-5th order arterioles to temporal changes in total vascular conductance, the simple mathematical model (Figure 1B) yielded four critical pieces of information. First, the 5th order arterioles are responsible for the vast majority of the total network resistance to blood flow (Figure 6). Second, the temporal variation of conductance of the 5th order arterioles mimicked the BFR, with the lowest conductance at minute 5. Third, the total network conductance calculated only from vessel orders 1-4 (i.e., removing 5th order vessels) was highest at minute 5 (Figure 7B), indicating that they cannot be responsible for the characteristic nadir in flow at minute 5. Fourth, the percent change in total vascular conductance (gray bars, Figure 7) was biphasic, quantitatively predicting the percent change in measured flow (black bars, Figure 7). While seldom used in skin blood flow studies, mathematical modeling revealed that metarterioles are both necessary and sufficient to cause the biphasic response to local heat.
The Pallid bat as a model to study thermoregulation
Although the structure of the Pallid bat wing microcirculation is remarkably similar to other mammalian microcirculatory beds commonly studied [3,6,42], its thermoregulatory function and ease of experimental visualization make it uniquely advantageous. While existing in vivo microcirculatory preparations such as hamster cheek pouch and rat mesentery microcirculatory beds are sensitive to changes in temperature [4,23], the bat wing is crucial to thermoregulation [3,18,33]. Our animal model grants the capability to measure increases in diameter and blood flow throughout an intact vascular network with the application of local heat. It can bridge the gap between single vessel, in situ microvascular preparations (lacking global measurements of perfusion) and whole-body preparations (lacking individual radius and flow measurements). This particular study was made possible because the bat wing model allows network structure (i.e. multiple vessel radii) to be related to hemodynamic function (global perfusion).
Identifying the vessels responsible for the blood flow response
We have four pieces of evidence that support the assertion that our study included the vessels responsible for the BFR. 1) 4th order vessels increase radius with the greatest magnitude compared to the rest of the network (Figures 2A & 5B). 2) 4th order vessels exhibit the greatest smooth muscle to lumen ratio (Figure 5A). 3) The 5th order vessels exhibit the greatest change in resistance, which is statistically significant after 20 minutes, (Figure 6A). 4) The 5th order vessels are responsible for most of the change in total arteriolar network resistance (Figure 6B). Because 4th order vessels dilate more with heat, and the smooth muscle to lumen ratio is the greatest (Figure 5), this may lead to the mistaken belief that they dominate the hemodynamic response. Only with careful consideration of hemodynamics (i.e., resistance) is it revealed that 5th order arterioles have a considerable role in the local response to heat (Figure 6), suggesting that information gained from histology and in vitro functional studies is limited.
Alternative explanation for the biphasic response
Although the arterioles in a network are capable of generating a BFR, venules may play a role in the response to local heat. Since human skin blood flow investigators use an arbitrary placement of the Laser Doppler probe when studying the biphasic response to local heat, it is possible that the measurements are dominated by venular behavior. Because there is a greater volume of blood in the veins than arteries [35,36], the ensemble average signal might be expected to be weighted by veins. Additionally, changes in venous parameters have not been discounted as a mechanism for altering capillary hemodynamics [34].
Experimental limitations
While not a limitation of the animal model, we chose to use resting diameter and flow values as a baseline. Because tone is varied in different sized vessels, the best way to compare vessel responses to local heat is a percent change in diameter from resting tone at 25° C. This choice of baseline is different from that used for isolated vessel experiments or in situ preparations influenced by trauma and anesthesia. Typically, these studies rely on maximal dilation as a point of comparison. Although we did not determine maximum diameter of the vessels, from the variation in minute-to-minute diameter, we can infer that the maximum capacity of the vessels to dilate had not been reached. The ability to obtain consistent hemodynamic parameters in an intact, in vivo, microcirculatory preparation is a notable strength of the Pallid bat wing model.
Summary
The present work used a novel animal model and a simple mathematical model formulated from empirical data to elucidate the origin of the biphasic flow response (BFR) with the application of local heat. The BFR in skin tends to have a characteristic decrease in flow in minute 5 after the onset of heating [5, 29]. In our bat wing experiments, arteriolar orders 1-4 do not show a corresponding biphasic vasodilatory response. In fact, arteriolar orders 1-3 have an initial resistance that is too low to sufficiently impact flow in the network. Although the 4th arteriolar order is responsible for nearly 20% of resistance in the network at baseline, its resistance exhibits a minimum at minute 5, thus tending to oppose the characteristic decrease in flow at minute 5. The 5th order arterioles, however, provide the greatest resistance to flow in the network and exhibit a dilatory response that is sufficient to cause a biphasic flow response. When incorporated into a mathematical model, our empirical results revealed that the 5th order arterioles, or metarterioles, are not only sufficient, but necessary to cause a biphasic flow response.
Acknowledgements
Portions of this work were supported by grants NIH-K25HL070608, AHA-0565116Y and Centers for Disease Control CDC-623086. We would like to thank Dr. Cristine Heaps, Dr. Randolph Stewart, and Joshua Meisner for their insightful comments.
Funding Sources: NIH-K25HL070608, AHA-0365127Y and CDC-623086
References
- 1.Almen T. Effects on venous vasomotion from ionic content of contrast agent solutions - investigation on microcirculation in bat wing. Acta Radiol Diagn. 1976;17:439–448. doi: 10.1177/028418517601700408. [DOI] [PubMed] [Google Scholar]
- 2.Bohlen H, Hankins K. Early microvascular pathology during hyperglycemia in bats. Blood Vessels. 1983;20:213–220. doi: 10.1159/000158474. [DOI] [PubMed] [Google Scholar]
- 3.Bouskela E. Vasomotion frequency and amplitude related to intraluminal pressure and temperature in the wing of the intact, unanesthetized bat. Microvasc Res. 1989;37:339–351. doi: 10.1016/0026-2862(89)90051-4. [DOI] [PubMed] [Google Scholar]
- 4.Bouskela E, Grampp W. Spontaneous vasomotion in hamster cheek pouch arterioles in varying experimental conditions. Am J Physiol Heart Circ Physiol. 1992;262:H478–485. doi: 10.1152/ajpheart.1992.262.2.H478. [DOI] [PubMed] [Google Scholar]
- 5.Charkoudian N. Skin blood flow in adult human thermoregulation: How it works, when it does not, and why. Mayo Clin Proc. 2003;78:603–612. doi: 10.4065/78.5.603. [DOI] [PubMed] [Google Scholar]
- 6.Davis M. Control of bat wing capillary pressure and blood flow during reduced perfusion pressure. Am J Physiol Heart Circ Physiol. 1988;255:H1114–1129. doi: 10.1152/ajpheart.1988.255.5.H1114. [DOI] [PubMed] [Google Scholar]
- 7.Davis M. Microvascular control of capillary pressure during increases in local arterial and venous pressure. Am J Physiol Heart Circ Physiol. 1988;254:H772–784. doi: 10.1152/ajpheart.1988.254.4.H772. [DOI] [PubMed] [Google Scholar]
- 8.Davis M. Spontaneous contractions of isolated bat wing venules are inhibited by luminal flow. Am J Physiol Heart Circ Physiol. 1993;264:H1174–1186. doi: 10.1152/ajpheart.1993.264.4.H1174. [DOI] [PubMed] [Google Scholar]
- 9.Davis M, Sikes P. A rate-sensitive component to the myogenic response is absent from bat wing arterioles. Am J Physiol Heart Circ Physiol. 1989;256:H32–40. doi: 10.1152/ajpheart.1989.256.1.H32. [DOI] [PubMed] [Google Scholar]
- 10.Davis MJ. Determination of volumetric flow in capillary tubes using an optical doppler velocimeter. Microvasc Res. 1987;34:223. doi: 10.1016/0026-2862(87)90055-0. [DOI] [PubMed] [Google Scholar]
- 11.Davis MJ. Microvascular control of capillary pressure during increases in local arterial and venous pressure. Am J Physiol Heart Circ Physiol. 1988;254:H772–784. doi: 10.1152/ajpheart.1988.254.4.H772. [DOI] [PubMed] [Google Scholar]
- 12.Fleming B, McKinney M. Adrenergic innervation in the microcirculation of the bat wing. Microvasc Res. 1985;29:387–400. doi: 10.1016/0026-2862(85)90027-5. [DOI] [PubMed] [Google Scholar]
- 13.Frame MD. Increased flow precedes remote arteriolar dilations for some microapplied agonists. Am J Physiol Heart Circ Physiol. 2000;278:H1186–1195. doi: 10.1152/ajpheart.2000.278.4.H1186. [DOI] [PubMed] [Google Scholar]
- 14.Golay S, Haeberli C, Delachaux A, Liaudet L, Kucera P, Waeber B, Feihl F. Local heating of human skin causes hyperemia without mediation by muscarinic cholinergic receptors or prostanoids. J Appl Physiol. 2004;97:1781–1786. doi: 10.1152/japplphysiol.00814.2003. [DOI] [PubMed] [Google Scholar]
- 15.Jacobsen JCB, Gustafsson F, Holstein-Rathlou N-H. A model of physical factors in the structural adaptation of microvascular networks in normotension and hypertension. Physiological Measurement. 2003:891. doi: 10.1088/0967-3334/24/4/007. [DOI] [PubMed] [Google Scholar]
- 16.Kellogg D, Jr., Liu Y, Kosiba I, O'Donnell D. Role of nitric oxide in the vascular effects of local warming of the skin in humans. J Appl Physiol. 1999;86:1185–1190. doi: 10.1152/jappl.1999.86.4.1185. [DOI] [PubMed] [Google Scholar]
- 17.Kellogg DL, Jr., Liu Y, McAllister K, Friel C, Pergola PE. Bradykinin does not mediate cutaneous active vasodilation during heat stress in humans. J Appl Physiol. 2002;93:1215–1221. doi: 10.1152/japplphysiol.01142.2001. [DOI] [PubMed] [Google Scholar]
- 18.Kluger M, Heath J. Vasomotion in bat wing: A thermoregulatory response to internal heating. Comp Biochem and Physiol. 1970;32:219–226. doi: 10.1016/0010-406x(70)90935-7. [DOI] [PubMed] [Google Scholar]
- 19.Kostromina EY, Rodionov IM, Shinkarenko VS. Tone, autoregulatory properties, and wall thickness-to-radius ratio in skeletal muscle arterioles. Am J Physiol Heart Circ Physiol. 1991;261:H1095–1101. doi: 10.1152/ajpheart.1991.261.4.H1095. [DOI] [PubMed] [Google Scholar]
- 20.Kubli S WB, Dalle-Ave A, Feihl F. Reproducibility of laser doppler imaging of skin blood flow as a tool to assess endothelial function. J Cardiovasc Pharmacol. 2000;36:640–648. doi: 10.1097/00005344-200011000-00014. [DOI] [PubMed] [Google Scholar]
- 21.Kuo L, Davis MJ, Chilian WM. Endothelial modulation of arteriolar tone. News Physiol Sci. 1992;7:5–9. [Google Scholar]
- 22.Levy M, Koeppen B, Stanton B. Berne & levy principles of physiology. ed 4 Mosby; St. Louis, MO: 2005. [Google Scholar]
- 23.Massett MP, Lewis SJ, Bates JN, Kregel KC. Effect of heating on vascular reactivity in rat mesenteric arteries. J Appl Physiol. 1998;85:701–708. doi: 10.1152/jappl.1998.85.2.701. [DOI] [PubMed] [Google Scholar]
- 24.Meisner JK, Yazdani-Beioky S, Weaver A, Quick CM. Real-time in vivo microvascular diameter tracking system. 22nd Annual Houston Conference in Biomedical Research. 2005;22:64. [Google Scholar]
- 25.Miller FN, Harris PD. Sensitivity of subcutaneous small arteries and veins to norepinephrine, and epinephrine, and isoproterenol in the unanesthetized bat. Microvasc Res. 1975;10:340–351. doi: 10.1016/0026-2862(75)90037-0. [DOI] [PubMed] [Google Scholar]
- 26.Minson CT, Berry LT, Joyner MJ. Nitric oxide and neurally mediated regulation of skin blood flow during local heating. J Appl Physiol. 2001;91:1619–1626. doi: 10.1152/jappl.2001.91.4.1619. [DOI] [PubMed] [Google Scholar]
- 27.Minson CT, Wong BJ. Reactive hyperemia as a test of endothelial or microvascular function? J Am Coll Cardiol. 2004;43:2147. doi: 10.1016/j.jacc.2004.03.005. [DOI] [PubMed] [Google Scholar]
- 28.Neuweiler G. The biology of bats. Oxford University Press; New York: 2000. [Google Scholar]
- 29.Nichols WW, O'Rourke MF. Mcdonald's blood flow in arteries: Theoretical, experimental and clinical principles. ed 5 A Hodder Arnold Publication; New York, NY: 2005. [Google Scholar]
- 30.Pries AR, Reglin B, Secomb TW. Remodeling of blood vessels: Responses of diameter and wall thickness to hemodynamic and metabolic stimuli. Hypertension. 2005;46:725–731. doi: 10.1161/01.HYP.0000184428.16429.be. [DOI] [PubMed] [Google Scholar]
- 31.Pries AR, Secomb TW, Gaehtgens P. Structural autoregulation of terminal vascular beds: Vascular adaptation and development of hypertension. Hypertension. 1999;33:153–161. doi: 10.1161/01.hyp.33.1.153. [DOI] [PubMed] [Google Scholar]
- 32.Quick CM, Young WL, Leonard EF, Joshi S, Gao E, Hashimoto T. Model of structural and functional adaptation of small conductance vessels to arterial hypotension. Am J Physiol Heart Circ Physiol. 2000;279:H1645–1653. doi: 10.1152/ajpheart.2000.279.4.H1645. [DOI] [PubMed] [Google Scholar]
- 33.Reaves TA, Hartner WC, Heath JE. Interstitial fluid pressure and vasomotor responses in bats. Am J Physiol. 1974;226:353–356. doi: 10.1152/ajplegacy.1974.226.2.353. [DOI] [PubMed] [Google Scholar]
- 34.Segal SS. Regulation of blood flow in the microcirculation. Microcirculation. 2005;12:33–45. doi: 10.1080/10739680590895028. [DOI] [PubMed] [Google Scholar]
- 35.Stewart JM. Pooling in chronic orthostatic intolerance: Arterial vasoconstrictive but not venous compliance defects. Circulation. 2002;105:2274–2281. doi: 10.1161/01.cir.0000016348.55378.c4. [DOI] [PubMed] [Google Scholar]
- 36.Stewart JM. Microvascular filtration is increased in postural tachycardia syndrome. Circulation. 2003;107:2816–2822. doi: 10.1161/01.CIR.0000070951.93566.FC. [DOI] [PubMed] [Google Scholar]
- 37.Unthank J, Hogan R. The effect of vasoactive agents on the contractions of the initial lymphatics of the bat's wing. Blood Vessels. 1987;24:31–44. doi: 10.1159/000158669. [DOI] [PubMed] [Google Scholar]
- 38.Widmer RJ, Laurinec JE, Kuriachan VP, Stewart RH, Quick CM. Vasodilation of the bat wing microcirculation with local heat. Proc. Texas ACSM. 2005;26:46. [Google Scholar]
- 39.Widmer RJ, Laurinec JE, Young MF, Laine GA, Quick CM. Local heat produces a shear-mediated biphasic response in the thermoregulatory microcirculation of the pallid bat wing. Am J Physiol Regul Integr Comp Physiol. 2006;291:R625–R632. doi: 10.1152/ajpregu.00929.2005. [DOI] [PubMed] [Google Scholar]
- 40.Widmer RJ, Stewart RH, Young MF, Laurinec JE, Laine GA, Quick CM. Application of local heat induces capillary recruitment in the pallid bat wing. Am J Physiol Regul Integr Comp Physiol. 2007:00873.02006. doi: 10.1152/ajpregu.00873.2006. [DOI] [PubMed] [Google Scholar]
- 41.Wiedeman MP. Effect of denervation on diameter and reactivity of arteries in the bat wing. Circ Res. 1955;3:618–622. doi: 10.1161/01.res.3.6.618. [DOI] [PubMed] [Google Scholar]
- 42.Wiederhielm C, Bouskela E, Heald R, Black L. A method for varying arterial and venous pressures in intact, unanesthetized mammals. Microvasc Res. 1979;18:124–128. doi: 10.1016/0026-2862(79)90022-0. [DOI] [PubMed] [Google Scholar]


