Abstract
In modern bony fishes, or teleost fish, the general lack of leucocyte markers has greatly hampered investigations of the anatomy of the immune system and its reactions involved in inflammatory responses. We have previously reported the cloning and sequencing of the salmon CD3 complex, molecules that are specifically expressed in T cells. Here, we generate and validate sera recognizing a peptide sequence of the CD3ε chain. Flow cytometry analysis revealed high numbers of CD3ε+ or T cells in the thymus, gill and intestine, whereas lower numbers were detected in the head kidney, spleen and peripheral blood leucocytes. Subsequent morphological analysis showed accumulations of T cells in the thymus and spleen and in the newly discovered gill-located interbranchial lymphoid tissue. In the latter, the T cells are embedded in a meshwork of epithelial cells and in the spleen, they cluster in the white pulp surrounding ellipsoids. The anatomical organization of the salmonid thymic cortex and medulla seems to be composed of three layers consisting of a sub-epithelial medulla-like zone, an intermediate cortex-like zone and finally another cortex-like basal zone. Our study in the salmonid thymus reports a previously non-described tissue organization. In the intestinal tract, abundant T cells were found embedded in the epithelium. In non-lymphoid organs, the presence of T cells was limited. The results show that the interbranchial lymphoid tissue is quantitatively a very important site of T cell aggregation, strategically located to facilitate antigen encounter. The interbranchial lymphoid tissue has no resemblance to previously described lymphoid tissues.
Keywords: Atlantic salmon, interbranchial lymphoid tissue, intraepithelial leucocytes, lymphoid organ, mucosa-associated lymphoid tissues, T cell, teleost, thymus
Introduction
Modern bony fishes (teleosts) represent one of the first groups in the tree of evolution to harbour the molecules belonging to the classical adaptive immune system comprising the T cell receptor (TcR), major histocompatibility complex (MHC) molecules and immunoglobulin (Ig) receptors (Cooper & Alder, 2006; Boehm & Bleul, 2007). Teleosts have two primary lymphoid organs; the thymus and a suggested bone marrow analogue located in the head-kidney, which may also serve as a secondary lymphoid organ together with the spleen. Germinal centres, B cell follicles, lymph nodes and complex mucosa-associated lymphoid tissues (MALTs) as in mammals have not been reported in fish. However, a primitive gut-associated lymphoid tissue (GALT) represented by diffuse sub-epithelial lymphoid aggregates can be found (Zapata & Amemiya, 2000). Both lymphatic vessels and a primitive secondary vascular system of unknown significance have been described, their relation remains uncertain (Olson, 1996; Yaniv et al. 2006; Vogel, 2010). As in mammals, the T cells in jawed fish appear to express either α/β or γ/δ receptor types (Nam et al. 2003). These T cell receptors also occur in a complex with CD3 molecules, comprising ζ chains, now designated CD247 in mammals, and CD3ε and CD3γδ chains, the latter of which is a forerunner of CD3γ and CD3δ in mammals (Liu et al. 2008). Three classes of antibodies appear to be present in most teleosts, comprising IgM, IgD and IgT/IgZ (Danilova et al. 2005; Hansen et al. 2005; Deza et al. 2010). Whereas IgM monomers have remained evolutionarily stable, IgD and IgT show a series of distinct structures in different species (Wilson et al. 1997; Hordvik et al. 1999; Stenvik & Jørgensen, 2000; Saha et al. 2004; Savan et al. 2005a,b; Deza et al. 2010). The exploration of IgD and IgT functions has recently been initiated (Chen et al. 2009; Sunyer et al. 2009; Zhang et al. 2010).
It has been suggested that the driving force in the evolution of organized lymphoid structures in pre-historic fishes was linked to the primary route of pathogen entry into the organisms, a process which in general occurs through mucosal surfaces (Matsunaga & Rahman, 2001; Boehm & Bleul, 2007). As teleosts are ectothermic vertebrates living in an aquatic environment, it is plausible that investigations of their mucosa-associated immune structures may shed light on major steps in the early evolution of the classical adaptive immune system. Jawless fish (cyclostomata) have lymphocyte-like cells, but convergent evolution has resulted in a remarkably different adaptive immune system with no thymic tissue in these animals (Alder et al. 2008). It has been suggested that lymphoid organs evolved to facilitate antigen-receptor gene assembly (variable-diversity-joining-type recombination), which first occurs in jawed fishes, and in the evolutionary context, thymus first appears in cartilaginous fishes, which are also the first to possess distinguishable T and B cells (Boehm & Bleul, 2007).
Surprisingly, large lymphoid structures in the salmon gill epithelium remained un-described until recently, suggesting that the presumed absence of distinct MALTs in teleosts must be reconsidered. In our initial report on this novel structure, RT-PCR data indicated the presence of T cells (Haugarvoll et al. 2008). But as previously discussed (Liu et al. 2008), we have hitherto failed to identify a convincing T cell marker available for salmonid tissues, hence, any visualization of putative T cells was impossible. The distribution of T cells in the zebrafish (Danio rerio) has been addressed by transgenic methods and by using injection of fluorescence-marked T cells in recipient fish (Langenau & Zon, 2005). The thymus has been shown to be the major source of T cell production in teleost fish. As in mammals, thymic tissue develops from pharyngeal pouches. In teleosts, the number of such pouches varies, but apart from this, the similarities to the organogenesis in mammals are striking (Zapata & Amemiya, 2000; Langenau & Zon, 2005; Rodewald, 2008). The teleost thymus anlage does not migrate ventrally to fuse in a single organ, but form two separate organs located dorsally, beneath the operculum and covered by a mucosal epithelium (Zapata & Amemiya, 2000; Matsunaga & Rahman, 2001; Bowden et al. 2005; Langenau & Zon, 2005).
Here, we generate and validate antisera recognizing the CD3ε chain in salmonids. Subsequently, we use this marker to address the normal distribution of T cells in salmonids, demonstrating accumulations in the thymus, spleen and in the recently discovered lymphoid structures in the gill epithelium.
Materials and methods
Animals and tissues
In this study, salmonids of different sizes were investigated. Due to the possible induction of systemic autoimmunity caused by commercial vaccination (Koppang et al. 2008), all fish were non-vaccinated. As non-vaccinated sexually matured salmon are hard to obtain from fish farms, wild salmon were used. In detail, naïve rainbow trout at the FLI, Insel Riems, Germany, kept in fresh water and weighing approximately 100 g were used for withdrawing blood and organ sampling for flow cytometry and for cryo-sections of gills, thymus, head-kidney and spleen. For Western blotting, flow cytometry and histology of gills and thymi, five unvaccinated, farmed Atlantic salmon from Solbergstrand Research Station, Drøbak (saltwater transferred, mean weight 500 g) were used. Gill, thymus, head-kidney, mid-kidney, spleen, heart, liver, eye, brain, skin, and anterior and posterior gut segments (Fuglem et al. 2010) from five individuals were sampled from Ewos Research Station, Lønningdal, Os (saltwater transferred, mean weight 2.63 kg). The same organs were also sampled from 10 wild Atlantic salmon caught by dip-net in the river Drammenselva, Buskerud (river-migrated sexually mature individuals, 7–14 kg). In addition, samples from thymus and gill were also frozen for cryo-sections from these fish.
Sampling protocol
All animals were euthanized according to regulations for fish in aquaculture issued by the Norwegian Directorate of Fisheries (Forskrift om drift av akvakulturanlegg. § 28. Avlivning av fisk) and to the regulations stated in the German Animal Welfare Act, respectively. No mortality had been recorded in the investigated groups or in the river Drammen. All gill arches (1–4) were dissected from the left side of the fish, and samples from their dorsal-, mid- and ventral portions were collected (Fig. 1A,B). Material from gills and other organs as specified above were either snap-frozen in liquid nitrogen or fixed in 10% buffered formalin. Peripheral blood was collected from the caudal vein in heparinized vacutainers for further investigations using flow cytometry, and organs for Western blotting were snap-frozen at site.
Fig. 1.
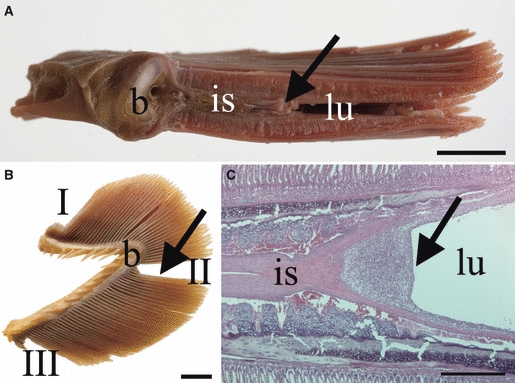
Macroscopical and histological location and appearance of the interbranchial lymphoid tissue (ILT), here in sexually mature salmon. (A) In a transversal section of a gill arch, the interbranchial septum (is) is proximally attached to the bone of the gill arch (b) and continues approximately 1/3 along the length of the primary gill lamella terminating in the ILT, which may be observed as a greyish structure (arrow) by the naked eye. The lumen of the branchial chamber (lu) is indicated. (B) Samples were collected from the dorsal (I), mid- (II) and ventral (III) portion of each gill arch; the location of the lymphoid aggregate in this projection is indicated (arrow), as is the location of the bone (b). (C) Histological image showing the terminal end of the interbranchial septum (is) and the ILT (arrow). HE. Scale bars: A,B = 1 cm, C = 500 μm.
Cloning of coding region of CD3ε
The coding region of CD3ε, excluding the signal sequence, but including the stop codon, was amplified using EcoRI and ApaI tailed primers; forward, GGAATTCGATGTGTCATTCTGGAG and reverse, GGGGCCCTCAGGTGTGGTCTGG-TGAGA. The resulting fragment was subcloned into pCR4 vector (TA cloning vector for sequencing; Invitrogen). A plasmid preparation (Nucleospin, Plasmid; Macherey & Nagel GmbH & Co.) of this construct was digested with EcoRI and ApaI and the insert purified from an agarose gel (QiaPrep gel extraction kit; Qiagen) before being ligated into pcDNASp FLAG vector (Viertlboeck et al. 2004). This vector contains the FLAG epitope downstream of the chicken MHC class I signal sequence such that expression in mammalian cells results in high expression on the surface with an N terminal FLAG epitope (Fig. 2).
Fig. 2.
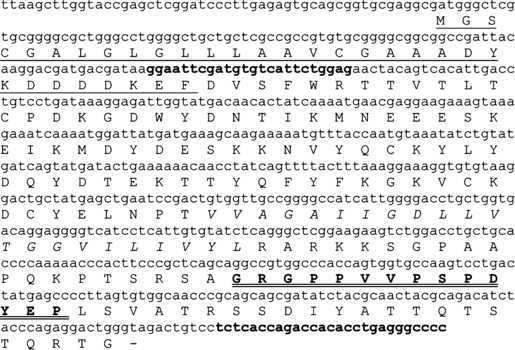
Atlantic salmon CD3/FLAG plasmid construct. Primers used for the construction of the plasmid are in bold. The signal peptide and FLAG epitope are underlined. The transmembrane peptide is indicated in italics, and the peptide used for production of CD3 rabbit antisera is shown in bold and double underlined. The polypeptide, including the signal peptide and FLAG epitope, is 188 amino acids long, has a theoretical molecular weight of 20.7 kD, and does not have acceptor groups for N-glycosylation. Searches in the databanks revealed two ESTs encoding salmonid CD3ε: EL558160.1, Oncorhynchus tshawytscha, and EV381695.1, Oncorhynchus nerka. Both of these sequences were identical to that of Atlantic salmon with respect to the peptide used for immunization of rabbits, indicating that the resulting anti-CD3ε-serum is useful for salmonid fish in general.
Production of antisera raised against salmon CD3ε peptide
A synthetically produced salmon CD3ε peptide (GRGPPVVPSPDYEP) (Liu et al. 2008) was used to immunize two rabbits according to the standard protocol of the producer. The resulting sera (Anti-CD3ε-1 and Anti-CD3ε-2) were subsequently affinity purified using the corresponding peptide (Davids Biotechnologie GmbH, Regensburg, Germany).
PAGE and analysis of transfected cells
Minipreps of positive clones were sequenced and transfected into COS 7 cells using nanofectin (PAA laboratories GmbH) according to the accompanying protocols. Cell culture medium was changed on day 1 and the cells harvested on day 3. The reactivity of the CD3ε-antiserum, vs. the pre-immuneserum, was demonstrated by immunofluorescence and Western blot analysis of cells transfected with the plasmid encoding salmon CD3ε.
For PAGE/WB, cells from 24-well plates were scraped into lysis buffer (50 μL per well) containing 100 mm NaCl, 50 mm Tris pH 7.5, 1% Triton-X 100 and supplemented with proteinase inhibitor (miniComplete®; Roche). Protein lysate 20 μL per lane was separated on 12% reducing PAGE gels and blotted onto 0.2-μm nitrocellulose membranes using standard techniques and buffers. A pre-stained standard was used (Precision plus dual colour; Bio-Rad) to monitor blotting and to estimate the molecular weight of resulting bands. Blots were blocked for 30 min using 5% dried milk in phosphate-buffered saline (PBS)/0.1% Tween 20. The CD3ε polyclonal antiserum and pre-immuneserum were diluted 1 : 300 in blocking buffer and incubated overnight at 4 °C. Horseradish peroxidase (HRP)-conjugated secondary antibody (Sigma) was diluted 1 : 3000 in washing buffer (PBS/0.1% Tween 20) and the bands visualized using an Enhanced chemiluminiscence kit (GE Healthcare).
Cells on coverslips for immunofluorescence were fixed in 4% paraformaldehyde and permeabilized with 0.1% Triton-X 100 for 20 min. All incubations were performed at room temperature (RT). Cells were blocked with 5% dried milk in PBS/0.1% Tween 20 for 30 min. Antisera and pre-immuneserum were diluted 1 : 300 in blocking buffer and incubated for 1 h. Secondary antibody, anti-rabbit Alexa fluor 488 (Molecular Probes, Invitrogen Ltd.) was diluted 1 : 500 in wash buffer (PBS/0.1% Tween 20) and incubated for 1 h. In the penultimate washing step, nuclei were counterstained with propidium iodide (PI) 0.25 μg mL−1 for 1 min before mounting in Slow-fade (Molecular Probes, Invitrogen Ltd). Images were recorded using a Zeiss Axioscope 2 Plus microscope.
Western blot analysis of different tissues
Materials from two unvaccinated sea-transferred salmon as specified above were investigated. Fresh tissue samples were snap-frozen in liquid nitrogen immediately after sampling and stored at −80 °C until use. Tissues were thawed on ice and homogenized with a glass homogenizer in ice-cold lysis buffer containing 50 mm Tris–HCl (pH 7.4), 150 mm NaCl, 0.5% (v/v) Triton X-100, 0.5% sodium deoxycholate and 1 mm ethylenediaminetetraacetic acid (EDTA), supplemented with proteinase inhibitor tablets (Complete®; Roche). Homogenates were left on ice for 1 h before centrifugation at 3000 × g for 10 min to remove tissue debris. Supernatants, except from liver and leucocytes, were supplemented with threefold volumes of methanol and left for 3 days at −20 °C. Precipitated proteins were collected by centrifugation at 15 000 × g for 20 min at 4 °C. Protein pellets were re-suspended in lysis buffer, and proteins were quantified with the Bradford assay according to the manufacturer's guidelines (Bio-Rad). Protein preparations were boiled for 5 min in SDS sample buffer (NuPAGE; Invitrogen) under reducing conditions. Approximately 150 μg of total protein was separated in each lane by electrophoresis on precast 4–20% gradient Bis-Tris polyacrylamide gels (XT-Criterion; Bio-Rad), with XT-MOPS (Bio-Rad) as the running buffer. The proteins were electro-blotted at 25 V for 1 h with Tris/CAPS transfer buffer as recommended by the supplier (Trans Blot Semi-Dry; Bio-Rad) onto polyvinylidene difluoride membranes (Hybond-P; Amersham Biosciences). To reduce unspecific binding of antibodies, membranes were blocked by incubation with 5% (w/v) fat-free dry milk (Bio-Rad) in Tris-buffered saline (TBS) for 1 h at RT. Incubations with purified antiserum (Anti-CD3ε-1 and Anti-CD3ε-2), diluted to 1 μg mL−1, were performed in TBS overnight at 4 °C and for 1 h at RT for secondary antibodies labelled with alkaline phosphatase. Visualization of bands was achieved using the ECF Western blot detection kit (Amersham Biosciences) by scanning for fluorescence at 540 nm with a variable mode imager (Typhoon 9200; Amersham Biosciences).
Flow cytometry including double-labelling experiments
For flow cytometry analysis, blood was collected from the caudal vein of rainbow trout and Atlantic salmon as specified above into heparinized syringes (Sigma-Aldrich) at 1000 U mL−1 in PBS. Blood was diluted in a fivefold volume of mixed cell culture medium (MM): IMDEM/Ham's F12 (Invitrogen) at a ratio of 1 : 1, supplemented with 10% fetal bovine serum (FBS). Rainbow trout thymus, pronephros, spleen, gill arches and the proximal intestine were aseptically excised, the intestine was opened and washed with MM. Single cell suspensions were prepared in MM using a Potter-Elvehjem homogenizer. Diluted blood and single cell suspensions from organs were loaded onto Percoll (Biochrome AG), density (1.075 g mL−1) gradients and centrifuged at 650 g, 4 °C for 40 min. Leucocytes were harvested from the interphase, washed twice and counted using a Thoma haemocytometer and trypan blue (Sigma-Aldrich) exclusion to determine possible dead cells. Rainbow trout peripheral blood leucocytes (PBLs) and organ leucocytes were fixed in 4% paraformaldehyde (Carl Roth), permeabilized by digitonin (0.01%) and immediately processed for further immunofluorescence staining. Fixed and permeabilized leucocytes were washed again with MM and stained with either the Anti-CD3ε-1 or the Anti-CD3ε-2 (1 : 200) for 40 min at 4 °C. Cells were washed and stained with Alexa Fluor 488 goat anti-rabbit IgG (Invitrogen) secondary antibody diluted 1 : 500 for another 40 min at 4 °C. For double-labelling experiments, fixed/permeabilized rainbow trout PBLs were simultaneously incubated with either the Anti-CD3ε-1 or the Anti-CD3ε-2 (1 : 200) and either a monoclonal antibody (mAb) against rainbow trout thrombocytes (mAb 42) or a mixture (1 : 1) of anti-rainbow trout IgM mAbs 4C10 and N2 (Thuvander et al. 1990; Fischer & Köllner, 1994; Köllner et al. 2004). After washing, cells were simultaneously stained with anti-rabbit-Alexa488 and anti-mouse-IgG-TriColor isotype specific conjugates (Invitrogen), respectively. Cells were washed again and analysed by flow cytometry using a MoFlo cell sorter (Beckman-Coulter). Data were processed applying summit 4.31 software (Beckman-Coulter).
Histological investigations
For cryosections and subsequent confocal laser scanning microscopy, frozen sections (20 μm) were prepared, mounted on glass slides, air-dried and fixed with acetone (5 min, 4 °C) and dried again. After circling the sections with a PAP-Pen (Kisker), slides were stained for 40 min at 4 °C in a humid chamber using the Anti-CD3ε-2 or the pre-immunesera, both diluted 1 : 200. The sections were subsequently washed and stained with Alexa Fluor 488 goat anti-rabbit IgG (Invitrogen) secondary antibody diluted 1 : 400 for another 40 min at 4 °C. For IgM staining, frozen sections were first labelled with the anti-IgM mAb 4C10 (1 : 100, DeLuca et al. 1983), washed and then stained with the secondary antibody AlexaTM 488 goat-anti-mouse-Ig conjugate (Molecular Probes). Control sections were stained with secondary antibody conjugates only. Slides were washed again, covered with mounting medium containing propidium iodide (PI; Sigma-Aldrich) for nucleic acid counterstaining and DABCO (Sigma-Aldrich) as an antibleaching compound. Slides were finally analysed using a confocal laser scanning microscope LSM 610 (Zeiss).
Formalin-fixed material was paraffin-embedded and cut according to standard procedures (Haugarvoll et al. 2008). Gill, thymus, head-kidney, mid-kidney, spleen, heart, liver, eye, brain, skin, anterior and posterior gut segments from Atlantic salmon (2.63 kg), were investigated. All tissues were treated with pre-immunesera and affinity-purified sera from the stimulated rabbits according to standard procedures, and visualized by an indirect immunoperoxidase method as described elsewhere (Haugarvoll et al. 2008). An initial experiment showed that a dilution of primary sera of 1 : 300 gave optimal results, and was subsequently used for analysis. Thymic and gill tissue were additionally stained for MHC class II reactivity as described previously (Koppang et al. 2003b).
Results
PAGE and analysis of transfected cells
The specificity of the anti-CD3ε sera was verified on cells transfected with a full-length CD3ε-FLAG construct. The antisera gave comparable results to the control FLAG antibody when both were used in indirect immunofluorescence on permeabilized cells transfected with the FLAG-CD3ε plasmid (Fig. 3), whereas the corresponding pre-immunesera gave no signal (results not shown).
Fig. 3.
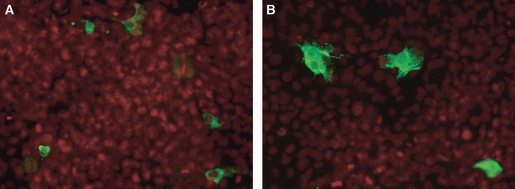
Immunofluorescence of COS-7 cells transfected with the CD3 FLAG expressing plasmid. Cells have been permeabilized and show a cytoplasmic green fluorescence, visualized with (A) anti-FLAG antibody followed by anti-mouse Alexa fluor 488 (positive control) and (B) anti-CD3ε serum and anti-rabbit Alexa fluor 488 secondary antibody. Propidium iodide (PI) counterstain in red.
Western blots of these transfected-cell lysates showed that the anti-CD3ε sera also worked well on denatured material (Fig. 4). Applied to lanes 2 and 3, it gave a clear band at 20 kD in lane 2 containing cell lysate transfected with the CD3ε plasmid, but not in lane 3 containing cell lysate transfected with an irrelevant plasmid. In contrast, the pre-immunesera applied to lane 1 (containing cell lysate transfected with the CD3ε plasmid) only showed a weaker band of higher molecular weight also present in the antibody lane.
Fig. 4.
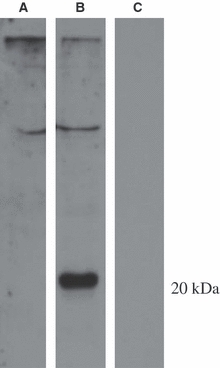
Western blot of lysates from cells transfected with FLAG plasmids showing specificity of anti-CD3ε-serum at the expected MW of 20 kD (arrow). Lanes 1 and 2: CD3ε-FLAG transfected cell lysate. Lane 3: cell lysate from transfected cells with an irrelevant FLAG construct. Lane 1: incubation with pre-immune serum. Lanes 2 and 3: incubation with anti-CD3ε-serum.
Western blot analysis of Atlantic salmon tissue
The results showed that anti-CD3ε sera reacted strongly with a protein of the expected molecular mass (19 kDa) in crude preparations of thymus and gill (Fig. 5). Reactivity was also detected with leucocytes and faintly with spleen, whereas head-kidney preparations appeared negative or below the detection limit. Immunoblots without primary antibodies were negative (data not shown).
Fig. 5.
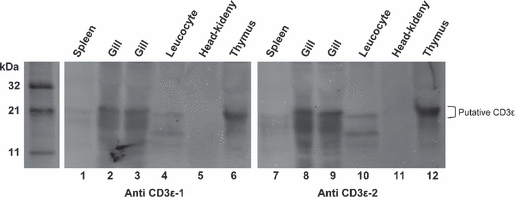
Western blot of crude tissue homogenates from Atlantic salmon probed with two affinity-purified rabbit polyclonal anti-CD3ε-sera. The expected molecular mass of salmon CD3ε is 17–19 kDa. Both antisera detected a prominent band of approximately 19 kDa from the thymus (lanes 6 and 12), strong, albeit less distinct, with gill preparations (lanes 2, 3, 8 and 9). A weak reactivity was detected with spleen (lanes 1 and 7), whereas no reactivity was recorded with head-kidney (lanes 5 and 11). The sera from the two rabbits reacted in a similar fashion in this experiment, but only sera from rabbit no. 2 was used in the other experiments presented here.
Flow cytometry including double-labelling experiments
Flow cytometry analysis showed that leucocytes from Atlantic salmon (blood leucocytes) and rainbow trout (blood and organ leucocytes) stained with the anti-CD3ε sera. The percentages of positive CD3ε+ rainbow trout lymphocytes are given in Fig. 6. High percentages of CD3ε+ lymphocytes were detected among thymocytes and intestinal and gill leucocytes, while moderate percentages were found in splenocytes and in cells of the head-kidney. The number of CD3ε+ blood leucocytes in both salmonid fish species (data not shown for Atlantic salmon) was rather low, but showed individual variations between 0.4 and 14.3%. In double-labelling experiments, no co-localization (double-stained cells ≤ 0.1%) of CD3ε or thrombocyte epitopes was detected, as for CD3ε and IgM epitopes (Fig. 7A,B).
Fig. 6.
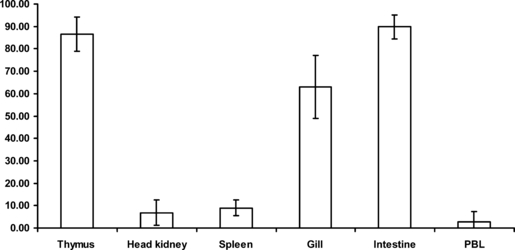
Percentages of CD3ε+ cells in rainbow trout leucocytes separated from different lymphoid tissues and peripheral blood measured by flow cytometry. Mean values are calculated from four different individuals using the two different anti-CD3ε sera (n = 8).
Fig. 7.
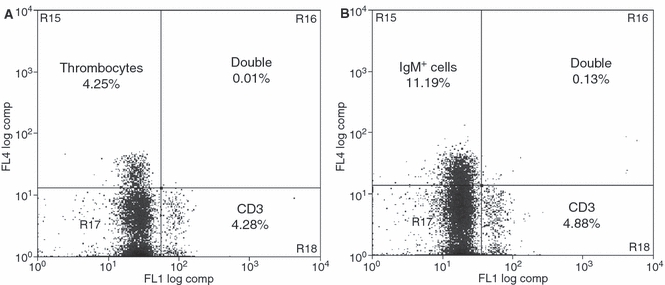
Double-flow cytometry analysis with rainbow trout splenocytes using the anti-CD3ε antisera and population specific antibodies for thrombocytes and IgM+ lymphocytes. (A) Double-labelling with a thrombocyte specific mAb. The figure shows an Alexa488 (FL1) against TriColor (FL4) dot plot. CD3ε single-positive cells are depicted in the lower right quadrant, thrombocytes in the upper left quadrant, while double-negative cells appear in the lower left quadrant. A negligible number of double-positive cells (0.01%) remain in the upper right quadrant. (B) Double-flow cytometry analysis using the CD3ε antiserum and mAbs specific for rainbow trout IgM. The figure shows an Alexa488 (FL1) against TriColor (FL4) dot plot. CD3ε single-positive cells are depicted in the lower right quadrant, IgM+ cells in the upper left quadrant, while double-negative cells appear in the lower left quadrant. A negligible number of double-positive cells (0.13%) were found in the upper right quadrant. The images depict a typical experiment repeated with four different individuals.
Histological investigations
Transversal sections of gill lamellae sampled at three different anatomical locations from differently sized Atlantic salmon and rainbow trout were examined (Fig. 1A,B). H&E staining of histological sections revealed substantial intraepithelial aggregates dominated by lymphocytes located at the terminal portion of the interbranchial septum (Fig. 1C). Due to its location, this cellular entity was named interbranchial lymphoid tissue (ILT). The results of the investigations were similar in all fish if not otherwise described below.
Immunohistological examination of salmonid ILT revealed an intense anti-CD3ε staining in abundant cells within the lymphoid tissue (Fig. 8A). At the base towards the interbranchial septum and in the periphery towards the mucosal surface, there was a clear distinction between layers of CD3ε− and CD3ε+ cells, respectively (Fig. 8B,C). An epithelial capsule, rich in mucous cells, was visible as a thin structure in young fish, but with an increasing thickness in more mature fish. This epithelial capsule was devoid of CD3ε+ cells and covered the mucosal surface of the ILT, seemingly forming a barrier to the external environment of the gill chamber (Fig. 8C). CD3ε+ cells within the ILT were frequently arranged in trabecular patterns with a base-to-surface orientation. Cryosections from rainbow trout (100 g) confirmed the location of strongly CD3ε+ cells in the terminal end of the septum (Fig. 8D). Cytokeratin immunostaining revealed an extensive meshwork of interstitial epithelium consisting of cells arranged in a parallel pattern with a base-to-surface orientation throughout the entire structure (Fig. 8E). Double-staining for cytokeratin and CD3ε demonstrated an intimate association between interstitial epithelial cells and T cells (Fig. 8F). Staining for immunoglobulin revealed a very limited number of Ig+ cells in the ILT (Fig. 8G). Control sections of gills and thymus with CD3ε pre-immunesera showed no positive reactions (data not shown).
Fig. 8.
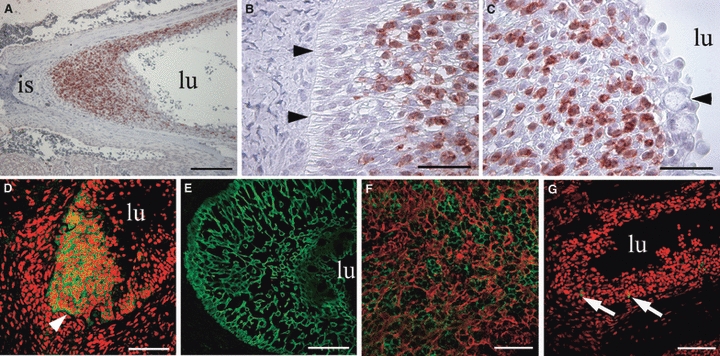
Immunomorphological and morphological analysis of the salmonid ILT, with the lumen of the branchial chamber indicated (lu). (A) Abundant CD3ε+ (red) cells between the interbranchial septum (is) and the lumen of the branchial chamber. (B) Polarized cells attached to the basal membrane (arrowheads) covered by CD3ε+ (red) cells. (C) Towards the lumen (lu) of the branchial chamber, CD3ε+ cells are more scattered and are covered by an epithelial cell layer containing goblet cells (arrowhead). (D) Strong CD3ε staining (green) of the ILT located between the basal membrane (arrowhead) and the branchial lumen (lu). PI counterstaining in red. (E) Staining for cytokeratin (green) reveals a meshwork of interstitial cells. (F) CD3ε+ cells (green) embedded in the meshwork of cytokeratin+ cells (red) of the interstitium. (G) Very few Ig+ cells (green) are present in the ILT. PI counterstaining in red. Scale bars: A = 200 μm, B,C = 40 μm, D,E,G = 80 μm, F = 60 μm.
In the thymus of sexually immature salmonids, a compartmentalization of high numbers of CD3ε+ cells was evident with a stronger staining observed in cells of the external sub-epithelial and in the internal (basal) zones compared to the intermediate zone (Fig. 9). In certain sites of the intermediate zone, clusters of strongly CD3ε+ cells with a well-developed cytoplasm were located together with blood vessels (Fig. 9). This arrangement was also evident in larger salmon (500 g and 2.63 kg) (Fig. 10A,B). In the intermediate zone, most cells displayed a very scanty cytoplasm and no immunostaining and with the appearance of immature thymocytes, whereas the abundant CD3ε+ cells in the sub-epithelial and the basal zones (not shown for Atlantic salmon) were not as densely arranged and displayed a more expanded cytoplasm (Fig. 10A,C). In the thymus of sexually mature fish (Fig. 10D–F) a compartmentalization between zones was not as evident as in younger fish, as immature-appearing thymocytes could not be observed. However, structures resembling corpuscles of Hassal were present (Fig. 10D–F). In this fish, abundant CD3ε+ cells were present (Fig. 10E), and a few scattered MHC class II+ cells could be detected throughout the tissue (Fig. 10F).
Fig. 9.
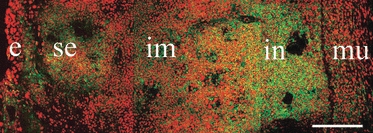
Anti-CD3 immunostain in section of frozen trout thymus. Immunoreactive cells (green) are found beneath the epithelium (e) in the sub-epithelial zone (se), embedded in clusters within the intermediate zone (im) and in great numbers at the base of the organ in the internal zone (in). Immunonegative muscle (mu) is seen at the very base of the organ. PI counterstaining in red. Scale bar: 120 μm.
Fig. 10.
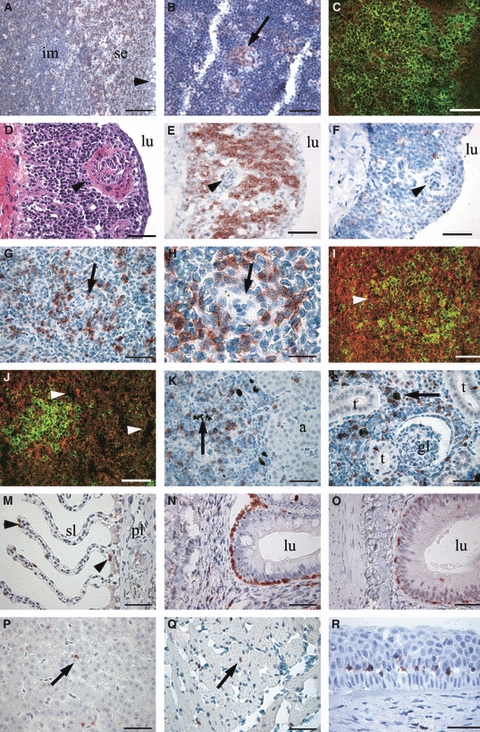
Anti-CD3ε immunostain in Atlantic salmon formalin-fixed and paraffin-embedded tissues (A,B,D–H,K–R) (red reaction, haematoxylin counterstained) or in cryosections from trout (C,I,J) (green fluorescence, PI counterstaining in red). (A) Thymus with capsule (arrowhead) and abundant CD3ε+ cells in the sub-epithelial zone (se) compared to deeper portions or intermediate zone (im). (B) Thymic intermediate cortex-like zone with island of CD3ε+ cells (arrow). (C) Abundant CD3ε+ cells in subcapsular areas. (D–F) Thymus of sexually mature salmon. Structures similar to corpuscles of Hassal (arrowheads). Branchial lumen is indicated (lu). The lymphocytes appear mature, and a distinction between outer and inner zone is not evident. A thin epithelial capsular structure encapsulates the luminal surface. (D) H&E staining. (E) CD3ε+ lymphocytes (red reaction, haematoxylin counterstain) within the thymus parenchyma and with no reactivity in the capsular and underlying structures. (F) MHC class II+ cells (red staining). (G,H) Spleen with CD3ε+ cells in white pulp arranged around ellipsoids (arrows). (I) A follicle-like appearance of CD3ε+ cells (green) in spleen (arrowhead), but this can be explained with a denser distribution round ellipsoids. (J) Occasionally, immunoreactive splenic cells associate with melanomacrophages (arrowheads). (K) Scattered CD3ε+ cells in head-kidney. Teleost adrenal homologue (a). Scattered melanomacrophages (arrow). (L) Strongly CD3ε+ cells scattered in the mid-kidney and occasionally in tubuli (t). Negative glomeruli (gl) and scattered melanomacrophages (arrow). (M) Scattered CD3ε+ cells (arrowheads) in primary (pl) and secondary (sl) gill lamellae. (N) Posterior gut segment with CD3ε+ cells. The intestinal lumen (lu) is indicated. (O) Anterior gut segment with more dispersed CD3ε+ cells. (P) CD3ε+ cells in liver (arrow), (Q) heart muscle (arrow) and (R) limbus region of the eye (several cells). Scale bars: A = 100 μm, B,D–G, K–R = 50 μm, C,I,J = 60 μm, H = 20 μm.
In the spleen, CD3ε+ cells were evident, with a majority detected in the white pulp, surrounding ellipsoids (Fig. 10G–J). Cryosections supported these results with positive cells seen arranged in dense clusters (Fig. 10I,J). In the red pulp, very few CD3ε+ cells could be detected.
In the head-kidney or permanent teleost pronephros, CD3ε+ cells were scattered throughout the tissue, but not densely arranged in clusters. The embedded adrenal tissue was devoid of CD3ε+ cells (Fig. 10K). In the mid-kidney, containing glomeruli, scattered strongly positive cells were seen, but not within the glomeruli (Fig. 10L).
In non-lymphoid tissue, the presence of CD3ε+ cells was confirmed in all organs investigated. Horizontal sections of gills exposing their respiratory epithelium showed limited numbers of stained cells in the primary and secondary lamellae (Fig. 10M). In first and second segments of the mid-intestine (Fuglem et al. 2010), CD3ε+ cells were confined between enterocytes along their basal membrane. There were some scattered CD3ε+ cells in the lamina propria, and they were occasionally detected in the luminal half of the enterocytes. The density of CD3ε+ cells seemed increased in the second gut segment (Fig. 10N,O). In the liver, scattered CD3ε+ cells were detected, mostly adjacent to hepatocyte trabeculae (Fig. 10P). In heart muscle, very few scattered CD3ε+ cells were seen (Fig. 10Q). In the eye, CD3ε+ cells were seen from the corneal limbus region and further out in the epidermis, but not in connection with structures of the optical axis (Fig. 10R). In brain and skeletal muscle, hardly any reaction was encountered. Sometimes, however, CD3ε+ cells were seen in perivascular tissues (data not shown).
Discussion
Investigations of T cells in teleosts have been hampered by the lack of useful cell markers. Therefore, the aim of this study was to generate a specific T cell marker and to address the normal distribution of such cells in salmonids.
The CD3 protein complex is considered highly specific for T cells. The target epitope for antisera generation against salmon CD3 was selected based on a sequence of a mammalian CD3ε amino acid fragment which has proved very useful for such purposes previously (Keresztes et al. 1996). Recent cloning and sequencing of the salmon CD3 complex gene (Liu et al. 2008) made this strategy possible. In various experiments including PAGE and analysis of transfected and non-transfected cells, Western blotting of different tissues, flow cytometry and morphological analysis, we have demonstrated that the generated antisera specifically recognize the target protein and thus function as a pan T cell marker in salmonid fish. The band intensity in the Western blotting reflected results from a previous experiment, showing that the relative expression levels of CD3ε mRNA in spleen and head-kidney were only about 15 and 8% of the expression in thymus, respectively (Liu et al. 2008). The present flow cytometry analysis was consistent with these findings, showing high numbers of CD3ε+ cells in the thymus, gill and intestine, and relatively lower numbers in the head-kidney, spleen and PBLs.
Based on the commonly used terminology for the structures of the lymphoid system (Pabst, 2007; Brandtzaeg et al. 2008), and on the data obtained from our studies, we propose to name the gill lymphoid structure the ‘interbranchial lymphoid tissue’, or the ILT. In the present investigation, we have confirmed that the ILT harbours abundant T cells embedded in a meshwork of epithelial cells. Our observations indicate that the ILT displays some characteristics of a secondary lymphoid organ with no primary lymphoid organ attributes. This is supported by previous studies in teleosts, where gills have not been identified to express Rag genes (Huttenhuis et al. 2005), which are active in the recombination process of maturing T cells in primary lymphoid organs. On the other hand, such expression is high in the teleost thymus (Huttenhuis et al. 2005). In addition, the ILT has no compartmentalization analogous to the thymic medulla and cortex, and apparently no immature T cells were present, this being the case for fish from all age groups. No structures similar to corpuscles of Hassal were observed in older fish; however, such structures were present in the thymus. Our findings suggest that the morphological differences between the thymus and the ILT necessarily imply different roles in the salmonid immune system. Mammalian MALTs are major producers of IgA (Ruddle & Akirav, 2009). It is therefore noteworthy that so few Ig+ cells were present in the ILT. Nevertheless, in the mouse, almost all intraepithelial lymphocytes are T cells (Ishikawa et al. 2007). We have previously failed to identify vessels within the ILT, which at its base has a well-defined basal membrane (Haugarvoll et al. 2008), and therefore differ from mammalian MALTs in being a purely intraepithelial structure. Thus, the ILT has no resemblance to previously described lymphoid tissues.
In the external (sub-epithelial) regions of the thymus, putative mature T cells as identified by their strong CD3ε expression and a high cytoplasm/nucleus ratio were observed. Islets of such cells were also found in the intermediate regions, apparently in connection with blood vessels and also embedded in regions consisting predominantly of immature thymocytes. High amounts of highly positive CD3ε+ cells were also observed in the basal thymus layer. In older individuals, the thymic tissue diminished in size and contained structures similar to corpuscles of Hassal and apparently only mature T cells characterized by a high cytoplasm/nucleus ratio and high CD3ε expression. The compartmentalization of the salmonid thymus as previously described with more abundant MHC class II+ cells in its sub-epithelial and basal regions (Koppang et al. 2003b; Fischer et al. 2005) was thus positively correlated to the abundance of CD3ε+ cells. This is in agreement with findings in mammalian thymus, showing abundant MHC class II expression in the medulla together with mature T cells (Douek & Altmann, 2000). In mammals, cortical thymocytes are hallmarked with a low cytoplasm/nucleus ratio and negligible expression of TcR/CD3, whereas during maturation and migration to the medulla, the cytoplasm/nucleus ratio increases, and the cells express an increasing amount of TcR/CD3 molecules before leaving the organ (Yang et al. 1996; Pearse, 2006). The anatomical organization of the salmonid thymic cortex and medulla seems to be composed of three layers: a sub-epithelial medulla-like zone (high abundance of strongly labelled CD3ε+ cells, and substantial MHC class II expression – see Koppang et al. 2003b), an intermediate cortex-like zone (low numbers of CD3ε+ cells, low amounts of MHC class I and II expression – see Koppang et al. 2003b; Fischer et al. 2005, respectively) and another cortex-like basal zone (high abundance of strongly labelled CD3ε+ cells, high amounts of MHC class I and II expression – see Koppang et al. 2003b; Fischer et al. 2005) rather than having a concentric medulla/cortex composition like mammals and other teleost species (Langenau & Zon, 2005; Pearse, 2006; Picchietti et al. 2008).
In the spleen, the distribution of T cells in the white medulla was similar to the periarteriolar lymphoid sheet as described in mammals. The white pulp has been defined as an organized lymphoid structure (Ruddle & Akirav, 2009); this seems to apply in salmonids. The head-kidney or the permanent pronephros functions both as a secondary lymphoid organ and simultaneously as the teleost bone marrow equivalent, involved in haematopoiesis (Zapata & Amemiya, 2000). The structure is rich in scattered MHC class II+ cells and B cells (Koppang et al. 2003,b; Zwollo et al. 2005). The T cells identified in this study appeared scattered throughout the tissue in a similar fashion. There is no distinct junction between the head-kidney and the glomeruli-containing mid-kidney, which also was found to contain abundant scattered T cells. It has been speculated that developing B cells mature in the head-kidney and then migrate to the spleen and the mid-kidney for activation (Zwollo et al. 2005). It is reasonable that such events require the presence of T cells at the different sites.
In the respiratory epithelium of the gills, scattered T cells were seen. In the intestinal tract, abundant intraepithelial T cells were identified, mirroring the situation in mammals (Ishikawa et al. 2007).
In the non-lymphoid tissues liver, heart and eye, very few CD3ε+ cells were seen. This was also the case for MHC class II+ cells as previously reported in salmon (Koppang et al. 2003a,b;). Thus, apart from the ILT, thymus and spleen, no parenchymatous accumulations of T cells were identified in the other tissues investigated, analogous to the situation described in zebrafish (Langenau & Zon, 2005).
Interestingly, it has been suggested that T cells were the first lymphocytes to acquire variable-diversity-joining-type receptors, and that the thymus was the first lymphoid organ to evolve in vertebrates (Boehm & Bleul, 2007). In the ontogeny of intestinal immune cells in the common carp (Cyprinus carpio), putative T cells also occur much earlier than B cells (Huttenhuis et al. 2006). This could suggest that the first MALT to evolve could be transient lymphoid structures harbouring predominantly T cells and developing in the immunologically important pharyngeal region. This location seems to play a key role in both the phylogeny and the ontogeny of the immune system (Matsunaga & Rahman, 2001; Boehm & Bleul, 2007; Varga et al. 2008). The ontogenetic origins of the thymus, tonsils and gills are closely related (Matsunaga & Rahman, 2001). There is a possibility that the ILT develops from similar pharyngeal pouches (also known as gill pouches) as the tonsils in mammals. If so, a primitive form of early organ differentiation might be reflected in the presence and organization of the salmonid ILT.
It can only be speculated why aggregates of T cells are found in the gills and not at other mucosal sites. The gills are heavily exposed to antigens, and the ILT unquestionably occupies a strategic position regarding antigen surveillance and thus possibly functioning as a secondary lymphoid organ. Cells with special antigen-sampling abilities were recently discovered in the gastrointestinal epithelium of salmonids (Fuglem et al. 2010), and future research should aim at identifying their counterparts in the respiratory system of teleosts.
The functions of secondary lymphoid organs include the maintenance of a diverse repertoire of antigen receptor-bearing cells and the ability to respond locally to immune stimulation. However, it remains to be shown that immune induction actually occurs within the ILT. Its content of scattered MHC class II+ cells indicates that such events may take place (Haugarvoll et al. 2008). If so, induction of immune responses in the ILT could be a prime target for novel vaccine strategies, seeking to avoid undesired side-effects such as systemic autoimmunity and this condition's implications caused by the current immunization strategies in the salmon aquaculture industry (Koppang et al. 2008; Haugarvoll et al. 2010). The obvious inter-and intra-structural dynamics of T cell migration should also be a field of considerable interest in future studies. Due to the location of ILT, we believe this structure may be viewed in association with the organogenesis of thymus and of the tonsil ring of mammals (Varga et al. 2008), representing an evolutionary forerunner of mammalian MALTs. In our ongoing investigations of the mucosal immune system of salmonids, in future studies we will focus on a possible immune induction of the ILT, attempting to reveal its functions.
Acknowledgments
The authors are indebted to Dr. David Griffiths, Norwegian School of Veterinary Science, for his contribution to Fig. 1A and B. The Sport Fishermen's Club at Hellefossen, river Drammenselva, Buskerud, Norway, is thanked for enthusiastic assistance with providing material.
References
- Alder MN, Herrin BR, Sadlonova A, et al. Antibody responses of variable lymphocyte responses in the lamprey. Nat Immunol. 2008;9:319–327. doi: 10.1038/ni1562. [DOI] [PubMed] [Google Scholar]
- Boehm T, Bleul CC. The evolutionary history of lymphoid organs. Nat Immunol. 2007;8:131–135. doi: 10.1038/ni1435. [DOI] [PubMed] [Google Scholar]
- Bowden TJ, Cook P, Rombout JH. Development and function of the thymus in teleosts. Fish Shellfish Immunol. 2005;19:413–427. doi: 10.1016/j.fsi.2005.02.003. [DOI] [PubMed] [Google Scholar]
- Brandtzaeg P, Kiyono H, Pabst R, et al. Terminology: nomenclature of the mucosa-associated lymphoid tissue. Mucosal Immunol. 2008;1:31–37. doi: 10.1038/mi.2007.9. [DOI] [PubMed] [Google Scholar]
- Chen K, Xu W, Wilson M, et al. Immunoglobulin D enhances immune surveillance by activating antimicrobial, proinflammatory and B cell-stimulating programs in basophils. Nat Immunol. 2009;10:889–898. doi: 10.1038/ni.1748. [DOI] [PMC free article] [PubMed] [Google Scholar]
- Cooper MD, Alder NM. The evolution of adaptive immune systems. Cell. 2006;124:815–822. doi: 10.1016/j.cell.2006.02.001. [DOI] [PubMed] [Google Scholar]
- Danilova N, Bussmann J, Jekosch K, et al. The immunoglobulin heavy-chain locus in zebrafish: identification and expression of a previously unknown isotype, immunoglobulin Z. Nat Immunol. 2005;6:295–302. doi: 10.1038/ni1166. [DOI] [PubMed] [Google Scholar]
- DeLuca D, Wilson M, Warr GH. Lymphocyte heterogenity in the trout, Salmo gaidneri, defined with monoclonal antibodies to IgM. Eur J Immunol. 1983;13:546–551. doi: 10.1002/eji.1830130706. [DOI] [PubMed] [Google Scholar]
- Deza FG, Espinel CS, Mompó SM. Presence of a unique IgT on the IGH locus in Gasterosteus aculeatus and the very recent generation of a repertoire of VH genes. Dev Comp Immunol. 2010;34:114–122. doi: 10.1016/j.dci.2009.08.011. [DOI] [PubMed] [Google Scholar]
- Douek DC, Altmann DM. T-cell apoptosis and differential human leukocyte antigen class II expression in human thymus. Immunology. 2000;99:249–256. doi: 10.1046/j.1365-2567.2000.00940.x. [DOI] [PMC free article] [PubMed] [Google Scholar]
- Fischer U, Köllner B. Preparation of B-cell and monocyte free thrombocyte suspensions. In: Stolen JS, Fletcher TC, Rowley AF, Anderson DP, Kaattari SL, Zelikoff JT, Smith SA, editors. Techniques in Fish Immunology-3. Fair Haven: SOS Publications; 1994. pp. 27–33. [Google Scholar]
- Fischer U, Köllner B, Kiryu I, et al. The ontogeny of MHC class I expression in rainbow trout (Oncorhynchus mykiss L.) Fish Shellfish Immunol. 2005;18:49–60. doi: 10.1016/j.fsi.2004.05.006. [DOI] [PubMed] [Google Scholar]
- Fuglem B, Jirillo E, Bjerkås I, et al. Antigen-sampling cells in the salmonid intestinal epithelium. Dev Comp Immunol. 2010;34:768–774. doi: 10.1016/j.dci.2010.02.007. [DOI] [PubMed] [Google Scholar]
- Hansen JD, Landis ED, Phillips RB. Discovery of a unique Ig heavy-chain isotype (IgT) in rainbow trout: implications for a distinctive B cell developmental pathway in teleost fish. Proc Natl Acad Sci U S A. 2005;102:6919–6924. doi: 10.1073/pnas.0500027102. [DOI] [PMC free article] [PubMed] [Google Scholar]
- Haugarvoll E, Bjerkås I, Nowak BF, et al. Identification and characterisation of a novel intraepithelial lymphoid tissue in the gills of Atlantic salmon. J Anat. 2008;213:202–209. doi: 10.1111/j.1469-7580.2008.00943.x. [DOI] [PMC free article] [PubMed] [Google Scholar]
- Haugarvoll E, Bjerkås I, Szabo NJ, et al. Manifestations of systemic autoimmunity in vaccinated salmon. Vaccine. 2010;28:4961–4969. doi: 10.1016/j.vaccine.2010.05.032. [DOI] [PubMed] [Google Scholar]
- Hordvik I, Thevarajan J, Samdal I, et al. Molecular cloning and phylogenetic analysis of the Atlantic salmon immunoglobulin D gene. Scand J Immunol. 1999;50:202–210. doi: 10.1046/j.1365-3083.1999.00583.x. [DOI] [PubMed] [Google Scholar]
- Huttenhuis HB, Huising MO, van der Meulen T, et al. Rag expression identifies B and T cell lymphopoietic tissues during the development of common carp (Cyprinus carpio) Dev Comp Immunol. 2005;29:1033–1047. doi: 10.1016/j.dci.2005.03.005. [DOI] [PubMed] [Google Scholar]
- Huttenhuis HB, Romano N, van Oosterhoud CN, et al. The ontogeny of mucosal immune cells in common carp (Cyprinus carpio L.) Anat Embryol. 2006;211:19–29. doi: 10.1007/s00429-005-0062-0. [DOI] [PubMed] [Google Scholar]
- Ishikawa H, Naito T, Iwanaga T, et al. Curriculum vitae of intestinal intraepithelial T cells: their developmental and behavioral characteristics. Immunol Rev. 2007;215:154–165. doi: 10.1111/j.1600-065X.2006.00473.x. [DOI] [PubMed] [Google Scholar]
- Keresztes G, Glávits R, Krenács L, et al. An anti-CD3ε serum detects T lymphocytes in paraffin-embedded pathological tissues in many animal species. Immunol Lett. 1996;50:167–172. doi: 10.1016/0165-2478(96)02534-5. [DOI] [PubMed] [Google Scholar]
- Köllner B, Fischer U, Rombout JH, et al. Potential involvement of rainbow trout thrombocytes in immune functions: a study using a panel of monoclonal antibodies and RT-PCR. Dev Comp Immunol. 2004;28:1049–1062. doi: 10.1016/j.dci.2004.03.005. [DOI] [PubMed] [Google Scholar]
- Koppang EO, Bjerkås E, Bjerkås I, et al. Vaccination induces major histocompatibility complex class II expression in the Atlantic salmon eye. Scand J Immunol. 2003a;58:9–14. doi: 10.1046/j.1365-3083.2003.01279.x. [DOI] [PubMed] [Google Scholar]
- Koppang EO, Hordvik I, Bjerkås I, et al. Production of antisera against recombinant MHC class II β chain and identification of immunoreactive cells in Atlantic salmon (Salmo salar) Fish Shellfish Immunol. 2003b;14:115–132. doi: 10.1006/fsim.2002.0424. [DOI] [PubMed] [Google Scholar]
- Koppang EO, Bjerkås I, Haugarvoll E, et al. Vaccination-induced systemic autoimmunity in farmed Atlantic salmon. J Immunol. 2008;181:4807–4814. doi: 10.4049/jimmunol.181.7.4807. [DOI] [PubMed] [Google Scholar]
- Langenau DM, Zon LI. The zebrafish: a new model of T-cell and thymic development. Nat Rev. 2005;5:307–317. doi: 10.1038/nri1590. [DOI] [PubMed] [Google Scholar]
- Liu Y, Moore L, Koppang EO, et al. Characterization of the CD3ζ, CD3γδ and CD3ε subunits of the T cell receptor complex in the Atlantic salmon. Dev Comp Immunol. 2008;32:26–35. doi: 10.1016/j.dci.2007.03.015. [DOI] [PubMed] [Google Scholar]
- Matsunaga T, Rahman A. In search of the origin of the thymus: the thymus and GALT may be evolutionarily related. Scand J Immunol. 2001;53:1–6. doi: 10.1046/j.1365-3083.2001.00854.x. [DOI] [PubMed] [Google Scholar]
- Nam B-H, Hirono I, Aoki T. The four TCR genes of teleost fish: the cDNA and genomic DNA analysis of Japanese flounder (Paralichthys olivaceus) TCR α-, β-, γ-, and δ-chains. J Immunol. 2003;170:3081–3090. doi: 10.4049/jimmunol.170.6.3081. [DOI] [PubMed] [Google Scholar]
- Olson KR. Secondary circulation in fish: anatomical organization and physiological significance. J Exp Zool. 1996;275:172–185. [Google Scholar]
- Pabst R. Plasticity and heterogeneity of lymphoid organs. What are the criteria to call a lymphoid organ primary, secondary or tertiary? Immunol Lett. 2007;112:1–8. doi: 10.1016/j.imlet.2007.06.009. [DOI] [PubMed] [Google Scholar]
- Pearse G. Normal structure, function and histology of the thymus. Toxicol Pathol. 2006;34:504–514. doi: 10.1080/01926230600865549. [DOI] [PubMed] [Google Scholar]
- Picchietti S, Guerra L, Selleri L, et al. Compartmentalisation of T cells expressing CD8α and TCRβ in developing thymus of sea bass Dicentrarchus labrax (L.) Dev Comp Immunol. 2008;32:92–99. doi: 10.1016/j.dci.2007.04.002. [DOI] [PubMed] [Google Scholar]
- Rodewald HR. Thymus organogenesis. Annu Rev Immunol. 2008;26:355–388. doi: 10.1146/annurev.immunol.26.021607.090408. [DOI] [PubMed] [Google Scholar]
- Ruddle NH, Akirav EM. Secondary lymphoid organs: responding to genetic and environmental cues in ontogeny and immune response. J Immunol. 2009;183:2205–2212. doi: 10.4049/jimmunol.0804324. [DOI] [PMC free article] [PubMed] [Google Scholar]
- Saha NR, Suetake H, Kikuchi K, et al. Fugu immunoglobulin D: a highly unusual gene with unprecedented duplications in its constant region. Immunogenetics. 2004;56:438–447. doi: 10.1007/s00251-004-0693-y. [DOI] [PubMed] [Google Scholar]
- Savan R, Aman A, Nakao M, et al. Discovery of a novel immunoglobulin heavy chain gene chimera from common carp (Cyprinus carpio L.) Immunogenetics. 2005a;57:458–463. doi: 10.1007/s00251-005-0015-z. [DOI] [PubMed] [Google Scholar]
- Savan R, Aman A, Sato K, et al. Discovery of a new class of immunoglobulin heavy chain from fugu. Eur J Immunol. 2005b;35:3320–3331. doi: 10.1002/eji.200535248. [DOI] [PubMed] [Google Scholar]
- Stenvik J, Jørgensen TØ. Immunoglobulin D (IgD) of Atlantic cod has a unique structure. Immunogenetics. 2000;51:452–461. doi: 10.1007/s002510050644. [DOI] [PubMed] [Google Scholar]
- Sunyer O, Zhang Y-A, Li J, et al. Is IgT the evolutionary equivalent of IgA? Insight into its structure and function. J Immunol. 2009;182:81–21. [Google Scholar]
- Thuvander A, Fossum C, Lorenzen N. Monoclonal antibodies to salmonid immunoglobulin: characterization and applicability in immunoassays. Dev Comp Immunol. 1990;14:415–423. doi: 10.1016/0145-305x(90)90034-c. [DOI] [PubMed] [Google Scholar]
- Varga I, Pospíšilová V, Gmitterová K, et al. The phylogenesis and ontogenesis of the human pharyngeal region focused on the thymus, parathyroid, and thyroid glands. Neuro Endocrinol Lett. 2008;29:101–109. [PubMed] [Google Scholar]
- Viertlboeck BC, Crooijmans RP, Groenen MA, et al. Chicken Ig-like receptor B2, a member of a multigene family, is mainly expressed on B lymphocytes, recruits both Src homology 2 domain containing protein tyrosine phosphatase (SHP)-1 and SHP-2, and inhibits proliferation. J Immunol. 2004;173:7385–7393. doi: 10.4049/jimmunol.173.12.7385. [DOI] [PubMed] [Google Scholar]
- Vogel WOP. Zebrafish and lymphangiogenesis: a reply. Anat Sci Int. 2010;85:118–119. doi: 10.1007/s12565-010-0077-3. [DOI] [PubMed] [Google Scholar]
- Wilson M, Bengtén E, Miller NW, et al. A novel chimeric Ig heavy chain from a teleost fish shares similarities to IgD. Proc Natl Acad Sci U S A. 1997;29:4593–4597. doi: 10.1073/pnas.94.9.4593. [DOI] [PMC free article] [PubMed] [Google Scholar]
- Yang H, Oura CA, Kirkham PA, et al. Preparation of monoclonal anti-porcine CD3 antibodies and preliminary characterization of porcine T lymphocytes. Immunology. 1996;88:577–585. doi: 10.1046/j.1365-2567.1996.d01-682.x. [DOI] [PMC free article] [PubMed] [Google Scholar]
- Yaniv K, Isogai S, Castranova D, et al. Live imaging of lymphatic development in the zebrafish. Nat Med. 2006;12:711–716. doi: 10.1038/nm1427. [DOI] [PubMed] [Google Scholar]
- Zapata A, Amemiya CT. Phylogeny of lower vertebrates and their immunological structures. Curr Top Microbiol Immunol. 2000;248:67–107. doi: 10.1007/978-3-642-59674-2_5. [DOI] [PubMed] [Google Scholar]
- Zhang YA, Salinas I, Li J, et al. IgT, a primitive immunoglobulin class specialized in mucosal immunity. Nat Immunol. 2010;11:827–835. doi: 10.1038/ni.1913. [DOI] [PMC free article] [PubMed] [Google Scholar]
- Zwollo P, Cole S, Bromage E, et al. B cell heterogeneity in the teleost kidney: evidence for a maturation gradient from anterior to posterior kidney. J Immunol. 2005;174:6608–6616. doi: 10.4049/jimmunol.174.11.6608. [DOI] [PubMed] [Google Scholar]


