

Abstract
Retinal ganglion cells exhibit substantial correlated firing: a tendency to fire nearly synchronously at rates different from those expected by chance. These correlations suggest that network interactions significantly shape the visual signal transmitted from the eye to the brain. This study describes the degree and structure of correlated firing among the major ganglion cell types in primate retina. Correlated firing among ON and OFF parasol, ON and OFF midget, and small bistratified cells, which together constitute roughly 75% of the input to higher visual areas, was studied using large-scale multi-electrode recordings. Correlated firing in the presence of constant, spatially uniform illumination exhibited characteristic strength, time course and polarity within and across cell types. Pairs of nearby cells with the same light response polarity were positively correlated; cells with the opposite polarity were negatively correlated. The strength of correlated firing declined systematically with distance for each cell type, in proportion to the degree of receptive field overlap. The pattern of correlated firing across cell types was similar at photopic and scotopic light levels, although additional slow correlations were present at scotopic light levels. Similar results were also observed in two other retinal ganglion cell types. Most of these observations are consistent with the hypothesis that shared noise from photoreceptors is the dominant cause of correlated firing. Surprisingly, small bistratified cells, which receive ON input from S cones, fired synchronously with ON parasol and midget cells, which receive ON input primarily from L and M cones. Collectively, these results provide an overview of correlated firing across cell types in the primate retina, and constraints on the underlying mechanisms.
Non-technical summary
This paper examines the correlated firing among multiple ganglion cell types in the retina. For many years it has been known that ganglion cells exhibit a tendency to fire simultaneously more or less frequently than would be predicted by chance. However, the particular patterns of correlated activity in the primate retina have been unclear. Here we reveal systematic, distance-dependent correlations between different ganglion cell types. For the most part, the patterns of activity are consistent with a model in which noise in cone photoreceptors propagates through common retinal circuitry, creating correlations among ganglion cell signals.
Introduction
A fundamental aspect of population coding in the nervous system is correlated firing: a tendency for two or more neurons to fire nearly simultaneously more or less frequently than would be expected by chance. Correlated firing has been observed in many neural circuits, provides clues about their structure, and may have a fundamental impact on the neural code (see Rieke et al. 1997; Shlens et al. 2008).
In the retina, correlated firing is an important aspect of the visual signal transmitted to the brain. Correlated firing is prevalent in retinal ganglion cells (RGCs) of many species (e.g. cat, goldfish, salamander, rabbit, guinea pig and macaque) (Rodieck, 1967; Arnett, 1978; Mastronarde, 1983a; Meister et al. 1995; DeVries, 1999; Schnitzer & Meister, 2003; Shlens et al. 2006), reflecting a combination of shared inputs and reciprocal coupling (Mastronarde, 1983a; Brivanlou et al. 1998; DeVries, 1999; Hu & Bloomfield, 2003; Hidaka et al. 2004; Trong & Rieke, 2008). Correlated spikes in RGCs have been proposed to represent a distinct mode of visual signalling (Meister et al. 1995; Schnitzer & Meister, 2003; Schneidman et al. 2006), conveying information not available in the spikes of individual cells (Meister, 1996) and driving postsynaptic responses with high efficacy (Usrey et al. 1998). More generally, correlated firing between RGCs influences the statistics of population responses in RGCs. Because correlations can originate in shared circuitry and/or shared visual stimulation, their structure and organization may affect our understanding of how the brain can most effectively read out retinal signals (Puchalla et al. 2005; Pillow et al. 2008; but see Nirenberg et al. 2001).
Relatively little is known about the properties of correlated firing within and across the diverse types of RGCs in macaque monkey retina. The macaque retina and visual system closely resemble their human counterparts, and are the basis for much of our understanding of visual processing. Each RGC type – which is characterized by distinctive morphology, light responses, connectivity to retinal interneurons, and projection patterns in the brain – is thought to convey a full representation of the visual scene, forming an elementary parallel pathway for vision (see Rodieck, 1998). Five numerically dominant RGC types – ON and OFF midget, ON and OFF parasol, and small bistratified cells – collectively constitute ∼75% of the retinal representation (Dacey, 2004). To date, correlated firing has been studied only in parasol cells, at photopic light levels (Shlens et al. 2006, 2008; Trong & Rieke, 2008). However, previous studies in cat retina (Mastronarde, 1983a) and rabbit retina (DeVries, 1999) indicate that the extent and properties of correlated firing vary significantly between different RGC types and with light level, potentially providing insight into mechanism. These findings suggest the need for a more comprehensive understanding of correlated firing in primate retina.
This study provides a quantitative description of spontaneous correlated firing within and across the five numerically dominant RGC types in macaque retina, as well as two other cell types, at photopic and scotopic light levels. The pattern of correlated firing varied systematically with cell type, and was mostly consistent with an origin in shared noise from photoreceptors. The results provide the basis for quantitative models of correlated firing in the retina as well as information about the underlying mechanisms.
Methods
Recording
Retinas were obtained and recorded as described previously (Litke et al. 2004; Field et al. 2007). Briefly, eyes were enucleated from terminally anaesthetized macaque monkeys (Macaca mulatta and Macaca fascicularis) used in the course of other experiments, in accordance with Salk Institute IACUC guidelines for the care and use of animals. Data were obtained in 12 recordings from the retinas of 10 macaques. Immediately after enucleation, the anterior portion of the eye and vitreous were removed in room light. Following a dark-adaptation period of >40 min, segments of peripheral retina (7–13 mm, 30–60 deg; Drasdo & Fowler, 1974; Perry & Cowey, 1985) that were well attached to the pigment epithelium were isolated and placed flat, RGC layer down, on a planar array of extracellular microelectrodes. In some cases the pigment epithelium was left attached to the retina during recording. No differences in spike rate were observed between isolated and attached recordings other than those attributable to temperature (n = 2). During recording, the retina was perfused with Ames’ solution (33–36°C) bubbled with 95% O2 and 5% CO2, pH 7.4.
Recordings were analysed offline to isolate the spikes of different cells, as described previously (Field et al. 2007). Briefly, candidate spikes were detected using a threshold on each electrode, and the voltage waveforms on the electrode and nearby electrodes around the time of the spike were extracted. Clusters of similar spike waveforms were identified as arising from a single neuron if they exhibited a refractory period.
Visual stimulation
Visual stimulation techniques were described previously (Field et al. 2007). Briefly, the optically reduced image of a linearized cathode ray tube computer display (Sony Multiscan E100) refreshing at 120 Hz was focused on the photoreceptor outer segments. In most experiments the image was delivered from the photoreceptor side. In experiments in which the pigment epithelium was left attached, the image was delivered through the mostly transparent electrode array. The display was calibrated using a PR-701 spectroradiometer (PhotoResearch, Chatsworth, CA, USA) and a photodiode (UDT Instruments, San Diego, CA, USA). The light intensity was controlled by neutral density filters in the light path. The light level was 830 (840, 440) P* (L (M, S) cone)−1 s−1 if not noted differently. The photopic photon absorption rates were computed assuming a 0.37 μm2 collecting area for primate cones (Schnapf et al. 1990).
A white noise stimulus, composed of a lattice of square pixels updating randomly and independently over time, was used to characterize the receptive field properties of recorded RGCs (Chichilnisky, 2001). The intensity of each display primary at each pixel location was chosen independently from a binary distribution at each refresh. The time-averaged contrast of each primary (difference between the maximum and minimum intensities divided by the sum of intensities) was 96%. A stimulus pixel size of ∼60 (∼90) μm on a side was used at photopic (scotopic) light levels. Measurements of correlated spontaneous firing were obtained in the presence of a spatially uniform, full-field display with intensity equal to the mean intensity of the white noise stimulus used for receptive field characterization. No entrainment to the refresh rate of the stimulus display was detected in the spike autocorrelation function of the recorded cells or its Fourier transform. For the measurements of correlated firing in response to light stimulation, a low-pass-filtered white noise pattern was presented. A fine-grained white noise pattern (frame rate 120 Hz, pixel size ∼12 μm) was convolved with an exponential temporal filter with a time constant of 50 ms, and with a Gaussian spatial filter of standard deviation ∼22–176 μm. Unfiltered white noise stimuli produced similar results (not shown).
Data analysis
Distinct RGC types were identified using their functional properties, e.g. response time course, receptive field size and autocorrelation function (Chichilnisky & Kalmar, 2002; Field et al. 2007; Petrusca et al. 2007). In a space defined by these parameters, well-defined clusters were taken to represent distinct functional cell classes. The correspondence of these cell classes to cell types known from anatomical work was confirmed by the uniform tiling of visual space by the receptive fields of each class (Devries & Baylor, 1997). Cell types were determined by density and light response properties as described previously (Chichilnisky & Kalmar, 2002; Field et al. 2007; Petrusca et al. 2007). The receptive fields of the wide-field ON cell class tile visual space, and these cells exhibit a density similar to that of OFF upsilon cells (Petrusca et al. 2007).
Receptive fields were estimated by computing the spike triggered average (STA) of a white-noise stimulus (Chichilnisky, 2001) and summarized by fitting the STA with a model consisting of the product of a spatial profile, which was used for further analysis, and a temporal profile (see Field et al. 2007). For midget and parasol cells, at photopic light levels, the spatial profile was a difference of Gaussian functions, with a centre–surround diameter ratio fixed by the average of fits across cells of that type in the same preparation. This surround radius was always ∼2–3 times that of the centre. For small bistratified cells, a single Gaussian function was fitted to the blue display primary component of the STA. At scotopic light levels, no surrounds were observed and the spatial component of the fit was a single Gaussian function for all cell types. The outlines in Fig. 1 represent the elliptical 1 s.d. boundary of the centre components of Gaussian fits. The distance between cells (abscissa in Figs 2B and 3B) was normalized by the mean s.d. of their Gaussian fits measured along the line connecting the centres of the fits. Adjacent neurons in each mosaic were identified using a Voronoi tessellation (Shlens et al. 2009). Misidentified adjacencies in a mosaic apparently attributable to unrecorded cells were excluded.
Figure 1. Correlated firing among ON and OFF parasol cells.
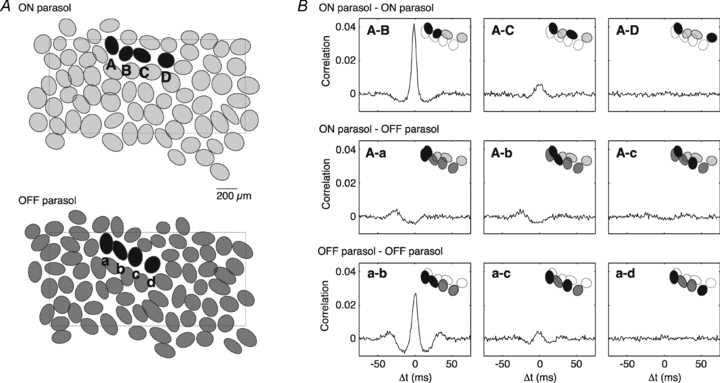
A, receptive field outlines of complete ON and OFF parasol cell mosaics, simultaneously recorded. Outlines are drawn at the 1 s.d. contour of Gaussian fits (see Methods). Rectangle indicates the outline of the electrode array. B, cross-correlation of the spontaneous activity between cells labelled in A; cell pairs are given in insets. Note the positive correlation in the ON–ON and OFF–OFF pairs, the negative correlation in ON–OFF pairs, and the decline in correlation with distance. Bin size: 1 ms.
Figure 2. Spatial organization of spontaneous correlated firing within and across RGC types at a photopic light level. Bin size: 10 ms. Light level: 830 (840, 440) P* (L (M, S) cone)−1 s−1).
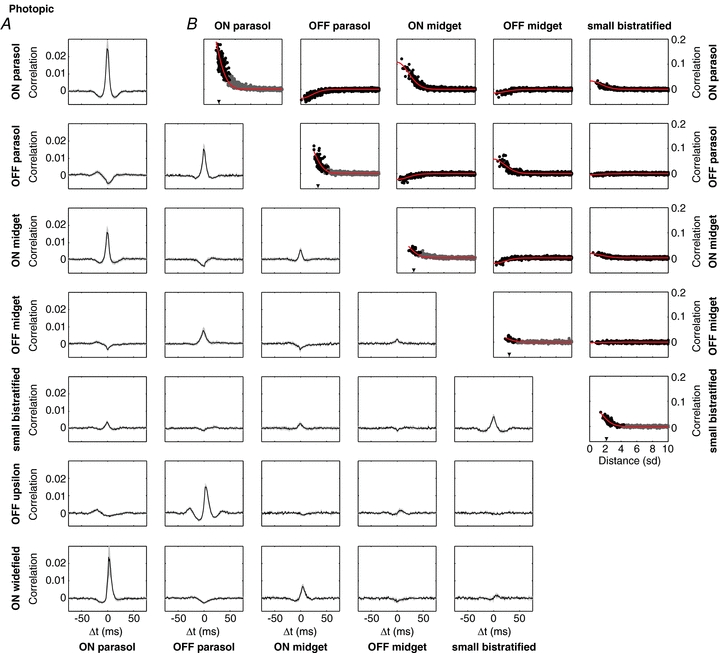
A, average CCF of nearby cell pairs of each cell type combination. Data from ON and OFF parasol, ON and OFF midget, and small bistratified cells were obtained in a single recording; data from OFF upsilon cells and unidentified wide-field ON cells were obtained in separate recordings (bin size: 1 ms; zero bin omitted; grey shaded region represents 1 s.d. across cell pairs). B, correlation coefficient at time zero as a function of distance between cells. Curves show the dependence of the average receptive field overlap on distance (see Methods). In panels that represent correlations between cells of the same type, neighbouring pairs of cells in the mosaic are indicated with black points, other cell pairs are represented with grey points. The normalized nearest neighbour distance is marked with a arrowhead on the abscissa. Bin size: 10 ms.
Figure 3. Spatial organization of spontaneous correlated firing within and across RGC types at a scotopic light level.
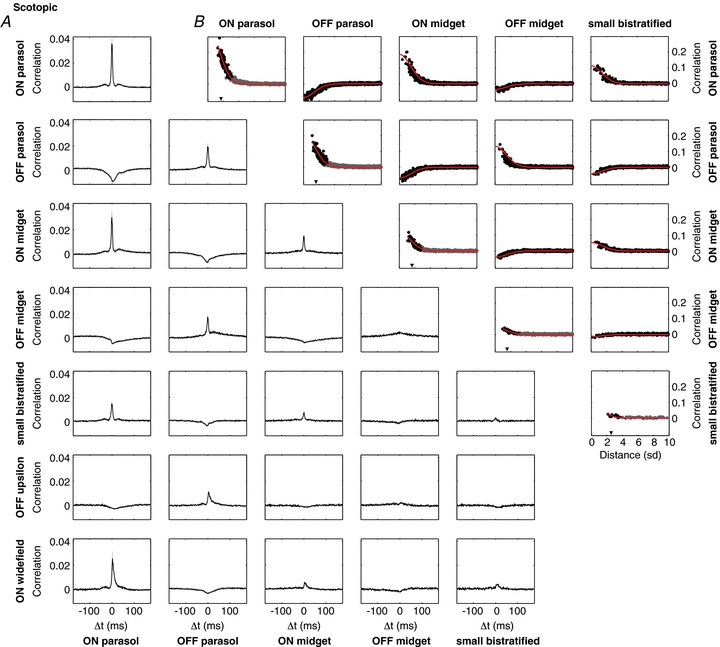
Panels are as in Fig. 2. All data were obtained in a single recording. Light level: 1.2 P* rod−1s−1.
Cross-correlation functions (CCFs, e.g. Fig. 2A) were obtained by binning spikes into 1 ms time bins and computing the correlation coefficient between the resulting spike count vectors, with a temporal offset. CCFs were summarized by averaging across pairs with the highest overlap of a given cell type combination. Cells with noisy STAs, unstable spike rate, or autocorrelation functions or electrical images (Litke et al. 2004) indicative of imperfect spike sorting were excluded from analysis. CCFs that exhibited spike sorting artifacts due to waveform overlap were excluded (see below). The zero time bin in each CCF plot was omitted. The shuffled CCF (or shift predictor) was calculated over identical repeats of the stimulus (Perkel et al. 1967). For a given pair of cells, the spikes from the first cell in one repeat, and the spikes from the second cell in another repeat, were used to calculate a CCF, and the average CCF was obtained across all possible combinations of repeats.
To summarize the peak cross-correlation (e.g. Fig. 2B), spikes were accumulated in 10 ms bins (Shlens et al. 2006) and the correlation coefficient at zero offset was computed. The dependence of this value on distance (e.g. Fig. 2B) was fitted with a function based on receptive field overlap, calculated as follows. For each cell type, the mean fitted receptive field diameter for all cells of that type was calculated. The diameter was defined as that of a circle occupying the same area as the 1 s.d. contour of the Gaussian fit. The receptive field overlap at a given distance was then computed using circularly symmetric Gaussian functions at that distance with 1 s.d. diameters equal to the mean diameters for the cell types. The overlap was defined as the inner product of the two Gaussian functions expressed as vectors, normalized by the square root of the product of their vector lengths. The amplitude of the curves was fitted independently to the data from each cell type combination. For pairs of cells of the same cell type, the amplitude was fitted to neighbouring cell pairs (black dots in Figs 2B and 3B). For pairs of cells of different types, the amplitude was fitted to pairs separated by <1 s.d.
When the waveforms of spikes produced by different neurons overlapped in time, the recorded voltage waveform differed from the waveform produced by either cell alone, in some cases causing precisely synchronized spikes from both cells to be missed in the spike identification procedure. To control for this effect, CCFs of all cell pairs were inspected, and cell pairs that exhibited obvious, sharp gaps in the CCF at zero time offset were excluded. To estimate the influence of imperfect spike sorting, the cross-correlation was computed with all cell pairs included. On average across all recordings, the correlation decreased by 8 ± 11% for cell type combinations with positive correlations, and increased by 3 ± 2% for combinations with negative correlations. The greatest impact occurred for combinations of ON parasol cells and ON midget cells (31 ± 12%), and OFF parasol and ON midget cells (5 ± 8%), respectively. Overall, 1.7 ± 1.2% of cell pairs were excluded.
For Figs 2 and 3 and Table 1 the recording duration ranged from 1200 to 3600 s (mean: ∼2100 s), and the spike rate was 9 ± 4 (7 ± 4, 7 ± 3, 5 ± 3, 10 ± 7) Hz for ON parasol (OFF parasol, ON midget, OFF midget, small bistratified) cells. In Fig. 2A (Fig. 3A) the average over 4–25 (3–18) cell pairs is presented with a mean number of 12 (8) cell pairs. Table 1 shows the average across 4–6 (3–4) recordings for the photopic (scotopic) stimulus conditions; cell type combinations with insufficient data for a given recording were excluded. In Fig. 4 data from one preparation and 18 (10) ON parasol (ON midget) cell pairs are presented. The recording duration ranged from 1200 to 1800 s (mean: ∼1600 s), and the spike rate was 8 ± 2 Hz (5 ± 2 Hz) for ON parasol (ON midget) cells. In Fig. 5 data from one preparation and 19 (24) ON parasol–ON parasol (ON parasol–OFF parasol) cell pairs are presented. The spike rate was 17 ± 5 Hz (11 ± 6 Hz) for ON parasol (OFF parasol) cells. Ten identical repeats of a 60 s stimulus sequence were used for the computation of the shift-corrected CCFs. As a control for stability, recordings of 1500 s in the presence of a constant stimulus were interleaved after each recording with a stimulus.
Table 1.
Average correlation strength within and across cell types
| ON parasol | OFF parasol | ON midget | OFF midget | Small bistratified | |
|---|---|---|---|---|---|
| Photopic | |||||
| ON parasol | 0.18 ± 0.05 | −0.04 ± 0.01 | 0.12 ± 0.03 | −0.01 ± 0 | 0.03 ± 0.02 |
| OFF parasol | 0.07 ± 0.05 | −0.03 ± 0.01 | 0.08 ± 0.04 | — | |
| ON midget | 0.03 ± 0 | −0.02 ± 0.01 | 0.02 ± 0.01 | ||
| OFF midget | 0.01 ± 0 | — | |||
| Small bistratified | 0.03 ± 0 | ||||
| Scotopic | |||||
| ON parasol | 0.18 ± 0.01 | −0.06 ± 0.02 | 0.20 ± 0.02 | −0.03 ± 0 | 0.10 ± 0.04 |
| OFF parasol | 0.08 ± 0.02 | −0.05 ± 0.02 | 0.10 ± 0.03 | −0.03 ± 0.01 | |
| ON midget | 0.09 ± 0.04 | −0.04 ± 0 | 0.06 ± 0.01 | ||
| OFF midget | 0.03 ± 0.01 | −0.01 ± 0 | |||
| Small bistratified | 0.02 ± 0 | ||||
Values are estimated from fits indicated by curves in Figs 2B and 3B. For cell pairs composed of different cell types, correlation strength is given at zero distance. For cell pairs composed of the same cell type, correlation strength is given at the normalized nearest neighbour distance (arrowhead on the abscissa). These estimates represent the amplitude of the strongest correlations typically observed between cells of the given types. The extrapolated theoretical correlation between cells of the same type at a distance of zero is approximately 2.7-fold higher that the value at a distance of 2 s.d.s, which is approximately the normalized nearest neighbour distance. Unreliable estimates were excluded (blank entries in table). Light levels: photopic, 830 (840, 440) P* (L (M, S) cone)−1 s−1; scotopic, 0.5–1.3 P* rod−1 s−1. Overall 54 ± 27% of the variance in correlation strength with distance was explained by the degree of receptive field overlap, with a range from 87% (ON parasol–ON parasol) to 27% (OFF midget–OFF midget).
Figure 4. CCFs across light levels for pairs of ON parasol cells and pairs of ON midget cells.
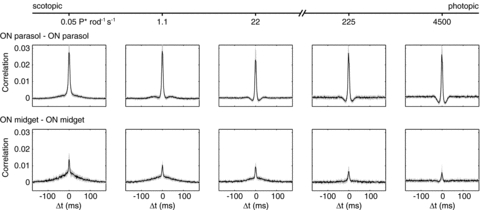
The light level increases from left to right. 4500 P* rod−1 s−1 corresponds to 1550 (1570, 740) P* (L (M, S) cone)−1 s−1. Bin size: 1 ms.
Figure 5. CCFs in the presence of stimuli with correlations of increasing spatial extent, for pairs of ON parasol cells and pairs of one ON and one OFF parasol cell.
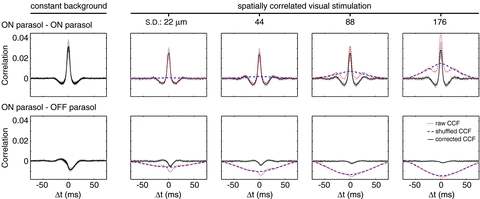
Left: CCFs of activity during constant illumination. Four CCFs are overlaid from recordings interleaved between recordings with visual stimulation. Right: CCFs in the presence of a time-varying stimulus (see text for details). Extent of spatial correlation in the stimulus is expressed as the standard deviation of the low-pass filter used to construct the stimuli. The mean ON parasol receptive field diameter was ∼140 μm. For each condition, the raw CCF, the CCF from shuffled identical stimulus repeats (shift predictor), and the difference between the two (corrected CCF) are shown. Grey shaded region represents 1 s.d. across cell pairs; for clarity this is only shown for the corrected CCF. Bin size: 1 ms.
Results
To probe the properties of correlated firing, extracellular recordings were obtained simultaneously from several hundred RGCs of identified types in segments of peripheral macaque monkey retina, using a custom 512-electrode array and recording system (Litke et al. 2004). To identify the cell type and response properties of recorded RGCs, spatio-temporal receptive fields were measured using reverse correlation with white noise stimuli (see Chichilnisky, 2001). The five numerically dominant RGC types could be identified based on their density and receptive field properties: ON and OFF midget, ON and OFF parasol, and small bistratified cells (Rodieck, 1998; Dacey, 2004; Field et al. 2007). In some experiments, two other cell types were also identified: OFF upsilon cells (Petrusca et al. 2007) and a wide-field ON cell type of similar density. The receptive fields of each identified cell type formed a regular mosaic covering the region of retina recorded (Devries & Baylor, 1997; Gauthier et al. 2009a). An example is shown for ON and OFF parasol cells in Fig. 1A.
To examine correlated activity generated in the retinal circuitry independently of a specified time-varying stimulus, spontaneous activity was recorded with the retina exposed to steady, spatially uniform illumination at a photopic light level. Correlations in the firing of pairs of cells were examined by inspecting the cross-correlation function (CCF) of the spontaneous activity (Fig. 1B). The CCF shows the correlation coefficient between spike trains, expressed as a function of a time shift imposed on one spike train with respect to the other. Statistically independent spike trains would exhibit a CCF of zero at all time offsets. Instead, for pairs of adjacent ON parasol cells (e.g. A and B), or pairs of adjacent OFF parasol cells (e.g. a and b), the CCF exhibited a substantial peak centred at the origin with a width of roughly ±5 ms, consistent with a tendency to fire synchronously (Shlens et al. 2006; Trong & Rieke, 2008). Pairs composed of one ON and one OFF parasol cell exhibited negative correlation: the probability of firing of one cell was reduced when the second cell fired (e.g. A and a). At larger distances, correlations were similar but weaker (e.g. A and C, A and c, a and c).
To examine the temporal structure of correlated firing, CCFs were summarized for each cell type combination. Figure 2A shows such a summary, for ON and OFF parasol, ON and OFF midget, small bistratified, OFF upsilon and unidentified wide-field ON cells. Average CCFs are shown for pairs of nearby cells of each available cell type combination. The particular cell pairs that comprised these averages were selected to highlight strong correlations and to exclude spike-sorting artifacts (see Methods). Some cell type combinations are not shown because insufficient data were available. For pairs of cells of two different types, the CCFs were selected from cells with highly overlapping receptive fields. For pairs of the same type, the mosaic organization of receptive fields (Fig. 1) implied that cells were never closer together than roughly two receptive field radii (see Devries & Baylor, 1997; Gauthier et al. 2009b), and CCFs were selected from cells that were immediate neighbours in the mosaic. In both cases, this selection approach represented the strongest correlated firing observed between cells of the given types.
Several major trends emerged in the patterns of correlated firing within and across cell types. First, pairs of cells of the same type always exhibited positive correlation, though the magnitude of correlation was different in different cell types. Second, ON cells exhibited positive correlation with ON cells of other types, while ON cells exhibited negative correlations with OFF cells of other types. Similar behaviour was observed for OFF cells. Note that in several cases the central peak in the CCF was flanked by dips below zero, and some CCFs between different cell types were asymmetric (see Discussion).
To characterize the spatial organization of correlated firing, the correlation coefficient at zero time offset was examined as a function of distance between the receptive fields of the cells, for the five major cell types (Fig. 2B). In all cases, the magnitude of correlated firing declined smoothly from a peak for the most closely spaced pairs to near zero at distances of 1–2 receptive field diameters, suggesting that correlations are mediated by local circuitry. For any given distance, the degree of correlated firing varied little across cells, suggesting highly stereotyped circuitry.
The spatial localization of correlations, and the correlations between cell types (e.g. midget and parasol) that share little circuitry beyond the photoreceptors, suggest that a significant contribution to correlated firing may be shared noise in cone photoreceptors (see Discussion). If this were true, the degree of correlated firing as a function of distance should be predictable from receptive field overlap. The curves in Fig. 2B show the overlap between spatial receptive fields as a function of the distance between them. The amplitudes of the curves were fitted independently to the data from each cell type combination (see Methods). These curves provided an adequate account of correlated firing. Table 1 provides a quantitative summary of the amplitudes of the curves. Note that the analysis was performed between small bistratified cells and other cell types, despite the fact that small bistratified cells receive dominant input from S cones while the other cell types receive dominant input from L and M cones (see Discussion).
To probe correlated firing in conditions in which visual signals are driven by rods, spontaneous activity was recorded at a scotopic light level. Figure 3A shows CCFs for the same cell types under these conditions. Three main trends emerge. First, prominent peaks and troughs similar to those visible in the CCFs at the photopic light level (Fig. 2A) were largely preserved, with similar dynamics, at the scotopic light level. Second, these peaks and troughs were superimposed on much broader peaks and troughs not observed at photopic light level. Third, the overall pattern of positive and negative correlations within and across cell types was similar to the results at the photopic light level. The pattern of correlated firing over space was also largely preserved. The curves in Fig. 3B show the correlation at zero time offset as a function of distance between cells. The trend is broadly similar to the results obtained at the photopic light level.
The broader CCFs at scotopic light levels, and the patterns across different ON and OFF cell types, suggest a significant contribution to correlated firing from shared noise or quantal events in rod photoreceptors (see Discussion). The curves in Fig. 3B show the predictions of the receptive field overlap model used in Fig. 2B, but with receptive fields measured at the scotopic light level. Again, these curves largely capture the dependence of correlated firing on distance, consistent with an origin in photoreceptor noise. A quantitative summary is given in Table 1.
To characterize the transition of correlations from scotopic to photopic light levels, spontaneous activity was measured as a function of light level. Figure 4 shows CCFs for pairs of ON parasol cells and for pairs of ON midget cells. At the lowest light level (0.05 photoisomerizations per rod per second (P* rod−1 s−1)), light responses are driven exclusively by the high-sensitivity rod pathway mediated by AII amacrine cells (Murphy & Rieke, 2006; Field et al. 2009). At the highest light level (4500 P* rod−1 s−1, and 1550, 1570 and 740 P* cone−1 s−1 for L, M and S cones, respectively), rods are saturated (Field et al. 2009). The threshold for cone vision is ∼100 P* rod−1 s−1 (Rodieck, 1998; Sharpe & Stockman, 1999). The disappearance of the broad correlation from scotopic to photopic light levels was graded with light level. The strength of the narrow correlation remained roughly constant as a function of light level.
If a significant source of spontaneous correlated firing is shared noise in cone photoreceptors (see Discussion), then these correlations might be expected to add to correlations induced by visual stimuli. A test of this possibility is shown in Fig. 5 for stimuli with spatial correlations of increasing extent. The fast correlations present in constant illumination (Fig. 5, left panel) are superimposed on a broader peak that grows with the spatial extent of correlations in the stimulus (raw CCF). CCFs between different repeats of the identical stimulus reveal the correlations induced by the stimulus alone (shuffled CCF, or shift predictor, see Methods). The difference between the raw CCF and the shuffled CCF reveals stimulus-independent correlations, under the assumption of additivity (corrected CCF). The corrected CCF is similar to the CCF of the spontaneous activity, though the magnitude of the former is lower, perhaps due to firing rate saturation. The mean corrected correlation strength for distant cell pairs falls to zero, as do the spontaneous correlations (data not shown).
Discussion
This study surveyed correlated firing among seven RGC types in macaque retina. The findings are broadly consistent with previous findings in non-primate species, but also provide clarifications and raise questions about mechanism.
Many of the present findings mirror seminal findings in the cat retina (Mastronarde, 1983a,b,c;) including: rapid correlated firing within several cell types at photopic light levels, positive correlations between cells of the same light response polarity, negative correlations between ON and OFF cells of several types, variation in correlation strength in different cell types, systematic decline in correlation with distance, and slow correlations at scotopic light levels. Previous findings in rabbit retina also highlighted the diversity of correlated firing between different cell types (DeVries, 1999).
A striking feature of the present results is the stereotyped degree of correlated firing in a given pair of cell types at a given distance, i.e. the small vertical scatter in each panel of Figs 2B and 3B (see Shlens et al. 2006). This precision is reminiscent of the exquisite precision of the mosaic organization of RGC receptive fields (Devries & Baylor, 1997; Gauthier et al. 2009a), suggesting that correlations are mediated by stereotyped local circuitry and perhaps even the same circuitry that forms the receptive fields. A hint of this precision was visible in previous work in cat retina (Mastronarde, 1983a) and rabbit retina (DeVries, 1999), but the large number of cell pairs obtained in the present work provide a more complete picture. This regularity would be difficult to observe if distinct cell types were not considered separately.
The present findings are largely consistent with the idea that shared photoreceptor noise contributes significantly to correlated firing in RGCs. First, correlations between midget and parasol cells suggest an origin in photoreceptors, because midget and parasol cells are known to receive input from different types of bipolar cells (Boycott & Wassle, 1991). Second, at both scotopic and photopic light levels, the dependence of correlated firing on distance was roughly proportional to receptive field overlap, and the overall pattern of correlations across cell types was preserved. A significant contribution of rod photoreceptor noise at scotopic light levels was indicated by previous work in cat retina relating the kinetics and statistics of correlations to quantal events in rods (Mastronarde, 1983b). At photopic light levels, previous work has argued against a substantial contribution of cone photoreceptor noise, based on the rapid kinetics of correlations compared to cone light responses (Mastronarde, 1983c; Brivanlou et al. 1998; DeVries, 1999). However, recent work in primate retina showed that RGC types with little shared circuitry other than cones exhibit correlations at photopic light levels, and that the kinetics of cone noise are sufficiently rapid to mediate correlations (Ala-Laurila P & Rieke F, unpublished observations).
Correlations inherited from shared photoreceptor noise are likely to be modified by the retinal circuitry and intrinsic properties of RGCs. For example, the timing of signal transmission in different circuits probably shapes the kinetics of correlations in different RGC types, and non-linearities in synaptic transmission and spike generation may further modify correlation structure. Also, differences in the spike-timing structure of different RGC types are likely to affect the observed CCFs. These factors may explain why CCFs are symmetric within a cell type but often asymmetric between cell types, and why CCFs involving wide-field cell types show structure offset from zero. Also, many CCFs exhibited flanking dips that are qualitatively consistent with a tendency for spikes in each cell to be separated from one another in time: if the firing of two cells is correlated, and the firing of each cell is followed by a reduction in its own firing probability, then the firing of each cell should be associated with reduced firing in the other cell earlier and later.
The broader CCFs at scotopic light levels are believed to originate from quantal noise events in rod photoreceptors (Mastronarde, 1983b). Surprisingly, fast correlations present at photopic light levels were also present at scotopic light levels, superimposed on the broader correlations arising from rod noise. Many studies have indicated that the rod signalling pathways are optimized for the transmission of signals representing the absorption of individual photons in rods, along with the required minimization of noise (see Field et al. 2005). In this context, it is surprising that a substantial component of the fast correlations, which may originate in cone noise, remains visible in RGCs, possibly degrading the fidelity of single photon responses. However, the scotopic experiments were performed in the presence of a dim background light, a condition in which retinal signalling may not be at its peak sensitivity. Furthermore, fast correlations exhibit a frequency structure different from the slow scotopic visual signal, and therefore may not present a serious problem. Note that the mixture of fast and slow correlations at scotopic light levels also complicates the interpretation of the receptive field overlap model fitted to the data in Fig. 3B.
Previous work in other species has provided evidence that mechanisms other than photoreceptor noise contribute to correlations, including gap junction coupling and diverging signals from interneurons (Mastronarde, 1983a,c; Brivanlou et al. 1998; DeVries, 1999). Indeed, two observations in the present work appear to reflect factors other than shared photoreceptor noise.
First, pairs of ON parasol, but not OFF parasol cells exhibited bimodal CCFs at a fine timescale (not shown), consistent with previous findings (Trong & Rieke, 2008; Shlens et al. 2008). This observation strongly suggests gap junction coupling, probably through intermediate amacrine cells (Dacey & Brace, 1992; Jacoby et al. 1996). The reciprocal coupling between ON parasol cells may contribute to the fact that receptive field overlap provided a slightly less accurate description of correlation as a function of distance than it did for other cell types (Fig. 2B). Reciprocal coupling probably accounts for less than a quarter of the area of the central peak of the CCFs of ON parasol cells (Trong & Rieke, 2008).
Second, small bistratified cells exhibited positive correlations with ON midget and ON parasol cells at photopic light levels. This seems potentially inconsistent with an origin in shared cone noise, because the ON component of the small bistratified cell light response is driven by short wavelength-sensitive (S) cones, whereas the light responses of ON parasol and ON midget cells are dominated by long and middle wavelength-sensitive (L and M) cones (Sun et al. 2006; Tailby et al. 2008; Field et al. 2010; but see Chatterjee 2002, Lee 2007). Indeed, L and M cones provide an OFF input to small bistratified cells (Dacey & Lee, 1994). One possible explanation is that strong amacrine cell input to small bistratified cells (Ghosh & Grunert, 1999) contributes to correlations with other cell types. At scotopic light levels, the additional slow correlations between small bistratified and other ON cell types are more easily explained because small bistratified cells, like midget and parasol cells, receive strong input from rods (Crook et al. 2009; Field et al. 2009).
In general, correlated activity between RGCs can be produced by a combination of two factors: shared noise arising in common circuitry such as shared photoreceptors, and shared signal arising from stimuli with spatial correlations. It is unclear whether these two sources of correlations combine independently in natural vision, or alternatively, whether the noise depends on the signal. In the present data, shared noise alone produced fast spontaneous correlations in nearby RGCs. The addition of stimuli with spatial correlations introduced slower correlations (Meister et al. 1995; DeVries, 1999; Pillow et al. 2008), in a roughly additive manner for weak stimuli (Fig. 5). Thus, measurements of spontaneous activity provide an approximate indication of noise correlations present in visual signals transmitted to the brain. However, signal and noise correlations were not additive for strong visual stimuli. This failure of additivity may reflect saturation in the spike rate at times of high (or low) firing probability, when it is unlikely that an added noise source could increase (or decrease) the firing rate. A test of this hypothesis would be to examine whether the correlations observed with and without visual stimuli are explained by models of light response in which stimulus and noise add, but a non-linearity in spike generation produces saturation. This would indicate the degree to which measurements of spontaneous correlations reveal the noise correlations present during natural vision.
The data presented here are largely consistent with a model in which RGCs that share cone photoreceptor input also share cone noise that produces correlated firing (Ala-Laurila P & Rieke F, unpublished observations). More distant RGCs that share fewer cones exhibit weaker correlations. Cone noise is modified by the specific retinal circuitry and intrinsic properties of each RGC type, giving rise to a distinct form of the CCF for each RGC type pair. Other sources of correlations, such as reciprocal coupling and diverging input from interneurons, play a smaller role. At scotopic light levels, slow correlations from quantal noise in rod photoreceptors add to the fast cone noise correlations. Finally, correlations induced by common visual stimulation are slower due to the dynamics of light response, and are superimposed on noise correlations observed in spontaneous activity.
Acknowledgments
This work was supported by a Pioneer Postdoctoral Fellowship Award (M.G.), NIH NRSA (NS054519-01) and Chapman Foundation (J.L.G.), Burroughs Wellcome Fund Career Award at Scientific Interface (A.S.), McKnight Foundation (A.M.L. and E.J.C.), NSF Grant PHY-0750525 (A.M.L.), a Sloan Research Fellowship, and NIH Grant EY13150 (E.J.C). J.S. is currently at Google, Inc., Mountain View, CA. We thank C. K. Hulse for technical assistance; M. I. Grivich, D. Petrusca, A. Grillo, P. Grybos, P. Hottowy and S. Kachiguine for technical development; H. Fox, M. Taffe, E. Callaway and K. Osborn for providing access to retinas; S. Barry for machining. We thank the San Diego Supercomputer Center and the NSF (Cooperative Agreements 05253071 and 0438741) for large-scale data storage. We thank Fred Rieke for valuable discussions.
Glossary
Abbreviations
- CCF
cross-correlation function
- RGCs
retinal ganglion cells
Author contributions
M.G., J.S. and E.J.C. conceived and designed the experiments. M.G., J.S., C.B., G.D.F., J.L.G., L.H.J., A.S. and E.J.C. collected the data. M.G., J.S., T.B. and E.J.C. analysed and interpreted the data. A.S. and A.M.L. provided and supported the large-scale multielectrode array system. M.G. and E.J.C. wrote the article. All authors approved the final version. Experiments were performed at the Salk Institute for Biological Studies, La Jolla, CA, USA.
References
- Arnett D. Statistical dependence between neighboring retinal ganglion cells in goldfish. Exp Brain Res. 1978;32:49–53. doi: 10.1007/BF00237389. [DOI] [PubMed] [Google Scholar]
- Boycott BB, Wassle H. Morphological classification of bipolar cells of the primate retina. Eur J Neurosci. 1991;3:1069–1088. doi: 10.1111/j.1460-9568.1991.tb00043.x. [DOI] [PubMed] [Google Scholar]
- Brivanlou IH, Warland DK, Meister M. Mechanisms of concerted firing among retinal ganglion cells. Neuron. 1998;20:527–539. doi: 10.1016/s0896-6273(00)80992-7. [DOI] [PubMed] [Google Scholar]
- Chatterjee S, Callaway EM. S cone contributions to the magnocellular visual pathway in macaque monkey. Neuron. 2002;35:1135–1146. doi: 10.1016/s0896-6273(02)00874-7. [DOI] [PubMed] [Google Scholar]
- Chichilnisky EJ. A simple white noise analysis of neuronal light responses. Network. 2001;12:199–213. [PubMed] [Google Scholar]
- Chichilnisky EJ, Kalmar RS. Functional asymmetries in ON and OFF ganglion cells of primate retina. J Neurosci. 2002;22:2737–2747. doi: 10.1523/JNEUROSCI.22-07-02737.2002. [DOI] [PMC free article] [PubMed] [Google Scholar]
- Crook JD, Davenport CM, Peterson BB, Packer OS, Detwiler PB, Dacey DM. Parallel ON and OFF cone bipolar inputs establish spatially coextensive receptive field structure of blue-yellow ganglion cells in primate retina. J Neurosci. 2009;29:8372–8387. doi: 10.1523/JNEUROSCI.1218-09.2009. [DOI] [PMC free article] [PubMed] [Google Scholar]
- Dacey DM. Origins of perception: retinal ganglion cell diversity and the creation of parallel visual pathways. In: Gazzaniga MS, editor. The Cognitive Neurosciences. Cambridge, MA, USA: MIT Press; 2004. pp. 281–301. [Google Scholar]
- Dacey DM, Brace S. A coupled network for parasol but not midget ganglion cells in the primate retina. Vis Neurosci. 1992;9:279–290. doi: 10.1017/s0952523800010695. [DOI] [PubMed] [Google Scholar]
- Dacey DM, Lee BB. The ‘blue-on’ opponent pathway in primate retina originates from a distinct bistratified ganglion cell type. Nature. 1994;367:731–735. doi: 10.1038/367731a0. [DOI] [PubMed] [Google Scholar]
- DeVries SH. Correlated firing in rabbit retinal ganglion cells. J Neurophysiol. 1999;81:908–920. doi: 10.1152/jn.1999.81.2.908. [DOI] [PubMed] [Google Scholar]
- DeVries SH, Baylor DA. Mosaic arrangement of ganglion cell receptive fields in rabbit retina. J Neurophysiol. 1997;78:2048–2060. doi: 10.1152/jn.1997.78.4.2048. [DOI] [PubMed] [Google Scholar]
- Drasdo N, Fowler CW. Non-linear projection of the retinal image in a wide-angle schematic eye. Br J Ophthalmol. 1974;58:709–714. doi: 10.1136/bjo.58.8.709. [DOI] [PMC free article] [PubMed] [Google Scholar]
- Field GD, Gauthier JL, Sher A, Greschner M, Machado TA, Jepson LH, Shlens J, Gunning DE, Mathieson K, Dabrowski W, Paninski L, Litke AM, Chichilnisky EJ. Functional connectivity in the retina at the resolution of photoreceptors. Nature. 2010;467:673–677. doi: 10.1038/nature09424. [DOI] [PMC free article] [PubMed] [Google Scholar]
- Field GD, Gauthier JL, Sher A, Greschner M, Machado T, Jepson LH, Shlens J, Gunning DE, Mathieson K, Dabrowski W, Paninski L, Litke AM, Chichilnisky EJ. Mapping a neural circuit: a complete input-output diagram in the primate retina. Nature. 2010 in press) [Google Scholar]
- Field GD, Greschner M, Gauthier JL, Rangel C, Shlens J, Sher A, Marshak DW, Litke AM, Chichilnisky EJ. High-sensitivity rod photoreceptor input to the blue-yellow color opponent pathway in macaque retina. Nat Neurosci. 2009;12:1159–1164. doi: 10.1038/nn.2353. [DOI] [PMC free article] [PubMed] [Google Scholar]
- Field GD, Sampath AP, Rieke F. Retinal processing near absolute threshold: from behavior to mechanism. Annu Rev Physiol. 2005;67:491–514. doi: 10.1146/annurev.physiol.67.031103.151256. [DOI] [PubMed] [Google Scholar]
- Field GD, Sher A, Gauthier JL, Greschner M, Shlens J, Litke AM, Chichilnisky EJ. Spatial properties and functional organization of small bistratified ganglion cells in primate retina. J Neurosci. 2007;27:13261–13272. doi: 10.1523/JNEUROSCI.3437-07.2007. [DOI] [PMC free article] [PubMed] [Google Scholar]
- Gauthier JL, Field GD, Sher A, Greschner M, Shlens J, Litke AM, Chichilnisky EJ. Receptive fields in primate retina are coordinated to sample visual space more uniformly. PLoS Biol. 2009a;7:e63. doi: 10.1371/journal.pbio.1000063. [DOI] [PMC free article] [PubMed] [Google Scholar]
- Gauthier JL, Field GD, Sher A, Shlens J, Greschner M, Litke AM, Chichilnisky EJ. Uniform signal redundancy of parasol and midget ganglion cells in primate retina. J Neurosci. 2009b;29:4675–4680. doi: 10.1523/JNEUROSCI.5294-08.2009. [DOI] [PMC free article] [PubMed] [Google Scholar]
- Ghosh KK, Grunert U. Synaptic input to small bistratified (blue-ON) ganglion cells in the retina of a new world monkey, the marmoset Callithrix jacchus. J Comp Neurol. 1999;413:417–428. doi: 10.1002/(sici)1096-9861(19991025)413:3<417::aid-cne5>3.0.co;2-h. [DOI] [PubMed] [Google Scholar]
- Hidaka S, Akahori Y, Kurosawa Y. Dendrodendritic electrical synapses between mammalian retinal ganglion cells. J Neurosci. 2004;24:10553–10567. doi: 10.1523/JNEUROSCI.3319-04.2004. [DOI] [PMC free article] [PubMed] [Google Scholar]
- Hu EH, Bloomfield SA. Gap junctional coupling underlies the short-latency spike synchrony of retinal alpha ganglion cells. J Neurosci. 2003;23:6768–6777. doi: 10.1523/JNEUROSCI.23-17-06768.2003. [DOI] [PMC free article] [PubMed] [Google Scholar]
- Jacoby RA, Stafford D, Kouyama N, Marshak D. Synaptic inputs to ON parasol ganglion cells in the primate retina. J Neurosci. 1996;16:8041–8056. doi: 10.1523/JNEUROSCI.16-24-08041.1996. [DOI] [PMC free article] [PubMed] [Google Scholar]
- Lee SC, Grunert U. Connections of diffuse bipolar cells in primate retina are biased against S-cones. J Comp Neurol. 2007;502:126–140. doi: 10.1002/cne.21284. [DOI] [PubMed] [Google Scholar]
- Litke AM, Bezayiff N, Chichilnisky EJ, Cunningham W, Dabrowski W, Grillo AA, Grivich M, Grybos P, Hottowy P, Kachiguine S, Kalmar RS, Mathieson K, Petrusca D, Rahman M, Sher A. What does the eye tell the brain? Development of a system for the large scale recording of retinal output activity. IEEE Trans Nucl Sci. 2004;51:1434–1440. [Google Scholar]
- Mastronarde DN. Correlated firing of cat retinal ganglion cells. I. Spontaneously active inputs to X- and Y-cells. J Neurophysiol. 1983a;49:303–324. doi: 10.1152/jn.1983.49.2.303. [DOI] [PubMed] [Google Scholar]
- Mastronarde DN. Correlated firing of cat retinal ganglion cells. II. Responses of X- and Y-cells to single quantal events. J Neurophysiol. 1983b;49:325–349. doi: 10.1152/jn.1983.49.2.325. [DOI] [PubMed] [Google Scholar]
- Mastronarde DN. Interactions between ganglion cells in cat retina. J Neurophysiol. 1983c;49:350–365. doi: 10.1152/jn.1983.49.2.350. [DOI] [PubMed] [Google Scholar]
- Meister M. Multineuronal codes in retinal signaling. Proc Natl Acad Sci U S A. 1996;93:609–614. doi: 10.1073/pnas.93.2.609. [DOI] [PMC free article] [PubMed] [Google Scholar]
- Meister M, Lagnado L, Baylor DA. Concerted signaling by retinal ganglion cells. Science. 1995;270:1207–1210. doi: 10.1126/science.270.5239.1207. [DOI] [PubMed] [Google Scholar]
- Murphy GJ, Rieke F. Network variability limits stimulus-evoked spike timing precision in retinal ganglion cells. Neuron. 2006;52:511–524. doi: 10.1016/j.neuron.2006.09.014. [DOI] [PMC free article] [PubMed] [Google Scholar]
- Nirenberg S, Carcieri SM, Jacobs AL, Latham PE. Retinal ganglion cells act largely as independent encoders. Nature. 2001;411:698–701. doi: 10.1038/35079612. [DOI] [PubMed] [Google Scholar]
- Perkel DH, Gerstein GL, Moore GP. Neuronal spike trains and stochastic point processes. II. Simultaneous spike trains. Biophys J. 1967;7:419–440. doi: 10.1016/S0006-3495(67)86597-4. [DOI] [PMC free article] [PubMed] [Google Scholar]
- Perry VH, Cowey A. The ganglion cell and cone distributions in the monkey's retina: implications for central magnification factors. Vision Res. 1985;25:1795–1810. doi: 10.1016/0042-6989(85)90004-5. [DOI] [PubMed] [Google Scholar]
- Petrusca D, Grivich MI, Sher A, Field GD, Gauthier JL, Greschner M, Shlens J, Chichilnisky EJ, Litke AM. Identification and characterization of a Y-like primate retinal ganglion cell type. J Neurosci. 2007;27:11019–11027. doi: 10.1523/JNEUROSCI.2836-07.2007. [DOI] [PMC free article] [PubMed] [Google Scholar]
- Pillow JW, Shlens J, Paninski L, Sher A, Litke AM, Chichilnisky EJ, Simoncelli EP. Spatio-temporal correlations and visual signalling in a complete neuronal population. Nature. 2008;454:995–999. doi: 10.1038/nature07140. [DOI] [PMC free article] [PubMed] [Google Scholar]
- Puchalla JL, Schneidman E, Harris RA, Berry MJ. Redundancy in the population code of the retina. Neuron. 2005;46:493–504. doi: 10.1016/j.neuron.2005.03.026. [DOI] [PubMed] [Google Scholar]
- Rieke F, Warland D, de Ruyter van Steveninck RR, Bialek W. Spikes: Exploring the Neural Code. Cambridge, MA, USA: MIT Press; 1997. [Google Scholar]
- Rodieck RW. Maintained activity of cat retinal ganglion cells. J Neurophysiol. 1967;30:1043–1071. doi: 10.1152/jn.1967.30.5.1043. [DOI] [PubMed] [Google Scholar]
- Rodieck RW. The First Steps in Seeing. Sunderland, MA, USA: Sinauer; 1998. [Google Scholar]
- Schnapf JL, Nunn BJ, Meister M, Baylor DA. Visual transduction in cones of the monkey Macaca fascicularis. J Physiol. 1990;427:681–713. doi: 10.1113/jphysiol.1990.sp018193. [DOI] [PMC free article] [PubMed] [Google Scholar]
- Schneidman E, Berry MJ, Segev R, Bialek W. Weak pairwise correlations imply strongly correlated network states in a neural population. Nature. 2006;440:1007–1012. doi: 10.1038/nature04701. [DOI] [PMC free article] [PubMed] [Google Scholar]
- Schnitzer MJ, Meister M. Multineuronal firing patterns in the signal from eye to brain. Neuron. 2003;37:499–511. doi: 10.1016/s0896-6273(03)00004-7. [DOI] [PubMed] [Google Scholar]
- Sharpe LT, Stockman A. Rod pathways: the importance of seeing nothing. Trends Neurosci. 1999;22:497–504. doi: 10.1016/s0166-2236(99)01458-7. [DOI] [PubMed] [Google Scholar]
- Shlens J, Field GD, Gauthier JL, Greschner M, Sher A, Litke AM, Chichilnisky EJ. The structure of large-scale synchronized firing in primate retina. J Neurosci. 2009;29:5022–5031. doi: 10.1523/JNEUROSCI.5187-08.2009. [DOI] [PMC free article] [PubMed] [Google Scholar]
- Shlens J, Field GD, Gauthier JL, Grivich MI, Petrusca D, Sher A, Litke AM, Chichilnisky EJ. The structure of multi-neuron firing patterns in primate retina. J Neurosci. 2006;26:8254–8266. doi: 10.1523/JNEUROSCI.1282-06.2006. [DOI] [PMC free article] [PubMed] [Google Scholar]
- Shlens J, Rieke F, Chichilnisky E. Synchronized firing in the retina. Curr Opin Neurobiol. 2008;18:396–402. doi: 10.1016/j.conb.2008.09.010. [DOI] [PMC free article] [PubMed] [Google Scholar]
- Sun H, Smithson HE, Zaidi Q, Lee BB. Specificity of cone inputs to macaque retinal ganglion cells. J Neurophysiol. 2006;95:837–849. doi: 10.1152/jn.00714.2005. [DOI] [PMC free article] [PubMed] [Google Scholar]
- Tailby C, Szmajda BA, Buzas P, Lee BB, Martin PR. Transmission of blue (S) cone signals through the primate lateral geniculate nucleus. J Physiol. 2008;586:5947–5967. doi: 10.1113/jphysiol.2008.161893. [DOI] [PMC free article] [PubMed] [Google Scholar]
- Trong PK, Rieke F. Origin of correlated activity between parasol retinal ganglion cells. Nat Neurosci. 2008;11:1343–1351. doi: 10.1038/nn.2199. [DOI] [PMC free article] [PubMed] [Google Scholar]
- Usrey WM, Reppas JB, Reid RC. Paired-spike interactions and synaptic efficacy of retinal inputs to the thalamus. Nature. 1998;395:384–387. doi: 10.1038/26487. [DOI] [PubMed] [Google Scholar]