

Abstract
Osteoblasts and adipocytes are derived from common mesenchymal progenitor cells. The bone loss of osteoporosis is associated with altered progenitor differentiation from an osteoblastic to an adipocytic lineage. cDNA microarrays and quantitative real-time PCR (Q-PCR) were carried out in a differentiating mouse stromal osteoblastic cell line, Kusa 4b10, to identify gene targets of factors that stimulate osteoblast differentiation including parathyroid hormone (PTH) and gp130-binding cytokines, oncostatin M (OSM) and cardiotrophin-1 (CT-1). Zinc finger protein 467 (Zfp467) was rapidly down-regulated by PTH, OSM, and CT-1. Retroviral overexpression and RNA interference for Zfp467 in mouse stromal cells showed that this factor stimulated adipocyte formation and inhibited osteoblast commitment compared with controls. Regulation of adipocyte markers, including peroxisome proliferator-activated receptor (PPAR) γ, C/EBPα, adiponectin, and resistin, and late osteoblast/osteocyte markers (osteocalcin and sclerostin) by Zfp467 was confirmed by Q-PCR. Intra-tibial injection of calvarial cells transduced with retroviral Zfp467 doubled the number of marrow adipocytes in C57Bl/6 mice compared with vector control-transduced cells, providing in vivo confirmation of a pro-adipogenic role of Zfp467. Furthermore, Zfp467 transactivated a PPAR-response element reporter construct and recruited a histone deacetylase complex. Thus Zfp467 is a novel co-factor that promotes adipocyte differentiation and suppresses osteoblast differentiation. This has relevance to therapeutic interventions in osteoporosis, including PTH-based therapies currently available, and may be of relevance for the use of adipose-derived stem cells for tissue engineering.
Keywords: Adipocyte, Bone, Bone marrow, Gene Regulation, Microarray, PPARγ, Parathyroid Hormone, Glycoprotein-130, Histone Deacetylase, Osteoblast
Introduction
Osteoblasts and adipocytes are derived from a common subpopulation of mesenchymal stem cell (MSC)4 progenitors. MSC lineage commitment is dependent on the expression of key transcription factors that, on induction, initiate a cascade of events culminating in cellular differentiation and development. Among the transcription factors regulated, osteoblast differentiation requires expression of Runx2 (1, 2) to commit progenitors to preosteoblasts, with Osterix (3), ATF4 (4), and AP-1 (5) promoting their transition to functional osteoblasts. Alternately, adipocytic differentiation requires expression of different key regulators, peroxisome proliferator-activated receptor γ (PPARγ) (6) and members of the CCAAT/enhancer-binding protein family (C/EBPs) (7).
Because osteoblasts and adipocytes are derived from common progenitors, lineage determination of precursor cells to osteoblasts results in a proportional decrease in adipogenesis. This inverse relationship is observed clinically; an increase in marrow adiposity is associated with age-related osteoporosis (8) and conditions that induce bone loss, such as ovariectomy (9) and immobilization (10). Conversely, high bone mass due to increased osteoblast commitment is associated with reduced adipocyte differentiation (5). The molecular mechanisms by which lineage commitment is regulated and the plasticity of these cells to transdifferentiate between the two lineages remains to be fully defined. Understanding the relationship between osteoblasts and adipocytes and the relationship of its dysregulation to bone loss will provide key information required to improve treatments for skeletal disorders.
Intermittent administration of parathyroid hormone (PTH) and PTH-related protein (PTHrP) enhances bone mass (11) in part by promoting the differentiation of committed osteoblast precursors (12), decreasing osteoblast apoptosis (13), and decreasing production of sclerostin by osteocytes (14). PTH treatment is also associated with reduced adipocyte generation (15). Further evidence of reciprocal regulation of osteoblast and adipocyte differentiation by PTH and PTHrP is the low bone volume, reduced osteoprogenitor recruitment, and increased marrow adiposity in mice haploinsufficient for PTHrP (16, 17).
PTH treatment of osteoblasts also stimulates production of cytokines that signal through the receptor subunit glycoprotein 130 (gp130) and enhances gp130 expression itself (18, 19). The gp130-signaling cytokines OSM and CT-1 have been reported to have similar effects on bone formation to PTH in that they stimulate osteoblast differentiation and inhibit adipogenesis (20, 21). Mice null for OSM receptor or CT-1 demonstrated impaired bone formation and high marrow adiposity (20, 21). gp130-signaling cytokines may therefore play a role in the effects of PTH on osteoblast and adipocyte commitment.
In searching for genes induced by PTH that may be involved in anabolic mechanisms, we investigated mRNA expression profiles of mouse stromal osteoblastic cells in response to treatment with PTH-(1–34) (22). We focused on immediate-early response genes that commonly encode for regulatory proteins, because PTH stimulation of bone formation is achieved in part through the rapid and transient induction of these genes (23, 24). This genome-wide approach led to the identification of zinc finger protein 467 (Zfp467), expression of which was inhibited by PTH and the gp130 signaling cytokines OSM and CT-1. Our investigation of Zfp467 as a putative regulator of stromal cell differentiation has identified this protein as a potential co-factor in transcriptional regulation that directs bipotential stromal cells and primary osteoblasts to differentiate along the adipocytic rather than osteoblastic lineage.
EXPERIMENTAL PROCEDURES
Cell Culture
Novel transcriptional targets regulated by PTH(1–34) (10 nm; Bubendorf) were identified from a previously described Affymetrix whole genome microarray (22) using the clonal murine bone marrow-derived stromal cell line Kusa 4b10 (25). Kusa 4b10 cells were maintained in α-MEM with 10% fetal bovine serum (FBS). Differentiation of Kusa 4b10 was performed as previously described (25). Briefly, cells were subcultured at 3000 cells/cm2 and after 72 h, medium was replaced with osteoblast differentiating (α-MEM + 15% heat-inactivated FBS + ascorbic acid (50 μg/ml; Sigma) or with adipogenic medium (α-MEM with 15% heat-inactivated FBS), insulin (6.6 × 10⁻⁸ m; Novo Nordisk), 3-isobutyl-1-methylxanthine (2.5 × 10⁻¹⁰ m; Sigma), and dexamethasone (10−8 m; Sigma). For mineralization studies, β-glycerophosphate (10 mm Sigma) was added to osteoblast differentiation medium. Medium was replaced three times per week. For microarray validation experiments, Kusa 4b10 were serum starved (2% FBS) on day 16 of differentiation for 18 h prior to treatment with the indicated doses of PTH(1–34) (10 nm), and mouse CT-1 or mouse OSM (50 ng/ml; R&D Systems) for the times indicated. Mouse primary osteoblasts were prepared by enzymatic digestion of calvariae of newborn wild-type (WT) C57BL/6 mice (1–2 days old) (20, 21). Mineralized nodules were stained by von Kossa with 3% silver nitrate and fixation with 0.1% sodium thiosulfate. Mineralized area was quantified using ImageJ 1.36 (National Institutes of Health). Adipogenesis was assessed by Oil red O staining solubilized in isopropyl alcohol (25) and measured at 515 nm.
Quantitative Real-time PCR
Total RNA was extracted using TRIzol® Reagent (Invitrogen) followed by treatment with DNase (Ambion) or using RNasy Mini Kit (Qiagen) according to the manufacturer's instructions. cDNA was synthesized from 2–5 μg of RNA using random primers and SuperScript III (Invitrogen) as previously described (20). Q-PCR was performed using SYBR Green (Molecular Probes) with specific oligonucleotide primers (Sigma) (22) in the MX3000P® system (Stratagene) (20). Gene expression was normalized to hypoxanthine-guanine phosphoribosyltransferase (HPRT1).
Retroviral Vectors and Retrovirus Production
An MSCV-based retroviral construct containing a green fluorescent protein (GFP) (gift of Dr. David Izon, St. Vincent's Institute of Medical Research) (26) was modified by insertion of mouse Zfp467 cDNA (BC029859, MGC:35888, IMAGE: 4457967) in a sense and antisense orientation into the multiple cloning site (Fig. 1D). The sense strand was cloned by XhoI/HpaI ligation and the antisense strand by XhoI/EcoRI. Retroviral supernatants were prepared from Phoenix E cells using FuGENE 6 reagent (Roche Applied Science). Cells were transfected at 70% confluence with plasmid DNA containing empty vector, sense or antisense Zfp467 cDNA with FuGENE 6 at a 3:1 to DNA. Medium was replaced 16–24 h post-transfection with fresh medium and cultured at 32 °C to enhance retroviral titer. Retroviral supernatants were collected 48 h post-transfection, filtered, and stored at −80 °C until required. Target murine cells were infected with retroviral supernatant (50% v/v) + Polybrene (8 μg/ml, Sigma). Cells were transduced by spinfectin (27) and incubated for 24 h. Fresh growth medium was added to cells or another round of spinfection was performed after 24 h to increase transduction efficiency. Retroviral titers were quantified in NIH-3T3 fibroblastic cells (ATCC). All titers were ∼1 × 10⁶ colony-forming units/ml. Infected cells were analyzed for GFP expression by fluorescence microscopy (data not shown) and sorted using FACsAria (BD Biosciences) (data not shown). Transduction efficiencies in NIH-3T3 cells were >60% for vector, >45% sense Zfp467, and >25% for antisense Zfp467. Similar results were achieved in Kusa 4b10 cells. Levels of retroviral integration, assessed by FACS for GFP, remained constant over a 21-day time course of Kusa 4b10 cell differentiation.
FIGURE 1.

Regulation of Zfp467 by PTH and gp130-binding cytokines and Zfp467 retroviral construction. Q-PCR for Zfp467 on (A) day 17 osteoblast-differentiated Kusa 4b10 cells and (B) day 9 differentiated primary calvarial osteoblasts (mPOB) treated without or with PTH(1–34) for 1, 6, and 24 h. C, Q-PCR for Zfp467 on Kusa 4b10 cells osteoblast differentiated for 17 days and treated with 50 ng/ml of oncostatin-M (OSM), cardiotrophin-1 (CT-1) or untreated for 1, 6, and 24 h. Results are mean fold-change ± S.E. of ≥3 independent experiments; *, p < 0.05; **, p < 0.01; ***, p < 0.001, compared with untreated control. Representation of Zfp467 retroviral constructs: D, MSCV-IRES-GFP vector control; E, MSCV-sense Zfp467-IRES-GFP vector; F, MSCV-antisense Zfp467-IRES-GFP vector. LTR, long terminal repeats; IRES, internal ribosomal entry site; GFP, enhanced green fluorescence protein reporter gene. G, Zfp467 mRNA levels during 21 days of osteoblast differentiation. Results are mean fold-change ± S.E. of 3 independent experiments; *, p < 0.05; **, p < 0.01; ***, p < 0.001, compared with vector control. H, Western blot analysis of Kusa 4b10 cells untreated or transduced with MSCV-IRES-GFP vector, MSCV-sense Zfp467-IRES-GFP, and MSCV-antisense Zfp467-IRES-GFP probed with anti-Zfp467. Mouse Pan-actin was used as a loading control. Data in panel G are mean ± S.E. of 3 independent transductions. Symbols are defined in the figure. Standard error bars indicated, or within symbols.
RNA Interference
Transient transfections were completed using Lipofectamine 2000 (Invitrogen) according to the manufacturer's instructions. Briefly, Kusa 4b10 cells were untreated or transfected at 30–50% confluence using LipofectamineTM 2000 with 20 pmol of StealthTM RNAi oligomer (MSS250457, 5′-CCUGCACCGAAUGCGAGAAACGUUU-3′; from a set of 3 by Invitrogen) or with a duplex scrambled control (medium GC; Invitrogen) in a 24-well plate. Medium was changed from Opti-MEM I (Invitrogen) after 4–6 h to growth medium and incubated at 37 °C until testing.
Antibody Production and Western Blot Analysis
The protein sequence for Zfp467 (NP065614) was analyzed for antigenic properties using the GenScripts Optimum-AntigenTM design program. The peptide selected, RVHDAASRTRSSPDC, was homologous to all Zfp467 variants. A cysteine residue was added to the C terminus of the peptide and conjugated to keyhole limpet hemocyanin. The custom rabbit polyclonal antibody was produced by GenScript. Protein lysates were prepared as previously described (21). Briefly, Kusa 4b10 cells were lysed in a RIPA buffer containing protease inhibitor mixture (Sigma), sonicated, and centrifuged to remove cell debris. Ten to twenty μg of protein was resolved on 12% gradient gel (NuPAGE; Invitrogen) and transferred using a semi-dry system prior to probing with antibodies to Zfp467 (Genscript) and mouse Pan-actin (MS-1295-P0; Lab Vision Corp.). Optical densities of bands were quantified using ImageJ 1.36 and normalized to Pan-actin.
In Vivo Experiments
All animal experiments were approved by St. Vincent's Health, Animal Ethics Committee prior to commencement of the study. Primary calvarial osteoblasts were isolated from calvariae of 1–2-day-old newborn WT C57BL/6 mice (20, 21). Cells were untreated or transduced 24 h after seeding with retroviral supernatant containing either empty vector or sense Zfp467 construct by two rounds of spinfection. After 48 h, cells were harvested by trypsinization (0.25% trypsin, 0.02% EDTA) and medium containing 10% FBS was added; the cells were then washed three times by centrifugation in serum-free α-MEM and subsequently resuspended in 1× PBS (Invitrogen) and kept on ice until use (0–2 h). Four-week-old mice received intra-tibial inoculation of empty vector or Zfp467 sense cells (final concentration 2.5 × 10⁵ cells/10 μl) and the other limb was inoculated with PBS alone for comparison as previously described (28). Tissues were collected after lethal anesthesia at days 7 and 21 post-inoculation. For day 7 samples, tibiae were dissected and used to isolate RNA using a RNA lipid tissue kit (Qiagen) according to the manufacturer's instructions. For day 21 samples, tibiae were harvested, fixed, and paraffin-embedded for histological examination as previously described (28). Serial sections were stained with hematoxylin and eosin (H/E).
Luciferase Reporter Assays
Reporter plasmids containing the consensus binding site for the PPARγ/RxRα heterodimer (PPAR-response element) inserted into pGL3 basic vector (Promega) (29) were transiently co-transfected into ST2 marrow-derived stromal cells (ATCC), without or with pcDNA3-PPARγ (29) or pCMV-sport6 Zfp467 (Invitrogen) constructs. ST2 cells were seeded into a 12-well plate in α-MEM + 10% FBS and transfected at 80% confluence using Lipofectamine 2000 according to the manufacturer's instructions for 24 h. Luciferase activity was determined using the dual-luciferase reporter assay system (Promega) and luminescence was read (BMG Labtech). As a reference plasmid to normalize transfection efficiency 15 ng of pRL-CMV plasmid (Promega) was co-transfected in all experiments.
Histone Deacetylase (HDAC) Activity
HDAC activity was measured using the HDAC Fluorescent Assay/Drug Discovery Kit (BIOMOL) according to the manufacturer's instructions. Briefly, whole cell extracts prepared from human embryonic kidney 293T cells (ATCC) transiently transfected using Lipofectamine 2000 with pCDNA3 vector or pCDNA3-Zfp467-FLAG tag in 100-mm2 plates were immunoprecipitated with anti-FLAG M2 affinity gel (Sigma) after 24 h incubation. Immunoprecipitates were incubated with the substrate for 37 °C for 15 min. Following incubation, the reaction was stopped and the fluorescence measured at 360 nm. HeLa nuclear extracts were used as the positive control.
Osteoclast Formation Assay
Co-cultures to generate osteoclast formation were performed as previously described (21). Osteoclasts were generated from bone marrow macrophage precursors by co-culturing them in the presence of Kusa 4b10 cells cultured in α-MEM + 10% FBS and 1,25(OH)2D3 (10 nm; Wako Pure Chemicals). Medium was changed at day 3 and cultures were stained on day 7 for tartrate-resistant acid phosphatase (TRAP+) (21). Data are presented as the average number of TRAP+ multinucleated cells (small, 2 to 4 nuclei, or large, 5 or more nuclei).
Statistical Analysis
Statistically significant differences were determined using Student's t test or two-way analysis of variance followed by post hoc analysis with p values adjusted with Bonferroni's correction after establishing for normal distribution of data using GraphPad Prism 5.0a. A p value of less than 0.05 was considered significant. All values are presented as the mean ± S.E. unless stated otherwise.
RESULTS
Suppression of Zfp467 mRNA by PTH and gp130 Cytokines
Microarray analysis revealed that Zfp467 mRNA was down-regulated 1.5-fold by 10 nm PTH(1–34) at 1 and 6 h. Validation experiments using Q-PCR in differentiated Kusa 4b10 cells and calvarial osteoblasts confirmed that PTH(1–34) suppressed Zfp467 mRNA levels at 1 h and levels returned to basal by 6 h (Fig. 1, A and B); this occurred in a dose-dependent manner with a maximal effect at 10 ng/ml (data not shown). Because gp130 cytokines CT-1 and OSM stimulate bone formation and inhibit adipogenesis (20, 21) their ability to affect Zfp467 mRNA levels in Kusa 4b10 cells was assessed. Zfp467 mRNA levels were significantly suppressed by CT-1 and OSM compared with untreated controls (Fig. 1C). A shorter time course revealed Zp467 mRNA to be suppressed by OSM by 2 h (data not shown).
Increased Expression of Zfp467 Delays Osteoblast Differentiation
To delineate the role of Zfp467 in osteoblast differentiation, secondary functional studies were performed using a retroviral overexpression system (Fig. 1, D-F). Kusa 4b10 cells were used due to their ability to differentiate along either the osteoblast or adipogenic lineage (25). Kusa 4b10 were untreated or transduced with empty vector, sense or antisense Zfp467 cDNA before being cultured under mineralizing conditions. Q-PCR analysis revealed that total Zfp467 mRNA levels were significantly elevated in cells overexpressing sense Zfp467 cDNA and significantly reduced when antisense Zfp467 cDNA was overexpressed compared with controls (Fig. 1G). No difference was observed between untreated and vector controls. Similarly, Zfp467 protein levels, analyzed by Western blot, were increased by sense Zfp467 and decreased by antisense Zfp467 cDNA overexpression compared with both untreated and vector controls (Fig. 1H).
von Kossa staining confirmed that retroviral integration per se did not affect the mineralization capacity of the Kusa 4b10 cells (Fig. 2A). However, cells transfected with the antisense Zfp467 construct produced more mineral than vector-infected cells from 13 days onwards. In contrast, cells overexpressing sense Zfp467 formed significantly less nodules than vector-infected cells by day 15, and this effect was only enhanced by day 17. Furthermore, overexpression of sense Zfp467 suppressed expression of intermediate and late markers of osteoblast differentiation including PTH receptor-1, osteocalcin, and sclerostin compared with vector-infected control cells (Fig. 2B). In contrast, antisense Zfp467 enhanced expression of these factors (Fig. 2B). Runx2 and Osterix mRNA expression were not changed (data not shown). These results were consistent with the altered mineralization and suggest that Zfp467 delays osteoblast differentiation.
FIGURE 2.

Zfp467 overexpression inhibits mineralization and expression of late osteoblast marker genes. A, representative von Kossa staining and quantification of nodule formation on days 13, 15, and 17 of osteoblast differentiating Kusa 4b10 cells infected with vector, sense, or antisense Zfp467 constructs. B, gene expression analysis for PTH receptor-1 (PTHR1), osteocalcin (OCN), and sclerostin (SOST) mRNA in osteoblast-differentiating Kusa 4b10 infected with vector, sense, or antisense Zfp467 constructs. Results are mean ± S.E. for 3 independent experiments; *, p < 0.05; **, p < 0.01; ***, p < 0.001, compared with vector control. Symbols are defined in the figure.
Interestingly, even though cells were cultured in conditions that favored osteoblast differentiation, a large number of adipocytes were observed in wells containing cells overexpressing sense Zfp467 (Fig. 3A). We therefore examined adipocyte marker gene expression. Although no significant changes were observed with antisense Zfp467, we observed a clear induction of adipogenic genes by overexpression of sense Zfp467. PPARγ, C/EBPα, adiponectin, and resistin were enhanced more than 2-fold by sense Zfp467 compared with vector control (Fig. 3B). Zfp467 therefore appears to promote adipogenic differentiation at the expense of osteoblast formation even under conditions that favor the latter. The difference between the effectiveness of the sense and antisense Zfp467 construct at regulating gene expression may be due to the efficacy of retroviral transduction. The titer, and therefore the infection and integration rates, of the antisense Zfp467 construct was significantly lower than the titer of both the empty vector and sense Zfp467 constructs, as assessed by flow cytometry based on GFP expression levels (data not shown). Consequently, we utilized RNA interference (RNAi) in subsequent studies.
FIGURE 3.

Zfp467 overexpression increased adipocyte formation during Kusa 4b10 differentiation under mineralizing conditions. A, representative images of Oil red O staining at days 9 and 11 of Kusa 4b10 differentiation. B, gene expression levels for adipocyte marker genes including PPARγ, C/EBPα, adiponectin, and resistin mRNA by Q-PCR. Results are mean fold-change ± S.E. of 3 independent experiments; *, p < 0.05; **, p < 0.01; ***, p < 0.001 versus vector control. Symbols are defined in the figure. Standard error bars indicated, or within symbols.
Increased Zfp467 Enhances the Osteoclast-supporting Ability of Stromal Cells
Because early osteoblast progenitor cells and adipocytes promote osteoclast differentiation (30–32) the production of factors affecting osteoclast differentiation was assessed in sense and antisense Zfp467 overexpressing cells cultured under mineralizing (Fig. 4A) and adipogenic (Fig. 4B) conditions. Q-PCR analysis showed mRNA for receptor activator of NFκB ligand (RANKL) was significantly elevated and osteoprotegerin (OPG) mRNA levels were lowered by overexpression of sense Zfp467 early in differentiation. In contrast, antisense Zfp467 did not significantly modify these genes compared with untreated and vector controls. This pattern of gene regulation induced by sense Zfp467 suggested that Zfp467 might enhance the ability of osteoblastic cells to support osteoclast formation. Therefore the ability of Kusa 4b10 cells under- and overexpressing Zfp467 to support osteoclast differentiation of bone marrow macrophages was examined. Overexpression of sense Zfp467 enhanced osteoclast formation and increased the number of nuclei in TRAP+ osteoclasts formed in co-culture. In contrast, Kusa 4b10 cells with antisense Zfp467 had reduced ability to support osteoclast formation, and the osteoclast nuclear number was reduced relative to controls (Fig. 4, C and D).
FIGURE 4.

Zfp467 overexpression enhanced the osteoclast supporting ability of Kusa 4b10 cells. A, RANKL and OPG mRNA expression in differentiating Kusa 4b10 cells under mineralizing (A) or adipogenic conditions (B) by Q-PCR. Results are mean fold-change ± S.E. of 3 independent experiments; *, p < 0.05; **, p < 0.01; ***, p < 0.001, compared with vector control. C, representative images of tartrate-resistant acid phosphatase positive (TRAP+) multinucleated cells (MNC) formed from bone marrow cells co-cultured with Zfp467 construct-transduced Kusa 4b10 cells and treated with 1,25-(OH)2D3 (10−8 m) for 7 days. D, quantification of TRAP+ multinucleated cells with 2–4 and ≥5 nuclei per cell after 7 days of treatment with 1,25-(OH)2D3 (10−8 m). Results are mean ± S.E. of ≥3 independent experiments; *, p < 0.05; **, p < 0.01; ***, p < 0.001 versus vector control. Symbols are defined in the figure. Standard error bars indicated, or within symbols.
Increased Zfp467 Accelerates Adipocyte Differentiation
To delineate the role of Zfp467 in cell lineage commitment preferencing, adipogenic differentiation assays were conducted. When cells were cultured under adipogenic conditions, sense Zfp467 overexpression produced significantly more adipocytes after 4 days of culture, as indicated by Oil red O staining (Fig. 5A). This difference was confirmed on counting the number of adipocytes and solubilization and quantification of the Oil red O stain (Fig. 5, B and C). As observed under osteoblastic conditions, the increased adipocyte formation rate was associated with elevated mRNA levels for PPARγ, C/EBPα, adiponectin, and resistin (Fig. 5D).
FIGURE 5.

Zfp467 overexpression accelerates adipocyte formation in Kusa 4b10 cells under adipogenic conditions. A, representative Oil red O staining of adipocytes on days 4 and 7 of Kusa 4b10 cells; B, the number of Oil red O stained adipocytes per mm2; C, measured levels of solubilized Oil red O during adipogenic differentiation of Kusa 4b10 cells infected with vector, sense, and antisense Zfp467 constructs. Values are mean ± S.E. of ≥3 independent experiments; ***, p < 0.001 versus vector control completed in triplicate. D, the mRNA levels of adipocyte marker genes including PPARγ, C/EBPα, adiponectin, and resistin in Kusa 4b10 cells infected with vector, sense, and antisense Zfp467 constructs over 11 days of adipogenic differentiation analyzed by Q-PCR. Results are mean fold-changes ± S.E. of 3 independent experiments; *, p < 0.05; **, p < 0.01; ***, p < 0.001, compared with vector control. Symbols are defined in the figure. Standard error bars indicated, or within symbols.
This pro-adipogenic influence of Zfp467 was confirmed by gene silencing using RNAi. Efficacy of the RNAi to knockdown Zfp467 in Kusa 4b10 cells was confirmed by Q-PCR that showed an 80% reduction in mRNA transcripts by day 2 (Fig. 6A). Furthermore, Western blot analysis 48 h post-transfection confirmed decreased Zfp467 protein levels (Fig. 6B). Oil red O staining demonstrated a significant delay in adipocyte formation in cells transfected with Zfp467 RNAi (Fig. 6C) and Q-PCR revealed suppressed PPARγ, C/EBPα, and adiponectin levels compared with scrambled control (Fig. 6D). This confirmed that gene silencing of Zfp467 was sufficient to decrease the rate of adipocyte formation.
FIGURE 6.

Gene knockdown of Zfp467 by RNAi in differentiating Kusa 4b10 cells under adipogenic medium. A, Q-PCR analysis for Zfp467 mRNA levels during Kusa 4b10 differentiation. Results are mean fold-change ± S.E. of 3 independent experiments; ***, p < 0.001, compared with scrambled control. B, representative Western blot analysis of Kusa 4b10 cell lysates untreated or transfected with scrambled duplex control or Zfp467 interfering RNA (RNAi) and fold-change in Zfp467 band density normalized to Pan-actin. Results are mean fold-change ± S.E. of 3 independent experiments. Protein membranes were probed with anti-Zfp467 and mouse Pan-actin as a loading control. C, representative samples of Oil red O staining in Kusa 4b10 cells untreated and transfected with scrambled duplex control and Zfp467 RNAi and measured levels of solubilized Oil Red O over 11 days of culture; values are mean ± S.E. of ≥3 independent experiments; **, p < 0.01; ***, p < 0.001 versus vector control. D, Q-PCR for adipogenic marker genes PPARγ, C/EBPα, and adiponectin during Kusa 4b10 differentiation. Results are mean ± S.E. of 3 independent experiments; *, p < 0.05; **, p < 0.01; ***, p < 0.001, compared with scrambled control. Symbols are defined in the figure. Standard error bars indicated, or within symbols.
Zfp467 Transactivates the PPARγ Response Element
Because the effects of over- and underexpression of Zfp467 resulted in changes to osteoblast and osteoclasts resembling those resulting from similar modifications of PPARγ (33), we considered whether Zfp467 might directly regulate PPARγ expression. We therefore examined whether Zfp467 could transactivate the PPARγ promoter. Co-transfection of Zfp467 cDNA with a luciferase reporter plasmid containing the consensus binding site for the PPARγ/RxRα heterodimer (PPAR-response element) (29) significantly increased the expression and transactivation function of the PPAR-response element (Fig. 7A), indicating a mechanism by which Zfp467 promotes lineage commitment of progenitor cells to adipocytes over osteoblasts.
FIGURE 7.
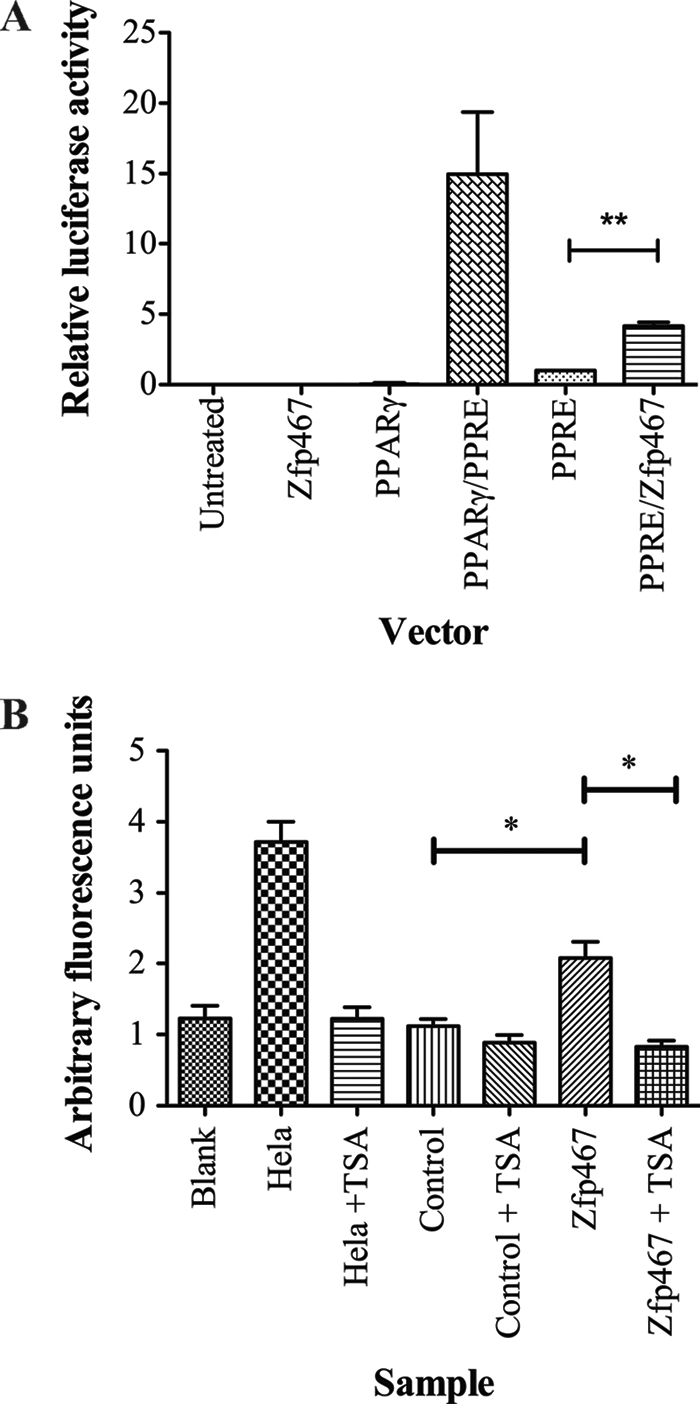
PPARγ-promoter transactivation and recruitment of HDAC complex by Zfp467. A, relative luciferase activity from ST2 cells transiently co-transfected with a reporter construct containing the PPAR-response element (PPRE), without or with pCDNA3-PPARγ, vector control, or Zfp467 cDNA. Results are mean ± S.E. of 3 independent experiments conducted in triplicate; **, p < 0.01 compared with reporter vectors and their respective controls. Firefly luciferase values are normalized for Renilla luciferase. B, deacetylation activity of Zfp467-FLAG immunoprecipitates from transient expression assays in HEK293T cells, and attenuation of this activity by the HDAC inhibitor, TSA. HeLa nuclear extracts were used as the positive control. Results are mean ± S.E. of 4 independent experiments; *, p < 0.05 compared with vector control. Standard error bars indicated.
Zfp467 Recruits a Histone Deacetylase Complex
Histone modification activity assays were carried out to investigate whether Zfp467 may employ epigenetic mechanisms to alter stromal cell differentiation. No change in the activity of histone methyltransferase, histone demethyltransferease, and histone acetytransferase was found (data not shown). HDAC activity was significantly increased from Zfp467 immunoprecipitates when compared with vector control (Fig. 7B). In support, the organic compound trichostatin A (TSA) selectively inhibited the class I and II HDAC families. This result indicates that Zfp467 may function in a HDAC associated co-repressor type complex to suppress target gene transcription.
Increased Zfp467 Enhances Adipocyte Formation in Vivo
The in vitro data established that elevated levels of Zfp467 conferred preference for marrow stromal precursor cells to differentiate to adipocytes rather than osteoblasts. To confirm this role of Zfp467 in an in vivo system, primary calvarial cells including osteoblast lineage cells at early to late differentiation stages (34) were injected into tibiae of 4-week-old C57Bl/6 mice. These cells were transduced with either vector control or sense Zfp467 containing constructs. Intra-tibial injection methods have been used successfully to study age-related bone diseases including osteoporosis, and the ability of donor cells to proliferate and survive in recipient bone marrow following intra-tibial injections has been confirmed in previous studies (35, 36). The presence of introduced calvarial cells was confirmed 7 days post-inoculation by Q-PCR for empty vector or transgenic Zfp467 transcripts (Fig. 8A). At day 21 post-inoculation, quantification of adipocytes revealed a significant increase in both their number and volume in the marrow space of tibiae injected with calvarial cells transduced with sense Zfp467 cDNA compared with those that received vector control cells (Fig. 8B). Although we exclude a contribution from surrounding host cells, this indicated that enhancing Zfp467 expression in vivo is capable of stimulating adipocyte differentiation.
FIGURE 8.

Intra-tibial injection of calvarial cells transduced with Zfp467 enhances adipocyte formation. A, gene expression analysis of RNA from tibiae injected with primary calvarial cells transduced with sense Zfp467, vector, or PBS vehicle using primers to the MigR1 vector sequence and Zfp467 transgene. B, representative hematoxylin and eosin-stained tibial sections and quantification of adipocyte number and volume, 2 weeks after tibiae were injected with calvarial cells transduced with sense Zfp467 cDNA compared with vector control cells. Data are mean ± S.E., n ≥ 8 animals per group. *, p < 0.05; **, p < 0.01 versus PBS and vector control. Standard error bars indicated.
DISCUSSION
Zfp467 was originally isolated from mouse hematogenic endothelial LO cells as an OSM-inducible mRNA (37). The protein Zfp467 (also known as EZI) belongs to the Krüppel-like family of transcription factors (KLF) consisting of 12 repeats of C2H2-type zinc finger motifs (37). KLFs have been implicated in controlling cellular proliferation, differentiation, and development (38) and are known to bind GC-rich sequences, basal regulatory factors, or associated factors to control target gene transcription (39). Zfp467 is expressed ubiquitously and is thought to play a role in general cellular function (37). Our data now establishes that Zfp467 mRNA expression in stromal cells is suppressed by both PTH and gp130-signaling cytokines OSM and CT-1, factors known to stimulate bone formation (20, 40–46).
Zfp467 overexpression in Kusa 4b10 stromal cells stimulated bipotential precursor cells to differentiate toward the adipocyte over the osteoblast lineage, even under culture conditions that promote osteoblast differentiation. These changes correlated with delayed expression of intermediate to late osteoblastic marker genes including PTH receptor 1, osteocalcin, and sclerostin, enhanced expression of adipocytic marker genes including PPARγ and C/EBPα, and activation of the PPARγ response element. Induction of PPARγ is essential for adipogenesis, and the effects of PPARγ on adipocyte formation are gene-dose dependent (6, 47, 48). Heterozygote PPARγ-deficient mice exhibit decreased adipocyte numbers and high bone mass as a consequence of increased osteoblastogenesis by bone marrow progenitors (33). This was associated with reduced osteoblastic marker gene expression, illustrating the reciprocal relationship between osteoblasts and adipocytes. In addition, PPARγ null embryonic stem cells failed to form adipocytes but differentiated into osteoblasts without osteogenic supplementation, and reintroduction of the gene by retroviral transduction rescued the phenotype (33). Interestingly, mice with deletion of PPARγ in hematopoietic and endothelial lineages developed osteopetrosis due to impaired osteoclast differentiation (49). The role of Zfp467 in altering lineage preference of bipotential precursor cells was supported in vivo when intra-tibial injection of calvarial cells transduced with retroviral-expressed Zfp467 enhanced adipocyte formation.
Overexpression of sense Zfp467 also enhanced the osteoclast supporting ability of Kusa 4b10 cells in vitro, with osteoclast formation in co-cultures increasing both in size and number. Q-PCR confirmed elevated levels of RANKL and lower levels of OPG mRNA expression early in differentiating Kusa 4b10 cells. The reverse was observed when Zfp467 was knocked-down by antisense cDNA. Because RANKL is an essential factor for the differentiation of osteoclasts and OPG blocks the activity of RANKL, these changes alone may explain the enhanced ability of Zfp467 overexpressing cells to support osteoclast formation. It is possible that the enhanced osteoclastogenic support may also relate to the influence of Zfp467 on adipogenesis thereby holding the osteoblast in a less differentiated state. More primitive osteoblasts have been reported to better support osteoclast formation than more mature osteoblasts because they have higher levels of RANKL and relatively lower levels of osteoclast inhibitors including OPG, GM-CSF, and interleukin-18 (32, 50).
Because Zfp467 can interact with other transcription factors to regulate their activity (37), we studied the ability of Zfp467 to act as a co-factor in transcriptional regulation of adipogenesis. We found that transactivation of a reporter construct containing the consensus-binding site for the PPARγ/RxRα heterodimer response element was enhanced when co-transfected with Zfp467 cDNA. This indicates a possible mechanism by which Zfp467 promotes adipocyte formation. Other zinc finger transcription factors have also been reported to regulate PPARγ gene expression by either co-activating (Zfp423 (51), KLF5 (52), and KLF15 (53)) or co-repressing transcription (KLF2 (54) and KLF7 (55)). Mice null for Zfp423 or KLF5 have impaired white adipocyte differentiation and decreased PPARγ expression, revealing a critical role for these proteins in adipocyte formation (51, 52, 56). Overexpression of KLF5 or KLF15 induced adipocyte differentiation in vitro, whereas dominant-negative forms of KLF5 or KLF15 inhibited adipocyte formation by modifying PPARγ expression (52, 53). These studies demonstrate that multiple KLFs are induced sequentially during adipocyte differentiation and suggest they may work in concert to regulate adipocyte differentiation. Further studies, however, are required to elucidate the relationship of these factors to Zfp467.
Accumulating evidence suggests that epigenetic mechanisms involving post-translational and covalent modifications of histones on chromatin may be a central mechanism controlling gene transcription. Histone modifications can be altered during cell lineage determination and in response to changes in the extracellular environment (57). Our investigations demonstrate that Zfp467 can recruit a HDAC associated co-repressor complex to suppress target gene transcription. This was confirmed by use of the HDAC inhibitor TSA that blocked the repressor effect of Zfp467 overexpression. This reveals a potential epigenetic mechanism that Zfp467 may utilize to delay osteoblastic differentiation sufficiently to allow cells to divert to the adipocytic lineage. Alternately, it may promote transdifferentiation. Further studies are required to identify the HDAC co-repressor complex Zfp467 associates with and its target genes.
Several other zinc finger protein transcription factors have been reported to interact with HDAC co-repressor complexes to suppress target gene transcription. These include Snail (58), Slug (59, 60), acute promyelocytic leukemia-associated PLZF protein (60), and zinc finger repressor-89 (ZBP89) (61). The effects of HDAC inhibitors on bone formation have been investigated. Suppression of HDAC activity by TSA treatment early in osteoblast differentiation promoted their differentiation and maturation by accelerating the appearance of osteoblast-specific genes in MC3T3-E1 pre-osteoblastic cells (62). Similarly early treatment with TSA in human bone marrow stromal cells increased osteogenic differentiation by up-regulating marker gene expression (63). TSA treatment has also been reported to inhibit osteoclast formation in vitro and in vivo (64).
The consequence of Zfp467 over- and underexpression resembles those of the same manipulations of PPARγ. Lineage changes similar to those observed in the present study are also reported in aged or diseased bone where bone loss is associated with an alteration of the mesenchymal progenitor cell population from an osteoblastic to an adipocytic phenotype (65). Several strain-specific and knock-out murine models have investigated the reciprocal relationship between osteoblast and adipocyte formation. A connection between age-related bone loss due to low bone remodeling osteoporosis was associated with significant increases in marrow fat infiltration, using the inbred albino Louvain rats, as a model of healthy aging (66). The senescence accelerated mouse-P6 also demonstrated low bone turnover osteopenia due to decreased osteoblastogenesis with a parallel increase in adipogenesis, a phenotype that may result from reduced expression of the gp130-cytokine interleukin-11 (IL-11) (67–69). In the present study, Zfp467 mRNA expression was not altered by IL-11 treatment (data not shown), and IL-11 receptor knock-out mice do not demonstrate reciprocal adipocyte and osteoblast differentiation (70). Zfp467 expression was attenuated by CT-1 and OSM. Both CT-1 and OSMR knock-out mice demonstrate low bone turnover and enhanced adipogenesis raising the possibility that altered regulation of Zfp467 may be involved in the phenotypes of these mice (20, 21).
Zfp467 has been identified as an enriched nuclear protein in quiescent leukemic hematopoietic stem cells, implicating Zfp467 as a regulator of hematopoietic stem cell function (71) in addition to the role we have identified in MSC differentiation. In support of Zfp467 playing a role in hematopoiesis, a search for diabetes susceptibility genes found the protein to be a positive regulator of T cell selection in the thymus (71) and thereby associating Zfp467 in T-cell survival and maturation, because defective negative selection for T cell receptor with low self affinity can result in autoimmune diabetes (72–74). Additionally, Zfp467 was up-regulated by thyroid hormone and characterized as a thyroid hormone-responsive gene in TtT-97 tumors (75) and in mouse pre-neuronal Neuro2a cells (76), suggesting a role in regulating thyrotrope cell function. These studies have revealed diverse roles for Zfp467, reflecting its ubiquitous expression.
Our studies and those discussed above have identified Zfp467 as a regulator of osteoblast and adipocyte differentiation, key processes in the maintenance and function of bone structure and the bone marrow microenvironment, which includes cells from hematopoietic, osteoblast, and adipogenic origins. Homeostasis of this microenvironment is essential as an imbalance favoring one cell type can affect the regulation and function of the other (77). Therefore Zfp467 may play a fundamental role in bone and blood-related disorders.
Acknowledgment
We thank Dr. David Izon (SVIMR) for the MSCV-retroviral vector.
This work was supported in part by National Health and Medical Research Council (Australia) Program Grant 345401 (to M. T. G., N. A. S., and T. J. M.).
- MSC
- mesenchymal stem cell
- PPAR
- proliferator-activated receptor
- PTH
- parathyroid hormone
- PTHrP
- PTH-related protein
- Zfp467
- zinc finger protein 467
- α-MEM
- α-minimal essential medium
- HDAC
- histone deacetylase
- TRAP+
- tartrate-resistant acid phosphatase
- OPG
- osteoprotegerin
- TSA
- trichostatin A
- KLF
- Krüppel-like family
- Q-PCR
- quantitative real-time polymerase chain reaction
- pan
- pantothenate.
REFERENCES
- 1. Komori T., Yagi H., Nomura S., Yamaguchi A., Sasaki K., Deguchi K., Shimizu Y., Bronson R. T., Gao Y. H., Inada M., Sato M., Okamoto R., Kitamura Y., Yoshiki S., Kishimoto T. (1997) Cell 89, 755–764 [DOI] [PubMed] [Google Scholar]
- 2. Otto F., Thornell A. P., Crompton T., Denzel A., Gilmour K. C., Rosewell I. R., Stamp G. W., Beddington R. S., Mundlos S., Olsen B. R., Selby P. B., Owen M. J. (1997) Cell 89, 765–771 [DOI] [PubMed] [Google Scholar]
- 3. Nakashima K., Zhou X., Kunkel G., Zhang Z., Deng J. M., Behringer R. R., de Crombrugghe B. (2002) Cell 108, 17–29 [DOI] [PubMed] [Google Scholar]
- 4. Yang X., Matsuda K., Bialek P., Jacquot S., Masuoka H. C., Schinke T., Li L., Brancorsini S., Sassone-Corsi P., Townes T. M., Hanauer A., Karsenty G. (2004) Cell 117, 387–398 [DOI] [PubMed] [Google Scholar]
- 5. Sabatakos G., Sims N. A., Chen J., Aoki K., Kelz M. B., Amling M., Bouali Y., Mukhopadhyay K., Ford K., Nestler E. J., Baron R. (2000) Nat. Med. 6, 985–990 [DOI] [PubMed] [Google Scholar]
- 6. Barak Y., Nelson M. C., Ong E. S., Jones Y. Z., Ruiz-Lozano P., Chien K. R., Koder A., Evans R. M. (1999) Mol. Cell 4, 585–595 [DOI] [PubMed] [Google Scholar]
- 7. Tanaka T., Yoshida N., Kishimoto T., Akira S. (1997) EMBO J. 16, 7432–7443 [DOI] [PMC free article] [PubMed] [Google Scholar]
- 8. Justesen J., Stenderup K., Ebbesen E. N., Mosekilde L., Steiniche T., Kassem M. (2001) Biogerontology 2, 165–171 [DOI] [PubMed] [Google Scholar]
- 9. Martin R. B., Chow B. D., Lucas P. A. (1990) Calcif. Tissue Int. 46, 189–194 [DOI] [PubMed] [Google Scholar]
- 10. Ahdjoudj S., Lasmoles F., Holy X., Zerath E., Marie P. J. (2002) J. Bone Miner. Res. 17, 668–677 [DOI] [PubMed] [Google Scholar]
- 11. Horwitz M. J., Tedesco M. B., Gundberg C., Garcia-Ocana A., Stewart A. F. (2003) J. Clin. Endocrinol. Metab. 88, 569–575 [DOI] [PubMed] [Google Scholar]
- 12. Dobnig H., Turner R. T. (1995) Endocrinology 136, 3632–3638 [DOI] [PubMed] [Google Scholar]
- 13. Manolagas S. C. (2000) Endocr. Rev. 21, 115–137 [DOI] [PubMed] [Google Scholar]
- 14. van Bezooijen R. L., Roelen B. A., Visser A., van der Wee-Pals L., de Wilt E., Karperien M., Hamersma H., Papapoulos S. E., ten Dijke P., Löwik C. (2004) J. Exp. Med. 199, 805–814 [DOI] [PMC free article] [PubMed] [Google Scholar]
- 15. Rickard D. J., Wang F. L., Rodriguez-Rojas A. M., Wu Z., Trice W. J., Hoffman S. J., Votta B., Stroup G. B., Kumar S., Nuttall M. E. (2006) Bone 39, 1361–1372 [DOI] [PubMed] [Google Scholar]
- 16. Amizuka N., Karaplis A. C., Henderson J. E., Warshawsky H., Lipman M. L., Matsuki Y., Ejiri S., Tanaka M., Izumi N., Ozawa H., Goltzman D. (1996) Dev. Biol. 175, 166–176 [DOI] [PubMed] [Google Scholar]
- 17. Miao D., He B., Jiang Y., Kobayashi T., Sorocéanu M. A., Zhao J., Su H., Tong X., Amizuka N., Gupta A., Genant H. K., Kronenberg H. M., Goltzman D., Karaplis A. C. (2005) J. Clin. Investig. 115, 2402–2411 [DOI] [PMC free article] [PubMed] [Google Scholar]
- 18. Greenfield E. M., Gornik S. A., Horowitz M. C., Donahue H. J., Shaw S. M. (1993) J. Bone Miner. Res. 8, 1163–1171 [DOI] [PubMed] [Google Scholar]
- 19. Romas E., Udagawa N., Zhou H., Tamura T., Saito M., Taga T., Hilton D. J., Suda T., Ng K. W., Martin T. J. (1996) J. Exp. Med. 183, 2581–2591 [DOI] [PMC free article] [PubMed] [Google Scholar]
- 20. Walker E. C., McGregor N. E., Poulton I. J., Pompolo S., Allan E. H., Quinn J. M., Gillespie M. T., Martin T. J., Sims N. A. (2008) J. Bone Miner. Res. 23, 2025–2032 [DOI] [PubMed] [Google Scholar]
- 21. Walker E. C., McGregor N. E., Poulton I. J., Solano M., Pompolo S., Fernandes T. J., Constable M. J., Nicholson G. C., Zhang J. G., Nicola N. A., Gillespie M. T., Martin T. J., Sims N. A. (2010) J. Clin. Investig. 120, 582–592 [DOI] [PMC free article] [PubMed] [Google Scholar]
- 22. Allan E. H., Häusler K. D., Wei T., Gooi J. H., Quinn J. M., Crimeen-Irwin B., Pompolo S., Sims N. A., Gillespie M. T., Onyia J. E., Martin T. J. (2008) J. Bone Miner. Res. 23, 1170–1181 [DOI] [PubMed] [Google Scholar]
- 23. Onyia J. E., Bidwell J., Herring J., Hulman J., Hock J. M. (1995) Bone 17, 479–484 [DOI] [PubMed] [Google Scholar]
- 24. Onyia J. E., Helvering L. M., Gelbert L., Wei T., Huang S., Chen P., Dow E. R., Maran A., Zhang M., Lotinun S., Lin X., Halladay D. L., Miles R. R., Kulkarni N. H., Ambrose E. M., Ma Y. L., Frolik C. A., Sato M., Bryant H. U., Turner R. T. (2005) J. Cell. Biochem. 95, 403–418 [DOI] [PubMed] [Google Scholar]
- 25. Allan E. H., Ho P. W., Umezawa A., Hata J., Makishima F., Gillespie M. T., Martin T. J. (2003) J. Cell. Biochem. 90, 158–169 [DOI] [PubMed] [Google Scholar]
- 26. Persons D. A., Allay J. A., Allay E. R., Ashmun R. A., Orlic D., Jane S. M., Cunningham J. M., Nienhuis A. W. (1999) Blood 93, 488–499 [PubMed] [Google Scholar]
- 27. Pear W. S., Cepko C. (1996) in Current Protocols in Molecular Biology (Ausubel F. M., Brent R., Kingston R. E., Moore D. D., Seidman J. G., Smith J. A., Struhl K. eds) pp. 9.9.1, Suppl. 36, Wiley, New York [Google Scholar]
- 28. Fisher J. L., Schmitt J. F., Howard M. L., Mackie P. S., Choong P. F., Risbridger G. P. (2002) Cell Tissue Res. 307, 337–345 [DOI] [PubMed] [Google Scholar]
- 29. Suzawa M., Takada I., Yanagisawa J., Ohtake F., Ogawa S., Yamauchi T., Kadowaki T., Takeuchi Y., Shibuya H., Gotoh Y., Matsumoto K., Kato S. (2003) Nat. Cell Biol. 5, 224–230 [DOI] [PubMed] [Google Scholar]
- 30. Hozumi A., Osaki M., Goto H., Sakamoto K., Inokuchi S., Shindo H. (2009) Biochem. Biophys. Res. Commun. 382, 780–784 [DOI] [PubMed] [Google Scholar]
- 31. Kelly K. A., Tanaka S., Baron R., Gimble J. M. (1998) Endocrinology 139, 2092–2101 [DOI] [PubMed] [Google Scholar]
- 32. Takagi K., Kudo A. (2008) J. Bone Miner. Metab. 26, 13–23 [DOI] [PubMed] [Google Scholar]
- 33. Akune T., Ohba S., Kamekura S., Yamaguchi M., Chung U. I., Kubota N., Terauchi Y., Harada Y., Azuma Y., Nakamura K., Kadowaki T., Kawaguchi H. (2004) J. Clin. Investig. 113, 846–855 [DOI] [PMC free article] [PubMed] [Google Scholar]
- 34. Martin T. J., Ng K. W., Partridge N. C., Livesey S. A. (1987) Methods Enzymol. 145, 324–336 [DOI] [PubMed] [Google Scholar]
- 35. Ueda Y., Inaba M., Takada K., Fukui J., Sakaguchi Y., Tsuda M., Omae M., Kushida T., Iida H., Ikehara S. (2007) Stem Cells 25, 1356–1363 [DOI] [PubMed] [Google Scholar]
- 36. Kushida T., Inaba M., Hisha H., Ichioka N., Esumi T., Ogawa R., Iida H., Ikehara S. (2001) Blood 97, 3292–3299 [DOI] [PubMed] [Google Scholar]
- 37. Nakayama K., Kim K. W., Miyajima A. (2002) EMBO J. 21, 6174–6184 [DOI] [PMC free article] [PubMed] [Google Scholar]
- 38. Ganss B., Jheon A. (2004) Crit. Rev. Oral Biol. Med. 15, 282–297 [DOI] [PubMed] [Google Scholar]
- 39. Smale S. T., Kadonaga J. T. (2003) Annu. Rev. Biochem. 72, 449–479 [DOI] [PubMed] [Google Scholar]
- 40. Lowe C., Cornish J., Callon K., Martin T. J., Reid I. R. (1991) J. Bone Miner. Res. 6, 1277–1283 [DOI] [PubMed] [Google Scholar]
- 41. Malaval L., Liu F., Vernallis A. B., Aubin J. E. (2005) J. Cell. Physiol. 204, 585–593 [DOI] [PubMed] [Google Scholar]
- 42. Sims N. A., Walker E. C., McGregor N. E., Poulton I. J., Gillespie M. T., Martin T. J. (2007) Bone 40, S126 [Google Scholar]
- 43. Sims N. A., Walker E. C., McGregor N. E., Saleh H., Quinn J. M., Gillespie M. T., Martin T. J. (2007) Bone 40, S153 [Google Scholar]
- 44. Walker E. C., McGregor N. E., Poulton I. J., Solano M., Zhang J., Nicola N. A., Gillespie M. T., Martin T. J., Sims N. A. (2009) Bone 44, S32 [Google Scholar]
- 45. Song H. Y., Jeon E. S., Kim J. I., Jung J. S., Kim J. H. (2007) J. Cell. Biochem. 101, 1238–1251 [DOI] [PubMed] [Google Scholar]
- 46. Song H. Y., Kim M. R., Lee M. J., Jeon E. S., Bae Y. C., Jung J. S., Kim J. H. (2007) Int. J. Biochem. Cell Biol. 39, 439–449 [DOI] [PubMed] [Google Scholar]
- 47. Kershaw E. E., Flier J. S. (2004) J. Clin. Endocrinol. Metab. 89, 2548–2556 [DOI] [PubMed] [Google Scholar]
- 48. Rosen E. D., Sarraf P., Troy A. E., Bradwin G., Moore K., Milstone D. S., Spiegelman B. M., Mortensen R. M. (1999) Mol. Cell 4, 611–617 [DOI] [PubMed] [Google Scholar]
- 49. Wan Y., Chong L. W., Evans R. M. (2007) Nat. Med. 13, 1496–1503 [DOI] [PubMed] [Google Scholar]
- 50. Udagawa N., Horwood N. J., Elliott J., Mackay A., Owens J., Okamura H., Kurimoto M., Chambers T. J., Martin T. J., Gillespie M. T. (1997) J. Exp. Med. 185, 1005–1012 [DOI] [PMC free article] [PubMed] [Google Scholar]
- 51. Gupta R. K., Arany Z., Seale P., Mepani R. J., Ye L., Conroe H. M., Roby Y. A., Kulaga H., Reed R. R., Spiegelman B. M. (2010) Nature 464, 619–623 [DOI] [PMC free article] [PubMed] [Google Scholar]
- 52. Oishi Y., Manabe I., Tobe K., Tsushima K., Shindo T., Fujiu K., Nishimura G., Maemura K., Yamauchi T., Kubota N., Suzuki R., Kitamura T., Akira S., Kadowaki T., Nagai R. (2005) Cell Metab. 1, 27–39 [DOI] [PubMed] [Google Scholar]
- 53. Mori T., Sakaue H., Iguchi H., Gomi H., Okada Y., Takashima Y., Nakamura K., Nakamura T., Yamauchi T., Kubota N., Kadowaki T., Matsuki Y., Ogawa W., Hiramatsu R., Kasuga M. (2005) J. Biol. Chem. 280, 12867–12875 [DOI] [PubMed] [Google Scholar]
- 54. Banerjee S. S., Feinberg M. W., Watanabe M., Gray S., Haspel R. L., Denkinger D. J., Kawahara R., Hauner H., Jain M. K. (2003) J. Biol. Chem. 278, 2581–2584 [DOI] [PubMed] [Google Scholar]
- 55. Kanazawa A., Kawamura Y., Sekine A., Iida A., Tsunoda T., Kashiwagi A., Tanaka Y., Babazono T., Matsuda M., Kawai K., Iiizumi T., Fujioka T., Imanishi M., Kaku K., Iwamoto Y., Kawamori R., Kikkawa R., Nakamura Y., Maeda S. (2005) Diabetologia 48, 1315–1322 [DOI] [PubMed] [Google Scholar]
- 56. Shindo T., Manabe I., Fukushima Y., Tobe K., Aizawa K., Miyamoto S., Kawai-Kowase K., Moriyama N., Imai Y., Kawakami H., Nishimatsu H., Ishikawa T., Suzuki T., Morita H., Maemura K., Sata M., Hirata Y., Komukai M., Kagechika H., Kadowaki T., Kurabayashi M., Nagai R. (2002) Nat. Med. 8, 856–863 [DOI] [PubMed] [Google Scholar]
- 57. Wu R. C., Smith C. L., O'Malley B. W. (2005) Endocr. Rev. 26, 393–399 [DOI] [PubMed] [Google Scholar]
- 58. Peinado H., Ballestar E., Esteller M., Cano A. (2004) Mol. Cell. Biol. 24, 306–319 [DOI] [PMC free article] [PubMed] [Google Scholar]
- 59. Tripathi M. K., Misra S., Khedkar S. V., Hamilton N., Irvin-Wilson C., Sharan C., Sealy L., Chaudhuri G. (2005) J. Biol. Chem. 280, 17163–17171 [DOI] [PMC free article] [PubMed] [Google Scholar]
- 60. David G., Alland L., Hong S. H., Wong C. W., DePinho R. A., Dejean A. (1998) Oncogene 16, 2549–2556 [DOI] [PubMed] [Google Scholar]
- 61. Wu Y., Zhang X., Salmon M., Zehner Z. E. (2007) Genes Cells 12, 905–918 [DOI] [PubMed] [Google Scholar]
- 62. Schroeder T. M., Westendorf J. J. (2005) J. Bone Miner. Res. 20, 2254–2263 [DOI] [PubMed] [Google Scholar]
- 63. Cho H. H., Park H. T., Kim Y. J., Bae Y. C., Suh K. T., Jung J. S. (2005) J. Cell. Biochem. 96, 533–542 [DOI] [PubMed] [Google Scholar]
- 64. Kim H. N., Ha H., Lee J. H., Jung K., Yang D., Woo K. M., Lee Z. H. (2009) Eur. J. Pharmacol. 623, 22–29 [DOI] [PubMed] [Google Scholar]
- 65. Justesen J., Stenderup K., Eriksen E. F., Kassem M. (2002) Calcif. Tissue Int. 71, 36–44 [DOI] [PubMed] [Google Scholar]
- 66. Duque G., Rivas D., Li W., Li A., Henderson J. E., Ferland G., Gaudreau P. (2009) Exp. Gerontol. 44, 183–189 [DOI] [PubMed] [Google Scholar]
- 67. Jilka R. L., Weinstein R. S., Takahashi K., Parfitt A. M., Manolagas S. C. (1996) J. Clin. Investig. 97, 1732–1740 [DOI] [PMC free article] [PubMed] [Google Scholar]
- 68. Kajkenova O., Lecka-Czernik B., Gubrij I., Hauser S. P., Takahashi K., Parfitt A. M., Jilka R. L., Manolagas S. C., Lipschitz D. A. (1997) J. Bone Miner. Res. 12, 1772–1779 [DOI] [PubMed] [Google Scholar]
- 69. Kodama Y., Takeuchi Y., Suzawa M., Fukumoto S., Murayama H., Yamato H., Fujita T., Kurokawa T., Matsumoto T. (1998) J. Bone Miner. Res. 13, 1370–1377 [DOI] [PubMed] [Google Scholar]
- 70. Sims N. A., Jenkins B. J., Nakamura A., Quinn J. M., Li R., Gillespie M. T., Ernst M., Robb L., Martin T. J. (2005) J. Bone Miner. Res. 20, 1093–1102 [DOI] [PubMed] [Google Scholar]
- 71. Liston A., Hardy K., Pittelkow Y., Wilson S. R., Makaroff L. E., Fahrer A. M., Goodnow C. C. (2007) Genome Biol. 8, R12 [DOI] [PMC free article] [PubMed] [Google Scholar]
- 72. Kappler J. W., Roehm N., Marrack P. (1987) Cell 49, 273–280 [DOI] [PubMed] [Google Scholar]
- 73. Starr T. K., Jameson S. C., Hogquist K. A. (2003) Annu. Rev. Immunol. 21, 139–176 [DOI] [PubMed] [Google Scholar]
- 74. Todd J. A., Wicker L. S. (2001) Immunity 15, 387–395 [DOI] [PubMed] [Google Scholar]
- 75. Kerr J. M., Gordon D. F., Woodmansee W. W., Sarapura V. D., Ridgway E. C., Wood W. M. (2005) Mol. Cell. Endocrinol. 238, 57–67 [DOI] [PubMed] [Google Scholar]
- 76. Diallo E. M., Wilhelm K. G., Jr., Thompson D. L., Koenig R. J. (2007) Mol. Cell. Endocrinol. 264, 149–156 [DOI] [PMC free article] [PubMed] [Google Scholar]
- 77. Askmyr M., Sims N. A., Martin T. J., Purton L. E. (2009) Trends Endocrinol. Metab. 20, 303–309 [DOI] [PubMed] [Google Scholar]