

Abstract
MicroRNAs (miRNAs) are an emerging class of non-coding endogenous RNAs involved in multiple cellular processes, including cell differentiation. Treatment with retinoic acid (RA) results in neural differentiation of neuroblastoma cells. We wanted to elucidate whether miRNAs contribute to the gene expression changes induced by RA in neuroblastoma cells and whether miRNA regulation is involved in the transduction of the RA signal. We show here that RA treatment of SH-SY5Y neuroblastoma cells results in profound changes in the expression pattern of miRNAs. Up to 42 different miRNA species significantly changed their expression (26 up-regulated and 16 down-regulated). Among them, the closely related miR-10a and -10b showed the most prominent expression changes. Induction of miR-10a and -10b by RA also could be detected in LA-N-1 neuroblastoma cells. Loss of function experiments demonstrated that miR-10a and -10b are essential mediators of RA-induced neuroblastoma differentiation and of the associated changes in migration, invasion, and in vivo metastasis. In addition, we found that the SR-family splicing factor SFRS1 (SF2/ASF) is a target for miR-10a -and -10b in HeLa and SH-SY5Y neuroblastoma cells. We show here that changes in miR-10a and -10b expression levels may regulate SFRS1-dependent alternative splicing and translational functions. Taken together, our results give support to the idea that miRNA regulation plays a key role in RA-induced neuroblastoma cell differentiation. The discovery of SFRS1 as direct target of miR-10a and -10b supports the emerging functional interaction between two post-transcriptional mechanisms, microRNAs and splicing, in the neuronal differentiation context.
Keywords: MicroRNA, Neuroblastoma, Neurodifferentiation, Retinoid, RNA Splicing, Translation Control, Retinoic Acid, SFRS1, Alternative Splicing, Post-transcriptional
Introduction
MicroRNAs (miRNAs, miRs)5 are an emerging class of small non-coding endogenous RNAs that are involved in multiple biological processes. These tiny regulatory elements are transcribed as primary longer transcripts, which are then processed by Dicer and Drosha complexes into 21–23-nt mature miRNAs. One strand of the mature miRNA is then incorporated into the RNA-induced silencing complex to regulate gene expression by targeting the 3′-untranslated region (3′-UTR) of mRNAs with consequent translational repression and/or target mRNA degradation. This mode of action demonstrates the great regulatory potential of miRNAs, as a unique mRNA can be targeted by diverse miRNAs, and conversely, each miRNA may have 100s of different target mRNAs (for review, see Refs. 1 and 2).
In vertebrates, the highest variety of miRNAs is expressed in the brain than in any other tissue, suggesting an important role in nervous system development (3, 4). Recent studies have revealed the importance of miRNA expression in neural development and differentiation. For instance, it has been reported that Dicer-deleted mice exhibit malformations of the midbrain and cerebellum and failure of neural crest and dopaminergic differentiation (5). In addition, three brain-specific miRNAs (miR-124a, miR-9, and miR-132) have been proposed to regulate the transcription factor REST that mediates neuronal identity (6), and miR-132 seems also to be involved in the control of neuronal morphogenesis by decreasing the GTPase-activating protein, p250GAP (7). Conversely, de-regulation of miRNA action contributes to different pathological processes, including cancer (8, 9). In recent years miRNAs have been established as important regulators of tumor development, progression, and metastasis and have demonstrated to be useful for tumor diagnosis and classification. Moreover, miRNA regulation might represent a new avenue for cancer treatment in a near future (10–14).
Neuroblastoma is the most common extracranial solid tumor in childhood and the most common tumor in infants, which originates from aberrant development of primordial neural crest cells (15, 16). Despite their tumor origin, neuroblastoma cell lines can be induced to differentiate in vitro by several agents, including retinoic acid (RA) (17–19). Administration of RA to neuroblastoma cells in vitro leads to proliferative arrest and neuronal differentiation as judged by their morphology and the expression of biochemical and functional neuronal markers (20, 21). In addition, to inhibit cell proliferation and induce differentiation, long term RA treatment reduces the biological aggressiveness of neuroblastoma cells by reducing their migratory and invasive abilities (22, 23). All these results prompted the introduction of RA and its derivatives into therapeutic protocols for neuroblastoma patients, with some success especially in the treatment of minimal residual disease (24–26). Although several evidences support a role for miRNAs in neuroblastoma pathogenesis (27–30) and the usefulness of miRNA profiles for neuroblastoma diagnostics, classification, and prognosis has been recently reported (31–33), little is known about the involvement of miRNAs in RA-induced differentiation of neuroblastoma cells.
In this study we show that RA treatment of SH-SY5Y neuroblastoma cells results in profound changes in the expression pattern of miRNAs. Up to 42 different miRNA species significantly change their expression levels (26 up-regulated and 16 down-regulated). Among them, the closely related miR-10a and -10b showed the most prominent expression changes. Through loss of function experiments we could show that miR-10a and -10b contribute to the regulation of RA-induced differentiation and in the associated changes in migratory and invasive activities. In addition we could determine that the SR-family splicing factor SFRS1 (SF2/ASF) is a target for miR-10a and -10b action, and we show that changes in miR-10a and -10b expression levels may influence cellular processes in which SFRS1 is involved. Our results give support to the idea that miRNA regulation plays a key role in RA-induced neuroblastoma cell differentiation and in the associated gene expression changes.
EXPERIMENTAL PROCEDURES
Cell Culture and RA Treatment
SH-SY5Y (ATCC CRL-2266) and HeLa (ATCC CCL-2) cells were cultured in DMEM containing 10% heat-inactivated FBS, 100 units/ml penicillin, and 100 μg/ml streptomycin. LA-N-1 cells (European Collection of Animal Cell Cultures ECACC 06041201) were grown on gelatin-coated plastic dishes in a 1:1 mixture of EMEM and Ham's F-12 medium containing 15% heat-inactivated FBS, 100 units/ml penicillin, 100 μg/ml streptomycin, and 1% nonessential amino acids. Cell cultures were kept at 37 °C in a humidified atmosphere with 5% CO2. The medium was replaced every 2 days, and the cells were split before they reached confluence. RA (all-trans retinoic acid, Sigma) was dissolved in dimethyl sulfoxide and added to the culture medium at 1 μm concentration.
miRNA Expression Profiling
For miRNA expression, profiling real-time RT-PCR was performed using TaqMan Human MicroRNA Low Density Arrays Version 2.0 (Applied Biosystems). A comprehensive coverage of Sanger miRBase v10 is enabled across the two-card set of TaqMan MicroRNA arrays for a total of 667 unique assays specific to human miRNAs. In addition, each array contains four control assays, three endogenous control assays and one negative control assay. SH-SY5Y cells were treated with 1 μm RA during 0, 24, 48, and 96 h (4 replicate 100-mm dishes for each condition). Total RNA was extracted using the mirVana kit (Ambion-Applied Biosystems) and quantified by spectrophotometry and the integrity of the RNA evaluated in agarose gels. Retro-transcription, pre-amplification, and real-time PCR of miRNAs were made following the Megaplex Pools for microRNA Expression Analysis Protocol. All reagents were obtained from Applied Biosystems. Both reverse transcription and pre-amplification were made with two different pools of primers (A and B), corresponding to the miRNAs represented in the array A and B, respectively. 1 μg of total RNA was reverse-transcribed using Megaplex RT primers and the TaqMan miRNA reverse transcription kit in a total of 7.5 μl volume. Then the reverse-transcribed product (2.5 μl) was pre-amplified using Megaplex PreAmp Primers and TaqMan PreAmp Master Mix in a 25-μl reaction. The pre-amplified cDNA was diluted 1:4 with 0.1× Tris-EDTA, pH 8.0, and quantitative real-time PCR was performed using Applied Biosystems 7900HT system and a TaqMan Universal PCR Master Mix with 9 μl of diluted cDNA input per plate.
Data from real-time RT-PCRs were analyzed using the Applied Biosystems 7900HT Fast Real-Time PCR System Relative Quantitation Using Comparative Ct in SDS v2.2 software. The experimental data have been analyzed with the automatic base line and manual Ct set to 0.2. The amplification plots have been reviewed manually and the base-line and the threshold settings adjusted for individual assays, if necessary. Because a Ct value of 35 represents single molecule template detection, Ct values >35 were considered to be below the detection level of the assay. Therefore, only the miRNAs with a Ct ≤ 35 were included in the analyses. A moderate t test between all treated versus non-treated groups was performed and corrected using the Benjamini-Hochberg algorithm with the false discovery rate set at a value of 5%.
Anti-miR and Pre-miR Transfection
SH-SY5Y cells were seeded at 500,000 cells/well in 6-well plates. On the next day, the cells were transfected with one of the RNA oligonucleotides (anti-miR-10a, anti-miR-10b, negative control anti-miR, pre-miR-10a, pre-miR-10b, and negative control pre-miR; Ambion-Applied Biosystems) at 50 nm final concentration using 5 μl of Lipofectamine 2000 reagent (Invitrogen) and Opti-MEM medium. After 6 h of transfection, the medium was changed to fresh SH-SY5Y growth medium with 1 μm RA or vehicle. HeLa cells were seeded at 250,000 cells/well in 6-well plates and transfected as described above for SH-SY5Y cells.
Luciferase Reporter Assays
The 3′-UTRs of the putative target genes (SFRS1 and SFRS10) were amplified by PCR and cloned downstream to the luciferase reporter gene into the XbaI site of pGL3-Control vector (Promega). Reporter genes were sequenced to assess the right sequence and orientation of the fragments. HeLa cells were seeded at 50,000 cells/well, and the following day, 500 ng of luciferase reporter construct (SFRS1 3′-UTR or SFRS10 3′-UTR) and 25 ng of Renilla luciferase reporter construct as internal control were co-transfected together with one of the RNA oligonucleotides at a 50 nm final concentration using 3 μl of Lipofectamine 2000 reagent (Invitrogen) and Opti-MEM medium as described above. After 48 h the cells were lysed, and firefly and Renilla luciferase activities from cell extracts were measured with the dual-luciferase reporter system (Promega) according to the manufacturer's instructions. The effects of miRNA regulation on SFRS1-mediated translational regulation were analyzed with reporter plasmids pLCS-EDAwt and pLCS-EDAmt (34), which were transfected as described (35) together with one of the RNA oligonucleotides at a 50 nm final concentration.
Quantitative Real-time Reverse Transcription PCR
Total RNA was extracted from SH-SY5Y, HeLa, and LA-N-1 cells using TRIzol reagent (Invitrogen) and then quantified by spectrophotometry. For quantitative real-time PCR of miRNA, 10 ng of total RNA was reverse-transcribed in a 15-μl total reaction volume using specific stem-loop RT primers (Applied Biosystems), and 1.33 μl of cDNA was subjected to a TaqMan miRNA assay (Applied Biosystems) in 20 μl of total reaction using primers and probe specific for individual human miRNAs according to the manufacturer's protocol. Expression values were calculated using the comparative Ct method, and U6 snRNA was used as an endogenous control. For quantitative real-time PCR of mRNAs, 1 μg of total RNA was reverse-transcribed using oligo(dT)16 and Moloney murine leukemia virus reverse transcriptase as described (36). 1 μl of a 10-fold cDNA dilution was subjected to SYBR Green or TaqMan gene expression assays (Applied Biosystems) according to the manufacturer's instructions. Expression values were also calculated using comparative Ct method, and GAPDH gene was used as endogenous control. Reactions were run in an Applied Biosystems 7500 Fast Real-Time PCR system.
Proliferation Assays
For [3H]thymidine incorporation assays, SH-SY5Y cells were seeded in 24-well plates at 50,000 cells/well and transfected the following day with anti-miR-10a, anti-miR-10b, or negative control anti-miR at 50 nm final concentration using 1 μl of Lipofectamine 2000 reagent (Invitrogen) and Opti-MEM medium as described above. After 6 h of transfection, the medium was changed to fresh SH-SY5Y growth medium supplemented with 1 μm RA or vehicle. After 96 h of RA treatment, cells were pulse-labeled for 6 h with 1 μCi/ml of [3H]thymidine deoxyribose (5 Ci/mmol, Amersham Biosciences). The cells were then harvested with 10% TCA by shaking for 10 min and processed for liquid scintillation counting. For the determination of DNA content SH-SY5Y cells were transfected with anti-miR-10a, anti-miR-10b, or negative control anti-miR in 6-well plates as described above. After transfection, the medium was changed to fresh SH-SY5Y growth medium with 1 μm RA or vehicle. After 96 h of RA treatment the cells were washed in PBS and fixed in 80% ethanol for 60 min at 4 °C. The cells were then washed with PBS and treated with DNA extraction buffer (0.2 m Na2HPO4, 0.1 m citric acid, pH 7.8) for 5 min at 37 °C. Samples were centrifuged, and cellular DNA was stained with 20 μg/ml propidium iodide (Sigma) and 0.2 mg/ml DNase-free RNase A (Sigma) in PBS for 30 min at 37 °C in the dark. After cytometry in a FACSCanto cytometer (BD Biosciences), the cell cycle phases were determined by using the ModFit LT 3.0 package.
Western Blot
Cells were washed with PBS and lysed in radioimmune precipitation assay buffer (50 mm HEPES pH 7.4, 150 mm NaCl, 1 mm EGTA, 10 mm NaF, 0,5% Nonidet P-40, 1 mm sodium orthovanadate, 10 μg/ml leupeptin, 10 μg/ml aprotinin, 100 μm PMSF). The extract was cleared by centrifugation at 4 °C, and the protein content was determined with Bio-Rad protein assay. Western blot was performed as described (37). Antibodies against tyrosine hydroxylase were obtained from Cell Signaling Technologies, those against ID2 and SFRS1 were purchased from Santa Cruz Biotechnology, and those against β-actin and NEFM were obtained from Sigma. Horseradish peroxidase-conjugated secondary antibodies were obtained from GE Healthcare.
Migration and Invasion Assays
The migration and invasion capacities of SH-SY5Y neuroblastoma cells were tested according to published protocols (38, 39) with slight modifications. A modified, light-opaque Boyden chamber (Falcon HTS FluoroBlock, 8 μm pore size; BD Biosciences) was used in migration assays. SH-SY5Y cells were transfected with 50 nm negative control anti-miR, anti-miR-10a, or anti-miR-10b, respectively, and treated with 1 μm RA for 96 h. After 96 h of treatment, cells were labeled in the plate with calcein AM (5 μm; Molecular Probes-Invitrogen) for 30 min at 37 °C. Labeled cells were detached from the plate by scraping and counted. For migration assays, the lower chamber of the plate contained 10% FBS as chemo-attractant. 5 × 10⁴ labeled cells in serum-free medium were added onto the upper chamber. After 6 h of incubation at 37 °C, the fluorescent light emitted by the cells that migrated through the opaque filter was measured with a Victor2 multilabel counter (PerkinElmer Life Sciences). The assays were performed in triplicate. For invasion assays SH-SY5Y cells were transfected with 50 nm negative control anti-miR, anti-miR-10a, or anti-miR-10b, respectively, and treated with 1 μm RA or vehicle for 96 h after the above protocol. After 96 h of treatment, cells were trypsinized, and 0.3 × 10⁶ cells were transferred to transwell chambers precoated with 10 μg Matrigel® (BD Biosciences) matrix. Medium containing 10% FBS in the lower chamber served as chemo-attractant. Plates were incubated for 24 h. After 24 h of incubation, the invading cells were detached from the bottom of the membrane by placing the 24-well inserts in 24-well plates prepared with 500 μl trypsin/well and incubating them at 37 °C for 10 min. Non-invading cells from the top of the membrane were removed using 200 μl of trypsin. Invading and non-invading cells were transferred to 1.5-ml tubes and centrifuged at 1200 rpm for 5 min to remove the trypsin. Then, cells in each well were resuspended in 50 μl of Cell Titer-Glo® reagent (Promega), and lysates were plated in 96-well plate. The luminescence signal was read according to the manufacturer's instructions, and the invasion ratio from the three replicates were calculated and expressed as the mean ± S.D.
Chicken Chorioallantoic Membrane Assay
The chicken chorioallantoic membrane assay was performed as described previously (40, 41). In brief, negative control anti-miR- or anti-miR-10a-transfected cells were treated with 1 μm RA or vehicle for 96 h. Then, 1 × 10⁶ cells were placed on the upper chorioallantoic membrane of 10-day-old chicken embryos. After 7 days the chicken embryos were dissected, and the quantification of the metastatic cells was performed on genomic DNA from embryonic lungs prepared using the Puregene DNA purification system (Qiagen). Quantification of human Alu sequences in the extracted DNA was performed by TaqMan quantitative PCR as described (42). Six parallel assays were performed for each condition.
Statistical Analysis
Pairwise comparisons between sample groups were analyzed by the one-tailed Student's t test, with statistically significant differences between the means indicated as p < 0.05 (*), p < 0.01 (**), or p < 0.001 (***).
RESULTS
miRNA Expression Profiling during RA-induced Differentiation of Neuroblastoma SH-SY5Y Cells
We wanted to understand the contribution of microRNAs to the gene expression changes occurring during RA-induced differentiation of human neuroblastoma cells. With this aim we have analyzed the changes in the miRNA expression profile of SH-SY5Y cells upon treatment with 1 μm RA for 0, 24, 48, and 96 h. For this purpose, we used TaqMan Human MicroRNA Low Density Arrays v2.0 (Applied Biosystems), which provide comprehensive coverage of Sanger miRBase v10 for a total of 667 unique assays specific to human miRNAs. The data from real-time RT-PCRs were analyzed through the Relative Quantitation Using Comparative Ct method. The data were normalized against U6 snRNA, and a moderate t test and a correction using the Benjamini-Hochberg algorithm with the false discovery rate set at a value of 5% was performed between all the treated versus non-treated comparisons. On the basis of this analysis, 452 human miRNAs could be detected, whereas 215 did not reach the detection threshold. Among those, 452 miRNAs present, 42 showed a statistically significant change in expression at least in two of the three treated versus untreated comparisons (Fig. 1A). From these 42 miRNAs, a set of 26 miRNAs was up-regulated, and a group of 16 miRNAs was down-regulated during the RA treatment (Fig. 1, B and C). Among the up-regulated group we found that miR-10a, -10b, -10b*, -615–5p, -211, -212, -132, -22, -766, -135a, and -148b* had a robust pattern of induction. On the other hand we found miR-490–3p, -154*, 26a-2*, -296–3p, -422a, -486–3p, -378, -411*, -543, -801, -873, and -107 had a robust pattern of down-regulation. The expression of the 12 miRNAs with most prominent changes was validated by real-time RT-PCRs using Applied Biosystems TaqMan individual specific assays to human miRNAs (Fig. 1, D and E). All the validated miRNAs showed significant change in their expression, confirming to the pattern observed in the array data. Among the group of differentially expressed miRNAs, two members of miR-10 family, miRNA-10a and -10b, were strongly up-regulated and showed a similar pattern of induction. Induction of miR-10a and -10b by RA occurred to comparable levels in another human neuroblastoma cell line, LA-N-1 (Fig. 1, F and G).
FIGURE 1.

miRNA expression profiling in differentiating SH-SY5Y cells is shown. A, shown is a summary of TaqMan microRNA LDA expression profiling results. B and C, relative expression values are detected in TaqMan microRNA LDA for microRNAs with a false discovery rate of <0.05 at least in two of the three treated versus non-treated comparisons, for up-regulated (B) and down-regulated miRNAs (C). The values for 24 h (empty bars), 48 h (gray bars), and 96 h (black bars) of RA treatment are represented. D and E, RT-qPCR validation experiments for selected up-regulated (D) and down-regulated (E) microRNAs are shown. Data were normalized for the expression of U6 small nuclear RNA, and the relative expression level to the value of 0 h of RA treatment is represented (mean ± S.D. from the two independent determinations). The values for 0 h (empty bars), 24 h (light gray bars), 48 h (dark gray bars), and 96 h (black bars) of RA treatment are shown. F and G, expression levels of miR-10a (F) and -10b (G) during RA treatment of SH-SY5Y and LA-N-1 neuroblastoma cells are shown. The cells were treated with RA for the times indicated in the figure, and the levels of miR-10a and -10b were analyzed by RT-qPCR as indicated for D and E. The graph shows the mean ± S.D. from two independent determinations. Black bars, SH-SY5Y cells. Gray bars, LA-N-1 cells.
Suppression of miR-10a and -10b Endogenous Expression Results in Impairment of RA-induced Differentiation
To gather information about the roles of miR-10a and -10b in RA-induced neuroblastoma differentiation, we have performed loss of function experiments with antisense miRNA antagonists (anti-miRs) and evaluated their effects on the morphology, the proliferation rate, and the expression of differentiation and neuronal markers in neuroblastoma cells. After transfection of each specific anti-miR to SH-SY5Y cells and treatment with RA, near 60% of reduction of miRNA-10a and -10b endogenous levels was achieved (Fig. 2F). Cells in which the expression of miR-10a and -10b was reduced with specific anti-miRs showed impaired differentiation. Untreated neuroblastoma cells bear short neurites and grow as high density cell clusters. Upon RA treatment, extension of neurites took place, and the cells spread on the plate surface. When anti-miR-10a/-10b were transfected and the cells treated with RA, a reduction in the length of neurites and an increase in the cell cluster number could be observed as compared with cells transfected with negative control anti-miR (Fig. 2, A–E). Quantification of neurite length using Neuron J software (43) show that RA treatment of cells transfected with anti-miR-10a or -10b resulted in reduced neurite length, as compared with cells transfected with negative control (NC)-anti-miR (Fig. 2G). RA treatment of neuroblastoma cells also results in proliferative arrest, and the effects of miR-10a and -10b suppression on proliferation of SH-SY5Y cells have been analyzed. Treatment of neuroblastoma cells with RA for 96 h led to a strong reduction of the incorporation of [3H]thymidine to ∼30% of the control values. However, this reduction of the proliferation was equally observed in RA-treated cells transfected with anti-miR-10a or -10b (Fig. 2G). Consequently, the percentage of cells in S-phase is reduced to half as the effect of RA treatment for 96 h, evaluated after cytometry of propidium iodide-stained cells. After transfection of miR-10a or-10b, a similar reduction in the fraction of cells in S-phase could be observed (Fig. 2H). Finally, we have tested whether the suppression of miR-10a and -10b would affect apoptosis of neuroblastoma cells. By analyzing the cellular DNA content by means of cytometry in propidium iodide-stained cells, we could not detect an increase in sub-G1 cell population after transfection of anti-miR-10a or -10b, supporting the idea that miR-10a and -10b are not involved in the regulation of apoptosis (data not shown).
FIGURE 2.

Experimental reduction of miR-10a and -10b levels impaired RA-induced morphological differentiation without altering proliferation arrest. A–E, morphological differentiation induced by RA was impaired after experimental reduction of miRNA-10a and -10b levels. Photomicrographs of untransfected cells treated with vehicle (A, ut), untransfected cells treated with RA for 96 h (B, RA), cells transfected with negative control anti-miR and subsequently treated with RA as above (C, NC-am+RA), or cells transfected with anti-miR-10a or -10b and subsequently treated with RA as above (am-10a+RA (D) and am- 10b+RA (E), respectively) are shown. F, shown is RT-qPCR analysis of miRNA-10a and -10b expression levels after transfection of SH-SY5Y cells with anti-miR-10a, -10b and NC anti-miR and subsequent RA treatment for 96 h. For comparison, the values obtained with mock-transfected cells treated with vehicle (mock) or RA (mock+RA) are shown. The graph represents the values obtained from a triplicate experiment (mean ± S.D.). Statistical significance was analyzed by comparing samples transfected with anti-miR-10a or -10b with those transfected with NC-anti-miR. G, miR-10a or -10b knockdown results in reduced RA-induced neurite outgrowth. Quantification of neurite length was performed with Neuron J software (43) on photomicrographs obtained after transfection of SH-SY5Y cells with anti-miR-10a and -10b and NC anti-miR and subsequent RA treatment for 96 h. For comparison, the values obtained with mock-transfected cells treated with vehicle (mock) or RA (mock+RA) are shown. The graph represents the values obtained (mean ± S.E.). At least 100 cells from duplicate photomicrographs were analyzed for each condition. Statistical significance was analyzed by comparing samples transfected with anti-miR-10a or -10b with those transfected with NC-anti-miR. H and I, suppression of miR-10a and -10b expression did not affect the proliferation arrest induced by RA. G, [3H]thymidine incorporation in control mock-transfected SH-SY5Y neuroblastoma cells and after RA treatment for 96 h of mock-transfected cells or cells transfected with NC-anti-miR, anti-miR-10a, or anti-miR-10b. The graph represents the values obtained from triplicate experiments (mean ± S.D.). Statistical significance was analyzed by comparing samples transfected with anti-miR-10a or -10b with those transfected with NC-anti-miR. a.u., arbitrary units. H, shown is the effect of RA treatment and miR-10a or -10b knockdown in the fraction of cells at the S phase of the cell cycle. The percentage of cells in S phase was obtained by analyzing the DNA content by cytometry after staining with propidium Iodide. The effects of RA treatment in cells transfected with NC-anti-miR, anti-miR-10a, or anti-miR-10b were compared with those observed in mock-transfected cells.
The role of miRNA-10a and -10b in promoting the differentiation of SH-SY5Y cells was further demonstrated by evaluating the effect of specific anti-miRs on the expression of differentiation markers. Tyrosine kinase receptors NTRK2 (trkB) and RET are induced by RA in several neuroblastoma cells lines and have been proposed to play important roles in differentiation (44–49). The levels of NTRK2 and RET mRNAs were very low in untreated SH-SY5Y cells, and RA treatment led to strong induction of the expression of both genes. However, RA treatment of anti-miR-10a- and anti-miR-10b-transfected cells resulted in a reduction of NTRK2 and RET gene expression, as compared with negative control anti-miR transfected cells (Fig. 3, A and B). GAP43 and neuron-specific enolase (ENO2) have been also reported as neuronal differentiation markers (18, 46, 50). GAP43 and ENO2 mRNA basal levels were somewhat higher in untreated SH-SY5Y cells, although a modest increase could be detected after RA treatment. This increase was nevertheless abolished in anti-miR-10a and anti-miR-10b transfected cells but not in cells transfected with negative control anti-miR (Fig. 3, C and D).The members of the ID gene family, ID1, ID2, and ID3, are basic helix-loop-helix transcription factors that act as important negative regulators of differentiation (51, 52), and their down-regulation during RA treatment in SH-SY5Y has been previously reported (50, 53). RA treatment of anti-miR-10a- and anti-miR-10b-transfected cells resulted in impairment of ID1, ID2, and ID3 gene down-regulation, as compared with negative control anti-miR-transfected cells (Fig. 3, E, F, and G). These alterations in mRNA levels were paralleled by elevated ID protein levels, as shown as an example in the case of ID2 by Western blot (Fig. 4A). In addition, we have evaluated by Western blot the expression of other common neuronal markers positively regulated upon RA treatment in SH-SY5Y cells, as the medium-size neurofilament protein NEFM (46) and the enzyme tyrosine hydroxylase, involved in the biosynthesis of catecholamine (54, 55). RA treatment of SH-SY5Y cells after miR-10a and -10b reduction by anti-miR transfection resulted in impaired NEFM up-regulation, as shown by Western blot (Fig. 4B). Similarly, RA-induced expression of tyrosine hydroxylase was partially abolished in anti- miR-10a- and -10b-transfected cells (Fig. 4C). In summary, our results indicate that miR-10a and -10b were involved in RA-induced neurite outgrowth and in the gene expression changes associated with neural differentiation. However, miR-10a and -10b did not appear to play a relevant role in RA-induced proliferation arrest.
FIGURE 3.

Experimental reduction of miR-10a and -10b levels impaired gene expression changes associated with RA-induced differentiation. RT-qPCR analysis of the mRNA levels of NTRK2 (trkB, A), RET (B), GAP43 (C), ENO2 (neuron-specific enolase, D), ID1 (E), ID2 (F), and ID3 (G) is shown. mRNA expression levels after RA treatment of SH-SY5Y cells transfected with anti-miR-10a and -10b or negative control anti-miR. For comparison, the values obtained with mock-transfected cells treated with vehicle (mock) or with RA (mock+RA) are shown. The graph represents the values obtained from triplicate experiments (mean ± S.D.). Statistical significance was analyzed by comparing samples transfected with anti-miR-10a or -10b with those transfected with NC-anti-miR.
FIGURE 4.
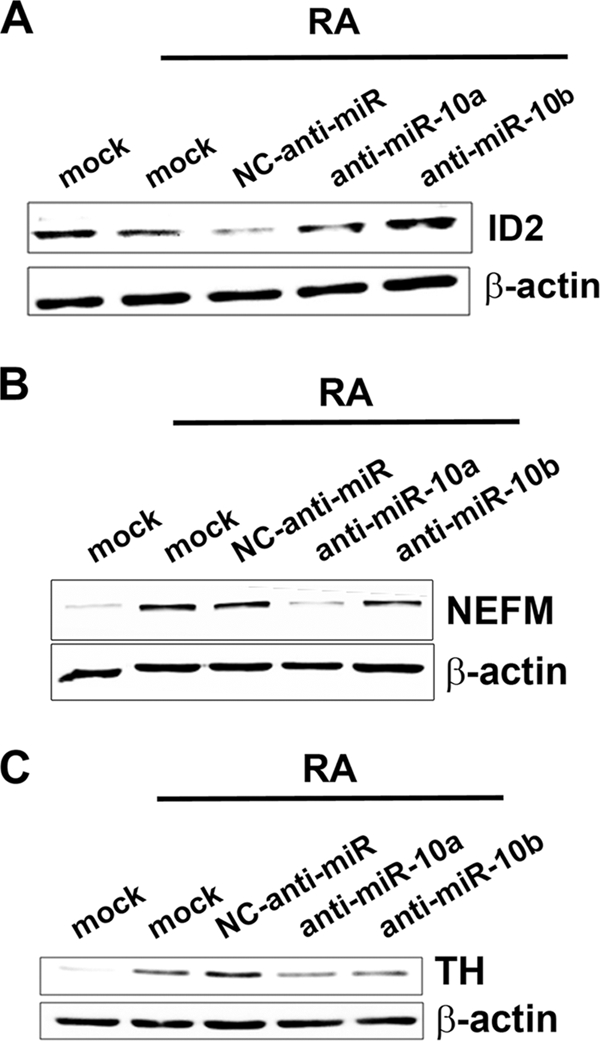
Experimental reduction of miR-10a and -10b levels impaired gene expression changes associated with RA-induced differentiation. Shown is Western blot analysis of the protein levels for ID2 (A) and the neuronal markers neurofilament medium polypeptide (NEFM, B) and tyrosine hydroxylase (TH, C) after RA treatment of SH-SY5Y cells transfected with anti-miR-10a and -10b and NC anti-miR. For comparison, the results obtained with mock-transfected cells treated with vehicle (mock) or with RA (mock+RA) are shown. The filter was re-probed for β-actin as loading control.
We have tested whether the overexpression of miR-10 and -10b, by transfecting their cognate precursor pre-miRs, would affect the expression of differentiation markers independently of RA treatment. The mRNA levels of RET, NTRK2, GAP43, and ENO2 were slightly enhanced by transfection of pre-miR-10a and -10b, as compared with transfection of negative control pre-miR. Similarly, the levels of NEFM and tyrosine hydroxylase proteins were enhanced by overexpression of pre-miR-10a and -10b, as compared with negative control pre-miR (see supplemental Fig. S1). However, the attained expression levels for all the markers analyzed are far below those obtained by RA treatment. Therefore, miR-10a and -10b appeared to be necessary but not sufficient for full neural differentiation, and consequently, additional actions of RA must contribute to differentiation.
Knockdown of miR-10a and -10b Impaired the RA-induced Reduction of Migratory and Metastatic Abilities of Neuroblastoma SH-SY5Y Cells
Other important cellular processes in which miR-10a and miR-10b could play a role are migration, invasion, and metastasis. It has been shown that long term RA treatment reduces the biological aggressiveness of neuroblastoma cells by reducing their migratory and invasive abilities (22, 23), and we wanted to know whether the induction of miR-10a and miR-10b by RA could participate in this reduced migratory and invasive behavior. We first analyzed the migratory ability of anti-miR-transfected RA-treated neuroblastoma cells using a transwell migration assay and FBS as chemo-attractant. As is shown in Fig. 5A, RA treatment results in reduced migration, whereas blocking miR-10a and -10b function by co-transfecting the cognate anti-miRs abolished the reduction in migration induced by RA in SH-SY5Y cells. Invasive activity was analyzed by a similar transwell assay, in which the porous membrane separating the two chambers was covered with Matrigel, a commercial basal membrane preparation. In this condition, treatment of SH-SY5Y cells results in an increase of their invasive potential. Transfection of anti-miR-10a and -10b resulted in a further increase of the invasive potential of neuroblastoma cells, although in the case of anti-miR-10b the differences are at the limit of statistical significance (Fig. 5B). To study the effects of RA treatment in the metastatic potential of neuroblastoma cells and the involvement of miR-10a and 10b, we employed the chicken chorioallantoic membrane assay. Given the complexity of the assay, only anti-miR-10a and negative control anti-miR were compared. In the chicken chorioallantoic membrane assay, neuroblastoma cells transfected with negative control anti-miR appeared to disseminate to the lungs when transferred to the upper chorioallantoic membrane of 10-day-old chicken embryos, and transfection of anti-miR-10a slightly increased the presence of neuroblastoma cells in the lungs. RA treatment of cells transfected with negative control anti-miR significantly reduced the presence of human cells in the chicken lungs. However, when RA treatment was administrated to cells transfected with anti-miR-10a the observed RA-dependent reduction in lung metastasis was abolished (Fig. 5C). Taken together, the results support an involvement of miR-10a and -10b in the reduction of biological aggressiveness elicited by RA treatment in neuroblastoma cells.
FIGURE 5.

Involvement of miR-10a and -10b on the effects of RA in migratory, invasive, and metastatic potential of neuroblastoma cells. A, migration is shown. Mock-transfected cells and cells transfected with NC anti-miR, anti-miR-10a, or anti-miR-10b were treated with 1 μm RA or vehicle for 96 h. Cells from the different treatment groups were labeled with calcein AM, and migration transwell assays were set as described under “Experimental Procedures.” The graph shows a representative experiment performed in triplicate (mean ± S.D.). Statistical significance was analyzed by comparing samples transfected with anti-miR-10a and -10b with those transfected with NC-anti-miR. B, invasion is shown. Mock-transfected cells and cells transfected with NC anti-miR, anti-miR-10a, or anti-miR-10b were treated with 1 μm RA or vehicle for 96 h. Cells from the different treatment groups were used to set transwell Matrigel invasion assays as described under “Experimental Procedures.” The graph shows the average of three experiments performed in triplicate (mean ± S.D.). Statistical significance was analyzed by comparing samples transfected with anti-miR-10a and -10b with those transfected with NC-anti-miR. C, metastasis is shown. Cells transfected with NC anti-miR or anti-miR-10a were treated with 1 μm RA or vehicle for 96 h. Cells from the different treatment groups were transferred to the upper chorioallantoic membrane (CAM) of 10-day-old chicken embryos and the number of metastasized cells into the lungs was evaluated 7 days later as described under “Experimental Procedures.” The graph represents the values obtained from six parallel assays (mean ± S.D.). Statistical significance was analyzed by comparing samples transfected with anti-miR-10a with those transfected with NC-anti-miR. In addition, samples transfected with NC-anti-miR treated with vehicle were compared with those treated with RA.
Identification and Validation of Direct Targets of miR-10a and -10b in SH-SY5Y Neuroblastoma Cells
Although the HOXD10 gene is reportedly a functional target of miR-10a in breast cancer cells (56, 57), we could not detect alteration of HOXD10 protein levels after RA treatment or transfection of anti-miR-10a and -10b in SH-SY5Y neuroblastoma cells (data not shown). To identify new direct targets of miR-10a and -10b during RA-induced differentiation of neuroblastoma cells, a bioinformatic approach based on mRNA and miRNA data integration was performed. A list of common predicted targets by three databases, miRbase targets (58, 59), Targetscan (60), and Pictar (61), was crossed with a list of down-regulated mRNAs at 48 h of RA treatment obtained from an Affymetrix microarray experiment.6 In this approach the down-regulated mRNA group upon RA treatment was chosen considering the mRNA destabilization role of many microRNAs. In addition, only 3′-UTR seed sequences evolutionarily conserved in the mRNAs were chosen. After evaluating the resulting list, the top-seeded genes were two members of the arginine/serine-rich SR splicing factor family: SFRS1 (SF2/ASF) and SFRS10 (TRA2B) (Fig. 6, A and B; see also supplemental Figs. S2 and S3). To find out whether miR-10a and miR-10b target the 3′-UTR of SFRS1 and SFRS10 mRNAs, we constructed luciferase gene based reporters including the 3′-UTRs of SFRS1 and SFRS10 mRNAs. Co-transfection of these reporters together with precursor pre-miR-10a and -10b in HeLa cells resulted in >80% reduction in the activity of the reporter constructs, as compared with the control pre-miR-transfected samples (Fig. 6, C and D). Conversely, co-transfection of specific anti-miR-10a and -10b enhanced the activity of the SFRS1 3′-UTR reporter construct, as compared with the control anti-miR. However, only anti-miR-10b could enhance the reporter construct including the SFRS10 3′-UTR, whereas anti-miR-10a, although showing a similar trend, was at the limit of significance (p = 0.059) (Fig. 6, E and F). To test the specificity of those effects, SFRS1 and SFRS10 3′-UTRs were cloned in the opposite direction into the luciferase reporter plasmids. Under those conditions the effects of anti-miR-10a and -10b as well as those of pre-miR-10a and -10b were abolished or severely diminished (data not shown).
FIGURE 6.

Identification and validation of SFRS1- and SFRS10 -3′-UTRs as direct targets of miR-10a and -10b. A and B, shown is the location of the putative miR-10a and -10b target sites in SFRS1 (A) and SFRS10 3′-UTR (B). Unpaired bases are indicated in lowercase above and below the duplex. The predicted ΔG value for this structure is calculated by mFold analysis. Nucleotide numberings in human SFRS1 and SFRS10 mRNAs are according to the corresponding RefSeq entries (NM_006924 and NM_004593, respectively). C and D, shown are the effects of miR-10a and -10b overexpression on the activity of SFRS1- (C) and SFRS10–3′-UTR (D) luciferase reporter constructs in HeLa cells. HeLa cells were co-transfected with pre-miR-10a and -10b or negative control pre-miR. Values (mean ± S.D.) are represented as relative light units obtained from three independent experiments performed in triplicate. Student's t test was used to compare samples transfected with pre-miR-10a and -10b to those transfected with negative control pre-miR. E and F, effects of miR-10a and -10b silencing on the activity of SFRS1- (E) and SFRS10–3′-UTR (F) luciferase reporter constructs in HeLa cells. HeLa cells were co-transfected with anti-miR-10a and -10b or negative control anti-miR. Values (mean ± S.D.) are represented as relative light units obtained from an experiment performed in triplicate. Statistical analysis was performed by comparing samples transfected with anti-miR-10a and -10b to those transfected with negative control anti-miR; ns, non-significant.
Alteration of the Expression Levels of SFRS1 mRNA and Protein through Silencing or Forced Expression of miR-10a/-10b in HeLa and SH-SY5Y Cells
Transfection of anti-miR-10a and -10b to HeLa cells resulted in a >80% reduction of the endogenous miR-10a and -10b levels, as compared with negative control anti-miR (Fig. 7, A and B). These reduced miR-10a and -10b levels led to an increase of the endogenous SFRS1 protein expression, as compared with the negative control anti-miR-transfected cells (Fig. 7C). miRNA action at the post-transcriptional level occurs through translational suppression and/or mRNA destabilization. To elucidate which of the two mechanisms was responsible for SFRS1 regulation, SFRS1 mRNA expression was determined in anti-miRs-transfected cells by quantitative RT-PCR. As shown in Fig. 7D, an increase of SFRS1 mRNA in anti-miR-10a-transfected cells occurred, as compared with negative control anti-miR, whereas transfection of anti-miR-10b shows a similar trend, although the differences are not statistically significant. The results suggest the involvement of mRNA destabilization in the regulation of SFRS1 levels. SFRS1 regulation by miR-10a/-10b during RA-induced differentiation of SH-SY5Y cells also occurred through mRNA destabilization. Relative SFRS1 mRNA and protein levels were determined after RA treatment of anti-miR-transfected neuroblastoma cells. As shown in Fig. 7, E and F, SFRS1 mRNA and protein levels were down-regulated in parallel during RA treatment of SH-SY5Y cells. In contrast, abolishment of this down-regulation was observed in RA-treated anti-miR-10a- and -10b-transfected cells as compared with the control anti-miR-transfected cells. Conversely, we want to determine whether an overexpression of miR-10a and miR-10b in HeLa cells could have the opposite effect in SFRS1 mRNA and protein levels. HeLa cells were transiently transfected with pre-miR-10a and pre-miR-10b or negative control pre-miR. Almost a 4000-fold increased expression of miR-10a and 7000-fold increased expression of miR-10b was obtained in specific pre-miR-transfected cells as compared with the negative control (Fig. 8A and B). Under those conditions a significant reduction in SFRS1 protein and mRNA levels was observed in pre-miR-10a-transfected HeLa cells as compared with negative control pre-miR-transfected cells. Nevertheless, reduction to a lesser extent was observed in pre-miR-10b-transfected cells (Fig. 8, C and D). A similar effect was observed in SH-SY5Y cells, in which transfection of pre-miR-10b resulted in significant reduction of SFRS1 mRNA and protein levels, whereas the effect of pre-miR-10a was in this case less important and, in the case of mRNA levels, at the limit of statistical significance (p = 0.07) (Fig. 8, E and F).
FIGURE 7.

miR-10a/-10b knockdown leads to increased SFRS1 protein and mRNA levels in HeLa and SH-SY5Y cells. A and B, RT-qPCR analysis of miRNA-10a (A) and -10b (B) endogenous expression levels after transfection of HeLa cells with anti-miR-10a, and -10b as compared with NC anti-miR is shown. C, Western blot of SFRS1 protein expression after anti-miR-10a and -10b and NC-anti-miR transfection of HeLa cells is shown. The blot was reprobed with β-actin antibodies as the loading control. D, RT-qPCR analysis of SFRS1 mRNA levels in the same conditions is shown. The graph shows expression levels relative to that of cells transfected with NC-anti-miR (mean ± S.D. of a triplicate experiment). E, Western blot of SFRS1 protein expression after anti-miR-10a and -10b and NC-anti-miR transfection of SH-SY5Y cells followed by 1 μm RA treatment is shown. The blot was reprobed with β-actin antibodies as loading control. F, RT-qPCR analysis of SFRS1 mRNA levels in same conditions is shown. The graph shows expression levels relative to that of RA untreated, NC-anti-miR-transfected cells (mean ± S.D. of a triplicate experiment). Statistical analysis for panels A, B, D, and F was made by comparing the values from cells transfected with anti-miR-10a or -10b to those from cells transfected with NC-anti-miR; ns, non significant.
FIGURE 8.

miR-10a and -10b overexpression leads to a reduction of SFRS1 protein expression in HeLa and SH-SY5Y cells through a decrease of its mRNA levels. A and B, shown is RT-qPCR analysis of miRNA-10a (A) and -10b (B) endogenous levels after transfection of HeLa cells with pre-miR-10a and -10b as compared with NC pre-miR. C, Western blot analysis of SFRS1 protein expression in HeLa cells after transfection of NC pre-miR, pre-miR-10a, or pre-miR-10b. The blot was reprobed with β-actin antibodies as the loading control. D, RT-qPCR analysis of SFRS1 mRNA expression under the same conditions is shown. The graph shows expression levels relative to those of cells transfected with NC-pre-miR (mean ± S.D. of a triplicate experiment). E, shown is a Western blot of SFRS1 protein expression after pre-miR-10a and -10b and NC-pre-miR transfection of SH-SY5Y cells. The blot was reprobed with β-actin antibodies as loading control. F, RT-qPCR analysis of SFRS1 mRNA levels under the same conditions is shown. The graph shows expression levels relative to those of RA-untreated, NC-pre-miR-transfected cells (mean ± S.D. of a triplicate experiment). Statistical analysis for panels A, B, D, and F was made by comparing the values from cells transfected with pre-miR-10a or -10b to those from cells transfected with NC-pre-miR; ns, not significant.
Experimental Alteration of miR-10a and -10b Expression Levels Impaired the Functions of SFRS1 in the Regulation of Alternative Splicing and Specific mRNA Translation
SFRS1 (SF2/ASF) has important functions in the regulation of alternative splicing and in enhancing translation initiation of mRNAs containing specific SFRS1 binding sequences (34, 62, 63). We wanted to evaluate whether regulation mediated by miR-10a and -10b through the alteration of SFRS1 protein levels could result in altered regulation of the functional processes where SFRS1 is involved. SFRS1 participates in the regulation of alternative splicing of tau exon 10 through an exonic splicing element, and this splicing event is altered in specific pathological situations (64). Reduction of SFRS1 levels by transfection of pre-miR-10a and -10b to SH-SY5Y neuroblastoma cells resulted in a reduction of the inclusion of exon 10, as shown by RT-PCR with specific tau exon 10-flanking primers (Fig. 9, A and B). To test the influence of miR-10a and -10b regulation on SFRS1-dependent translational enhancement, we used a translation reporter containing a luciferase coding sequence harboring the exonic splicing enhancer (ESE) from the fibronectin extra domain A (EDA-ESE; pLCS-EDA) or a mutant version of the ESE (pLCS-EDAmt) that does not bind SFRS1 (Fig. 9C and Ref. 34). HeLa cells were co-transfected with pLCS-EDA or pLCS-EDAmt together with pre-miR-10a, pre-miR-10b, or negative control pre-miR. The relative luciferase activity from pLCS-EDA over that obtained from pLCS-EDAmt in a parallel experiment was measured. The effect of the EDA exonic splicing enhancer results in a close to 5-fold enhancement of translation. Transfection of pre-miR-10a and -10b produced a severe reduction in reporter gene translation (approximately to 40%), whereas transfection of control pre-miR did not affect reporter translation (Fig. 9D). Our results are compatible with a reduction of the alternative splicing enhancement and translation activation functions through reduced SFRS1 levels mediated by increased miR-10a or -10b levels.
FIGURE 9.

Experimental alteration of miR-10a and -10b levels resulted in an impairment of SFRS1 functions in the regulation of alternative splicing and specific mRNA translation. A, alternative splicing of tau protein exon 10 is altered by transfection of anti-miR-10a and -10b. RT-PCR was performed on RNA extracted from anti-miR-10a and -10b or NC anti-miR-transfected SH-SY5Y cells. tau Exon 10 flanking primers were used in the RT-PCR reaction according to Kondo et al. (64). B, quantification of the percentage of exon 10 inclusion is shown. The graph shows the value (mean ± S.D.) from three independent experiments. Statistical analysis was made by comparing the values from cells transfected with pre-miR-10a or -10b to those from cells transfected with NC-pre-miR. C, a schematic representation of the reporter genes used for the analysis of mRNA translation regulation is shown (adapted from Sanford et al. (34)). D, the effect of the alteration of miR-10a and -10b levels on the translation of the LCS-EDA luciferase reporters is shown. Neuroblastoma cells were transfected in parallel reactions with either the LCS-EDA or the LCS-EDAmt Luciferase reporters and the corresponding pre-miR-10a and -10b or NC-pre-miR together with a promoter-less Renilla luciferase reporter as internal control. After transfection, luciferase activities were determined, and the ratio between the normalized activities of the LCS-EDA and the LCS-EDAmt reporters is represented in the graph for the different transfection groups (mean ± S.D. of two triplicate experiments). Statistical analysis was made by comparing the values from cells transfected with pre-miR-10a or -10b to those from cells transfected with NC-pre-miR.
DISCUSSION
The discovery of a new class of regulatory elements named microRNAs have contributed to add a new level of complexity in the regulation of many biological processes, including neuronal differentiation. Despite impressive progress made during the last years in elucidating the molecular mechanisms of RA-mediated transcriptional regulation, little is known about the influence of RA signaling on microRNA regulation. In this study we have identified 42 different miRNA species that significantly change their expression levels (26 up-regulated and 16 down-regulated) during RA treatment of the SH-SY5Y neuroblastoma cell line, which is considered a good model for studying neuronal differentiation. After studying the reported aspects of the members of this miRNA set, we have found that some miRNA species (miR-10a, -10b, -132, -212, 211, -22, -154,-26, -296, -422a, -378, and -107) reportedly participate in differentiation in several contexts (65–74), although only miR-132/212 seems up to now to be specifically involved in neuronal differentiation (6, 72, 75). We have focused on the functional study of two closely related microRNAs, miR-10a and -10b, that showed the most prominent up-regulation upon RA treatment. Up-regulation of miR-10b was previously reported in RA-induced neuronal differentiation of human embryonal carcinoma NT2/D1 cells (76), and an increase in miR-10a could be detected during RA-induced differentiation of mouse embryonic stem cells into smooth muscle cells (68). This work reports that RA acts through NF-κB binding to a consensus element in miR-10a gene promoter to induce miR-10a expression. In addition, some putative consensus RA regulatory elements could be detected in the promoter regions of miR-10a and -10b genes (data not shown). All this evidence suggests that RA signaling might be involved in miR-10a and -10b regulation. Our analysis of the functional effects of miR-10a and -10b knockdown showed that miR-10a and -10b are key players in the regulation of RA-induced differentiation. We have seen that both morphological changes associated with RA differentiation and the regulation of the expression of some differentiation markers were impaired in RA-treated and anti-miR-10a and -10b-transfected cells. Additionally, we have demonstrated that miR-10a and -10b expression was necessary for the associated reduction in migratory and invasive and metastatic activities. Although some reports indicate that miR-10a and -10b have a role in cancer pathogenesis and metastatic spread (57, 77, 78), our findings together with another study (79) give support to the idea that miR-10a and -10b could act as tumor suppressor genes that opposite to tumor malignancy.
On the basis of our results, we have confirmed the SR-family splicing factor 1, SFRS1 (SF2/ASF), as a novel target for miR-10a and -10b action. SFRS1 is a proto-oncogene with deregulated expression in many tumors, and its expression, like in other splicing factors, seems to be fine-regulated by multiple post-transcriptional and translational mechanisms (80). In this context, a recent publication described the increased complexity of SFRS1 regulation by the existence of a negative feedback loop in which SF2/ASF may promote miR-7 processing and mature miR-7 could bind to the 3′-UTR of SF2/ASF to repress its translation (81). Here we propose miR-10a and -10b as new players in the complex regulation of SFRS1 protein through a mechanism involving enhanced mRNA cleavage. In addition, we showed how changes in miR-10a and -10b expression levels may influence some molecular activities in which SFRS1 is involved, such as translation enhancement of certain mRNAs and alternative splicing. In this context, first using a transfection-based translation reporter assay, we have shown how SFRS1 activity in translation could be controlled by regulation of miR-10a and -10b levels. However, this is not the first evidence that provides miR-10a a role in regulating translation. It has already been reported that miR-10a may bind to the 5′-UTRs of ribosomal protein mRNAs and enhance their translation and, in consequence, global protein synthesis under the conditions of amino acid starvation or translational induction after anisomycin treatment or overexpression of RAS (82). Our findings and the previous work suggest a special role of miR-10a in controlling translation of some mRNAs through negative regulation of the SFRS1 protein level via 3′-UTR mRNA binding or positive regulation of the ribosomal protein level via 5′-UTR mRNA binding depending on the cellular context. We have also reported that the activation of signaling pathways by RA treatment results in rapid changes in the phosphorylation pattern of SR proteins, including SFRS1. Subsequently, changes in alternative splicing selection and an increase of the translation of mRNAs containing SFRS1 binding sites take place (35). In this context the reduction in SFRS1 levels induced through miR-10a and -10b regulation could be interpreted as the closing of the feedback regulatory loop of RA on the activities of SFRS1.
Moreover, we reported how a splicing event in the tau gene, in which the exon 10 is included, could be altered by regulation of miR-10a and -10b levels. This result demonstrated once more that SFRS1 protein level needs to be precisely controlled during its activities for normal cell physiology. In this sense, post-transcriptional regulatory mechanisms are considered to be responsible of the diversification and spatiotemporal control of the proteome during the establishment of precise neuronal connectivity (83). Because an mRNA is transcribed, it is subjected to different molecular processes that include extensive structural regulation to expand the protein repertory through alternative splicing, RNA packing into neuronal transport granules, and recognition by RNA-binding proteins and/or microRNAs, which gives the possibility of restricting protein synthesis to selective locations and under specific input conditions. This ability of the post-transcriptional machinery to control the usage of proteins in spatial and temporal manner suggests the existence of a coordinated cross-talk between all the post-transcriptional processes. Consistent with this idea, several studies confirmed the presence of a splicing-microRNA interaction during differentiation (84, 85). For instance, it has been reported that the neuron-specific microRNA miR-124 directly targets PTBP1 mRNA, which it is a global repressor of alternative pre-mRNA splicing in non-neuronal cells, resulting in the transition from non-neural-specific to neural-specific alternative splicing patterns (85). Therefore, the changes in the levels of SFRS1 would contribute to the establishment of a neural-specific alternative splicing pattern and, therefore, to neural differentiation. Supporting this idea, we have shown that reducing SFRS1 mRNA levels due to the up-regulation miR-10a and -10b expression may affect functions involved in the establishment of a specific gene expression program during RA-induced differentiation of SH-SY5Y cells.
In summary, we have shown that exposure of neuroblastoma cells to RA causes prominent changes in miRNA expression. Two close related miRNAs, miR-10a and -10b, showed a robust induction and appeared to be important in RA-induced differentiation and in the associated changes in migratory and invasive activities. The discovery of SFRS1 as direct target of miR-10a and -10b support the emerging functional interaction between two post-transcriptional mechanisms, microRNAs and splicing, in the neuronal differentiation context.
Supplementary Material
Acknowledgments
We are indebted to Dr. J. F. Caceres (Edinburgh, Scotland, UK) for the gift of plasmids pLCS-EDAwt and pLCS-EDAmt.
This work was supported by Spanish former Ministry of Education and Science and Ministry of Science and Innovation Grants SAF2006–00647 and SAF2007–60780 and Generalitat Valenciana (ACOMP 09/212) and Genoma España (to D. B.) and by the Alfried Krupp von Bohlen und Halbach Foundation (Award for Young Full Professors) (Essen), Hella-Bühler-Foundation (Heidelberg), Dr. Ingrid zu Solms Foundatio (Frankfurt/Main), the Hector Foundation (Weinheim), the FRONTIER Excellence Initiative of the University of Heidelberg, the Federal Ministry of Education and Research (BMBF), Germany, and the Walter Schulz Foundation, Munich, Germany (to H. A.). This work was also supported by an European Association for Cancer Research training and travel fellowship award (to S. M.) for the purpose of training in microRNA research.

The on-line version of this article (available at http://www.jbc.org) contains supplemental Figs. S1–S3.
S. Meseguer, N. Ruiz, and D. Barettino, unpublished results.
- miRNA and miR
- microRNA
- anti-miR
- anti-sense miR
- pre-miR
- precursor-miR
- RA
- retinoic acid
- EDA
- extra domain A
- SF2/ASF
- splicing factor 2/alternative splicing factor
- SR
- serine/arginine-rich splicing factors
- SFRS1
- SR-family splicing factor 1
- NC
- negative control
- qPCR
- quantitative PCR.
REFERENCES
- 1. Bartel D. P. (2004) Cell 116, 281–297 [DOI] [PubMed] [Google Scholar]
- 2. Chekulaeva M., Filipowicz W. (2009) Curr. Opin. Cell Biol. 21, 452–460 [DOI] [PubMed] [Google Scholar]
- 3. Miska E. A., Alvarez-Saavedra E., Townsend M., Yoshii A., Sestan N., Rakic P., Constantine-Paton M., Horvitz H. R. (2004) Genome Biol. 5, R68 [DOI] [PMC free article] [PubMed] [Google Scholar]
- 4. Lau P., Hudson L. D. (2010) Brain Res. 1338, 14–19 [DOI] [PMC free article] [PubMed] [Google Scholar]
- 5. Huang T., Liu Y., Huang M., Zhao X., Cheng L. (2010) J. Mol. Cell Biol. 2, 152–163 [DOI] [PubMed] [Google Scholar]
- 6. Wu J., Xie X. (2006) Genome Biol. 7, R85 [DOI] [PMC free article] [PubMed] [Google Scholar]
- 7. Vo N., Klein M. E., Varlamova O., Keller D. M., Yamamoto T., Goodman R. H., Impey S. (2005) Proc. Natl. Acad. Sci. U.S.A. 102, 16426–16431 [DOI] [PMC free article] [PubMed] [Google Scholar]
- 8. Shenouda S. K., Alahari S. K. (2009) Cancer Metastasis Rev. 28, 369–378 [DOI] [PubMed] [Google Scholar]
- 9. Garzon R., Calin G. A., Croce C. M. (2009) Annu. Rev. Med. 60, 167–179 [DOI] [PubMed] [Google Scholar]
- 10. Baranwal S., Alahari S. K. (2010) Int. J. Cancer 126, 1283–1290 [DOI] [PMC free article] [PubMed] [Google Scholar]
- 11. Cho W. C. (2010) Biochim. Biophys. Acta 1805, 209–217 [DOI] [PubMed] [Google Scholar]
- 12. Hurst D. R., Edmonds M. D., Welch D. R. (2009) Cancer Res. 69, 7495–7498 [DOI] [PMC free article] [PubMed] [Google Scholar]
- 13. Petrocca F., Lieberman J. (2009) RNA Biol. 6, 335–340 [DOI] [PubMed] [Google Scholar]
- 14. Trang P., Weidhaas J. B., Slack F. J. (2008) Oncogene 27, S52–S57 [DOI] [PMC free article] [PubMed] [Google Scholar]
- 15. Brodeur G. M. (2003) Nat. Rev. Cancer 3, 203–216 [DOI] [PubMed] [Google Scholar]
- 16. Mueller S., Matthay K. K. (2009) Curr. Oncol. Rep. 11, 431–438 [DOI] [PubMed] [Google Scholar]
- 17. Sidell N. (1982) J. Natl. Cancer Inst. 68, 589–596 [PubMed] [Google Scholar]
- 18. Påhlman S., Ruusala A. I., Abrahamsson L., Mattsson M. E., Esscher T. (1984) Cell Differ. 14, 135–144 [DOI] [PubMed] [Google Scholar]
- 19. Thiele C. J., Reynolds C. P., Israel M. A. (1985) Nature 313, 404–406 [DOI] [PubMed] [Google Scholar]
- 20. Tsokos M., Scarpa S., Ross R. A., Triche T. J. (1987) Am. J. Pathol. 128, 484–496 [PMC free article] [PubMed] [Google Scholar]
- 21. Giannini G., Dawson M. I., Zhang X., Thiele C. J. (1997) J. Biol. Chem. 272, 26693–26701 [DOI] [PubMed] [Google Scholar]
- 22. Voigt A., Zintl F. (2003) Med. Pediatr. Oncol. 40, 205–213 [DOI] [PubMed] [Google Scholar]
- 23. Joshi S., Guleria R., Pan J., DiPette D., Singh U. S. (2006) Oncogene 25, 240–247 [DOI] [PubMed] [Google Scholar]
- 24. Matthay K. K., Reynolds C. P. (2000) Br. J. Cancer 83, 1121–1123 [DOI] [PMC free article] [PubMed] [Google Scholar]
- 25. Matthay K. K., Reynolds C. P., Seeger R. C., Shimada H., Adkins E. S., Haas-Kogan D., Gerbing R. B., London W. B., Villablanca J. G. (2009) J Clin. Oncol. 27, 1007–1013 [DOI] [PMC free article] [PubMed] [Google Scholar]
- 26. Matthay K. K., Villablanca J. G., Seeger R. C., Stram D. O., Harris R. E., Ramsay N. K., Swift P., Shimada H., Black C. T., Brodeur G. M., Gerbing R. B., Reynolds C. P. (1999) N. Engl. J. Med. 341, 1165–1173 [DOI] [PubMed] [Google Scholar]
- 27. Chen Y., Stallings R. L. (2007) Cancer Res. 67, 976–983 [DOI] [PubMed] [Google Scholar]
- 28. Welch C., Chen Y., Stallings R. L. (2007) Oncogene 26, 5017–5022 [DOI] [PubMed] [Google Scholar]
- 29. Schulte J. H., Horn S., Otto T., Samans B., Heukamp L. C., Eilers U. C., Krause M., Astrahantseff K., Klein-Hitpass L., Buettner R., Schramm A., Christiansen H., Eilers M., Eggert A., Berwanger B. (2008) Int. J. Cancer 122, 699–704 [DOI] [PubMed] [Google Scholar]
- 30. Schulte J. H., Horn S., Schlierf S., Schramm A., Heukamp L. C., Christiansen H., Buettner R., Berwanger B., Eggert A. (2009) Cancer Lett. 274, 10–15 [DOI] [PubMed] [Google Scholar]
- 31. Buckley P. G., Alcock L., Bryan K., Bray I., Schulte J. H., Schramm A., Eggert A., Mestdagh P., De Preter K., Vandesompele J., Speleman F., Stallings R. L. (2010) Clin. Cancer Res. 16, 2971–2978 [DOI] [PMC free article] [PubMed] [Google Scholar]
- 32. Schulte J. H., Marschall T., Martin M., Rosenstiel P., Mestdagh P., Schlierf S., Thor T., Vandesompele J., Eggert A., Schreiber S., Rahmann S., Schramm A. (2010) Nucleic Acids Res. 38, 5919–5928 [DOI] [PMC free article] [PubMed] [Google Scholar]
- 33. Schulte J. H., Schowe B., Mestdagh P., Kaderali L., Kalaghatgi P., Schlierf S., Vermeulen J., Brockmeyer B., Pajtler K., Thor T., de Preter K., Speleman F., Morik K., Eggert A., Vandesompele J., Schramm A. (2010) Int. J. Cancer 127, 2374–2385 [DOI] [PubMed] [Google Scholar]
- 34. Sanford J. R., Gray N. K., Beckmann K., Cáceres J. F. (2004) Genes Dev. 18, 755–768 [DOI] [PMC free article] [PubMed] [Google Scholar]
- 35. Laserna E. J., Valero M. L., Sanz L., Sánchez del Pino M. M., Calvete J. J., Barettino D. (2009) Mol. Endocrinol. 23, 1799–1814 [DOI] [PMC free article] [PubMed] [Google Scholar]
- 36. Martí D., Miquel R., Ziani K., Gisbert R., Ivorra M. D., Anselmi E., Moreno L., Villagrasa V., Barettino D., D'Ocon P. (2005) Am. J. Physiol. Heart Circ. Physiol. 289, H1923–H1932 [DOI] [PubMed] [Google Scholar]
- 37. Masiá S., Alvarez S., de Lera A. R., Barettino D. (2007) Mol. Endocrinol. 21, 2391–2402 [DOI] [PubMed] [Google Scholar]
- 38. McCarthy J. B., Palm S. L., Furcht L. T. (1983) J. Cell Biol. 97, 772–777 [DOI] [PMC free article] [PubMed] [Google Scholar]
- 39. Albini A., Iwamoto Y., Kleinman H. K., Martin G. R., Aaronson S. A., Kozlowski J. M., McEwan R. N. (1987) Cancer Res. 47, 3239–3245 [PubMed] [Google Scholar]
- 40. Zijlstra A., Mellor R., Panzarella G., Aimes R. T., Hooper J. D., Marchenko N. D., Quigley J. P. (2002) Cancer Res. 62, 7083–7092 [PubMed] [Google Scholar]
- 41. Mudduluru G., Vajkoczy P., Allgayer H. (2010) Mol. Cancer Res. 8, 159–169 [DOI] [PubMed] [Google Scholar]
- 42. van der Horst E. H., Leupold J. H., Schubbert R., Ullrich A., Allgayer H. (2004) Biotechniques 37, 940–942, 944,, 946 [DOI] [PubMed] [Google Scholar]
- 43. Meijering E., Jacob M., Sarria J. C., Steiner P., Hirling H., Unser M. (2004) Cytometry A 58, 167–176 [DOI] [PubMed] [Google Scholar]
- 44. Tahira T., Ishizaka Y., Itoh F., Nakayasu M., Sugimura T., Nagao M. (1991) Oncogene 6, 2333–2338 [PubMed] [Google Scholar]
- 45. Kaplan D. R., Matsumoto K., Lucarelli E., Thiele C. J. (1993) Neuron 11, 321–331 [DOI] [PubMed] [Google Scholar]
- 46. Encinas M., Iglesias M., Liu Y., Wang H., Muhaisen A., Ceña V., Gallego C., Comella J. X. (2000) J. Neurochem. 75, 991–1003 [DOI] [PubMed] [Google Scholar]
- 47. Yamada S., Nomura T., Uebersax L., Matsumoto K., Fujita S., Miyake M., Miyake J. (2007) Neuroreport 18, 359–363 [DOI] [PubMed] [Google Scholar]
- 48. Oppenheimer O., Cheung N. K., Gerald W. L. (2007) Mol. Cancer Ther. 6, 1300–1309 [DOI] [PubMed] [Google Scholar]
- 49. Esposito C. L., D'Alessio A., de Franciscis V., Cerchia L. (2008) PLoS One 3, e1643 [DOI] [PMC free article] [PubMed] [Google Scholar] [Retracted]
- 50. López-Carballo G., Moreno L., Masiá S., Pérez P., Barettino D. (2002) J. Biol. Chem. 277, 25297–25304 [DOI] [PubMed] [Google Scholar]
- 51. Perk J., Iavarone A., Benezra R. (2005) Nat. Rev. Cancer 5, 603–614 [DOI] [PubMed] [Google Scholar]
- 52. Ciarapica R., Annibali D., Raimondi L., Savino M., Nasi S., Rota R. (2009) Oncogene 28, 1881–1891 [DOI] [PubMed] [Google Scholar]
- 53. Jögi A., Persson P., Grynfeld A., Påhlman S., Axelson H. (2002) J. Biol. Chem. 277, 9118–9126 [DOI] [PubMed] [Google Scholar]
- 54. Ino M., Cole G. M., Timiras P. S. (1986) Brain Res. 395, 120–123 [DOI] [PubMed] [Google Scholar]
- 55. Jeong H., Kim M. S., Kim S. W., Kim K. S., Seol W. (2006) J. Neurochem. 98, 386–394 [DOI] [PubMed] [Google Scholar]
- 56. Ma L., Reinhardt F., Pan E., Soutschek J., Bhat B., Marcusson E. G., Teruya-Feldstein J., Bell G. W., Weinberg R. A. (2010) Nat. Biotechnol. 28, 341–347 [DOI] [PMC free article] [PubMed] [Google Scholar]
- 57. Ma L., Teruya-Feldstein J., Weinberg R. A. (2007) Nature 449, 682–688 [DOI] [PubMed] [Google Scholar]
- 58. John B., Enright A. J., Aravin A., Tuschl T., Sander C., Marks D. S. (2004) PLoS Biol. 2, e363 [DOI] [PMC free article] [PubMed] [Google Scholar]
- 59. Griffiths-Jones S., Saini H. K., van Dongen S., Enright A. J. (2008) Nucleic Acids Res. 36, D154–D158 [DOI] [PMC free article] [PubMed] [Google Scholar]
- 60. Lewis B. P., Shih I. H., Jones-Rhoades M. W., Bartel D. P., Burge C. B. (2003) Cell 115, 787–798 [DOI] [PubMed] [Google Scholar]
- 61. Krek A., Grün D., Poy M. N., Wolf R., Rosenberg L., Epstein E. J., MacMenamin P., da Piedade I., Gunsalus K. C., Stoffel M., Rajewsky N. (2005) Nat. Genet. 37, 495–500 [DOI] [PubMed] [Google Scholar]
- 62. Michlewski G., Sanford J. R., Cáceres J. F. (2008) Mol. Cell 30, 179–189 [DOI] [PubMed] [Google Scholar]
- 63. Long J. C., Caceres J. F. (2009) Biochem. J. 417, 15–27 [DOI] [PubMed] [Google Scholar]
- 64. Kondo S., Yamamoto N., Murakami T., Okumura M., Mayeda A., Imaizumi K. (2004) Genes Cells 9, 121–130 [DOI] [PubMed] [Google Scholar]
- 65. Choong M. L., Yang H. H., McNiece I. (2007) Exp. Hematol. 35, 551–564 [DOI] [PubMed] [Google Scholar]
- 66. Garzon R., Pichiorri F., Palumbo T., Iuliano R., Cimmino A., Aqeilan R., Volinia S., Bhatt D., Alder H., Marcucci G., Calin G. A., Liu C. G., Bloomfield C. D., Andreeff M., Croce C. M. (2006) Proc. Natl. Acad. Sci. U.S.A. 103, 5078–5083 [DOI] [PMC free article] [PubMed] [Google Scholar]
- 67. Garzon R., Pichiorri F., Palumbo T., Visentini M., Aqeilan R., Cimmino A., Wang H., Sun H., Volinia S., Alder H., Calin G. A., Liu C. G., Andreeff M., Croce C. M. (2007) Oncogene 26, 4148–4157 [DOI] [PubMed] [Google Scholar]
- 68. Huang H., Xie C., Sun X., Ritchie R. P., Zhang J., Chen Y. E. (2010) J. Biol. Chem. 285, 9383–9389 [DOI] [PMC free article] [PubMed] [Google Scholar]
- 69. Kahai S., Lee S. C., Lee D. Y., Yang J., Li M., Wang C. H., Jiang Z., Zhang Y., Peng C., Yang B. B. (2009) PLoS One 4, e7535 [DOI] [PMC free article] [PubMed] [Google Scholar]
- 70. Li Z., Hassan M. Q., Jafferji M., Aqeilan R. I., Garzon R., Croce C. M., van Wijnen A. J., Stein J. L., Stein G. S., Lian J. B. (2009) J. Biol. Chem. 284, 15676–15684 [DOI] [PMC free article] [PubMed] [Google Scholar]
- 71. Palmieri A., Pezzetti F., Brunelli G., Martinelli M., Lo Muzio L., Scarano A., Degidi M., Piattelli A., Carinci F. (2008) Implant Dent. 17, 100–108 [DOI] [PubMed] [Google Scholar]
- 72. Remenyi J., Hunter C. J., Cole C., Ando H., Impey S., Monk C. E., Martin K. J., Barton G. J., Hutvagner G., Arthur J. S. (2010) Biochem. J. 428, 281–291 [DOI] [PubMed] [Google Scholar]
- 73. Tay Y., Zhang J., Thomson A. M., Lim B., Rigoutsos I. (2008) Nature 455, 1124–1128 [DOI] [PubMed] [Google Scholar]
- 74. Ting Y., Medina D. J., Strair R. K., Schaar D. G. (2010) Biochem. Biophys. Res. Commun. 394, 606–611 [DOI] [PubMed] [Google Scholar]
- 75. Nudelman A. S., DiRocco D. P., Lambert T. J., Garelick M. G., Le J., Nathanson N. M., Storm D. R. (2010) Hippocampus 20, 492–498 [DOI] [PMC free article] [PubMed] [Google Scholar]
- 76. Lee N. S., Kim J. S., Cho W. J., Lee M. R., Steiner R., Gompers A., Ling D., Zhang J., Strom P., Behlke M., Moon S. H., Salvaterra P. M., Jove R., Kim K. S. (2008) Biochem. Biophys. Res. Commun. 377, 434–440 [DOI] [PubMed] [Google Scholar]
- 77. Veerla S., Lindgren D., Kvist A., Frigyesi A., Staaf J., Persson H., Liedberg F., Chebil G., Gudjonsson S., Borg A., Månsson W., Rovira C., Höglund M. (2009) Int. J. Cancer 124, 2236–2242 [DOI] [PubMed] [Google Scholar]
- 78. Weiss F. U., Marques I. J., Woltering J. M., Vlecken D. H., Aghdassi A., Partecke L. I., Heidecke C. D., Lerch M. M., Bagowski C. P. (2009) Gastroenterology 137, 2136–2145 [DOI] [PubMed] [Google Scholar]
- 79. Moriarty C. H., Pursell B., Mercurio A. M. (2010) J. Biol. Chem. 285, 20541–20546 [DOI] [PMC free article] [PubMed] [Google Scholar]
- 80. Sun S., Zhang Z., Sinha R., Karni R., Krainer A. R. (2010) Nat. Struct. Mol. Biol. 17, 306–312 [DOI] [PMC free article] [PubMed] [Google Scholar]
- 81. Wu H., Sun S., Tu K., Gao Y., Xie B., Krainer A. R., Zhu J. (2010) Mol. Cell 38, 67–77 [DOI] [PMC free article] [PubMed] [Google Scholar]
- 82. Ørom U. A., Nielsen F. C., Lund A. H. (2008) Mol. Cell 30, 460–471 [DOI] [PubMed] [Google Scholar]
- 83. Loya C. M., Van Vactor D., Fulga T. A. (2010) Genes Dev. 24, 625–635 [DOI] [PMC free article] [PubMed] [Google Scholar]
- 84. Boutz P. L., Chawla G., Stoilov P., Black D. L. (2007) Genes. Dev. 21, 71–84 [DOI] [PMC free article] [PubMed] [Google Scholar]
- 85. Makeyev E. V., Zhang J., Carrasco M. A., Maniatis T. (2007) Mol. Cell 27, 435–448 [DOI] [PMC free article] [PubMed] [Google Scholar]
Associated Data
This section collects any data citations, data availability statements, or supplementary materials included in this article.