Abstract
The heterotrimeric, G protein-coupled receptor-associated G protein, Gαs, binds tubulin with nanomolar affinity and disrupts microtubules in cells and in vitro. Here we determine that the activated form of Gαs binds tubulin with a KD of 100 nm, stimulates tubulin GTPase, and promotes microtubule dynamic instability. Moreover, the data reveal that the α3–β5 region of Gαs is a functionally important motif in the Gαs-mediated microtubule destabilization. Indeed, peptides corresponding to that region of Gαs mimic Gαs protein in activating tubulin GTPase and increase microtubule dynamic instability. We have identified specific mutations in peptides or proteins that interfere with this process. The data allow for a model of the Gαs/tubulin interface in which Gαs binds to the microtubule plus-end and activates the intrinsic tubulin GTPase. This model illuminates both the role of tubulin as an “effector” (e.g. adenylyl cyclase) for Gαs and the role of Gαs as a GTPase activator for tubulin. Given the ability of Gαs to translocate intracellularly in response to agonist activation, Gαs may play a role in hormone- or neurotransmitter-induced regulation of cellular morphology.
Keywords: G Protein-coupled Receptors (GPCR), G Proteins, Microtubules, Peptides, Tubulin, Cytoskeleton, GTPase, Galphas
Introduction
Microtubules are dynamic polymers composed of α-β tubulin dimers with kinetically and structurally distinct plus- and minus-ends. Both subunits contain guanine nucleotides. GTP, in the α subunit, is non-exchangeable and non-hydrolyzable. However, GTP in the β subunit, which is exposed at the dynamic plus-ends, is exchangeable and hydrolyzable (it can exchange the GDP with GTP present in the reaction mixture or in the intracellular milieu). Microtubules assemble by the sequential addition of tubulin-GTP to the ends. Newly added tubulin-GTP catalyzes the hydrolysis of GTP to GDP, creating a very short GTP (or GDP-Pi)-tubulin “cap” at the ends and a core of GDP-tubulin (1). This cap at the microtubule tip stabilizes the entire microtubule and prevents rapid disassembly. Loss of the stabilizing cap results in an abrupt switching of an end from growth to shortening, called a catastrophe.
Regulated assembly and disassembly of microtubules play pivotal roles in the genesis, maintenance, and functioning of the nervous system (2). In particular, dynamic microtubules are located in regions of high neuronal plasticity, such as the tips of growing neurites and immature dendritic spines (3–5). How the dynamics of microtubules at their plus-ends is regulated to enable them to perform their diverse cellular functions in the nervous system and elsewhere is a central question in cell biology.
Heterotrimeric guanine nucleotide-binding proteins (G proteins) transduce extracellular neurotransmitter (or hormone) stimuli into intracellular signaling cascades. In response to hormone or neurotransmitter activation of G protein-coupled receptors, the Gα and Gβγ subunits functionally dissociate, and the inactive Gα exchanges its GDP for GTP, resulting in active Gα-GTP. Active Gα subunits exert intracellular effects by stimulating effectors, such as (in the case of Gαs) adenylyl cyclase, which generates cyclic AMP from ATP. In addition to stimulating adenylyl cyclase, G proteins also directly affect microtubule stability (6–8). For example, in cells, activation of Gαs and the attendant increase in cAMP have been suggested to modulate microtubule dynamics and neurite outgrowth (6, 9). Moreover, active G proteins can promote neurite outgrowth independently of cAMP by directly binding to microtubules (6). Activation of G protein-coupled receptors by hormones or neurotransmitters evokes translocation of Gαs from G protein-coupled receptors into lipid rafts (10). Gαs then internalizes, and the intracellular Gαs interacts with microtubules and destabilizes microtubules, leading to neurite outgrowth (6). Supporting this argument, Gαs binds tubulin from rat brain extracts and binds with nanomolar affinity in vitro and co-immunoprecipitates tubulin from rat brains (11–13). In addition, in vitro studies have shown that Gα subunits increase microtubule dynamics, possibly by acting as a GTPase-activating protein (6, 8). It has been proposed that Gα binds to the plus-ends of microtubules and destroys the stabilizing GTP (GDP-Pi) cap, allowing for increased microtubule dynamics (6, 8). Recent modeling studies of tubulin-Gαs interactions support this possibility (13). Although the cellular effects of Gαs activation on microtubules and neuronal outgrowth have been described (6), the molecular and structural mechanisms by which Gαs destabilizes microtubules remain unclear.
The purpose of the current study was to elucidate the mechanism by which Gαs increases dynamic instability and thus destabilizes microtubules. We show that active Gαs increases microtubule dynamics in association with stimulation of tubulin GTPase activity. Further, using a combination of biochemical and computational approaches, we identify the α3–β5 region as the functionally important structural motif in Gαs that is involved in the G protein-mediated alteration of microtubule dynamics. In addition, we find that peptides derived from this motif mimic the effects of Gαs on both tubulin GTPase and microtubule dynamics. These peptides or small molecules based on them may lead to novel therapeutic agents for promoting neuronal outgrowth and differentiation in vivo.
EXPERIMENTAL PROCEDURES
Materials
His-GαsWT and His-GαsQ227L in pRSET plasmids were obtained from Dr. Tarun Patel (Loyola University, Maywood, IL). Peptides were custom synthesized by the University of Illinois Chicago Protein Research Laboratory. Peptide sequences are as follows: KQLQKDKQVYRATHR (peptide N), EDAEKDARVYRATVK (peptide GtN), LNLFKSIWNNRWLRT (peptide 3), LHLFNSICNHRYFAT (peptide-Gt3), LHLFNSIWNNRWLRT (peptide M1), LNLFKSICNHRWLRT (peptide M2), LNLFKSIWNNRYFAT (peptide M3), LHLFNSIWNNRYFAT (peptide M5), and LNLFKSICNHRYFAT (peptide M6). Radiochemicals were obtained from MP Biochemicals (Irvine, CA).
Mutagenesis
Mutagenesis was performed using the QuikChange kit (Stratagene, La Jolla, CA), following the manufacturer's protocol. Gαs-Gαt chimeras were created (see supplemental Table 1) by mutating His-GαsWT in a pRSET plasmid, and final products were confirmed by DNA sequencing (UIC Research Resources Center) from both the 5′- and 3′-ends.
Protein Purification
Recombinant His-Gαs and mutated proteins were purified using previously published methods (14, 15). Induction conditions, optimized to maximize soluble protein expression, were as follows: GαsQ227L (hereafter referred to as GαsQL), 20 h at 15 °C, 17 h at 25 °C; GαsGtLoop/Q227L (hereafter referred to as GαsGtL/QL), 20 h at 25 °C. The function of GαsWT was tested by assessing the change in tryptophan fluorescence of Gαs in response to binding AlF4− (16). Gαs-GDP was generated by incubating GαsWT with 5 mm MgCl2 for 1 h at 37 °C.
Ovine and bovine tubulin were purified using two polymerization-depolymerization cycles followed by phosphocellulose chromatography and stored in PEM buffer (100 mm PIPES, 1 mm MgCl2, 1 mm EDTA, pH 6.8) (17, 18). Tubulin was stored in liquid nitrogen until use. Bovine brain tubulin was used in dynamics and polymer mass assays, and ovine brain tubulin was used in all other experiments.
Surface Plasmon Resonance (Biacore 1000)
Quantitative analyses of peptide/protein-tubulin interactions were performed on a BIAcore 1000 system (GE Healthcare). To determine Gαs-tubulin affinity, tubulin was immobilized on a carboxymethyl dextran-coated CM5 BIAcore sensor chip, and Gαs was allowed to bind. Tubulin was immobilized in HBS-P buffer, pH 7.4 (10 mm HEPES, 150 mm NaCl, and 0.005% (v/v) surfactant P-20) at a flow rate of 10 μl/min on sensor chip CM5.
His-GαsQ227L or His-GαsWT was exchanged into BIAcore buffer twice (10 mm HEPES, 150 mm NaCl, 0.005% P-20, pH 6.9) using protein desalting columns (7 kDa cut-off; Pierce). The Gαs proteins or peptides were allowed to bind to immobilized tubulin at 25 °C (10 min for proteins; 100 s for peptides), followed by 15 min of dissociation at a 10 μl/min flow rate in buffer. To achieve complete removal of bound Gαs, flow cells were injected twice with a regeneration solution (0.5% Triton X-100 in 1 m NaCl in HBS-P buffer) for 15 s at 30 μl/min, followed by an “extraclean” step after each regeneration. Regeneration conditions were optimized to maintain tubulin stability while removing most of the bound G protein or peptide. Each sample was injected into a reference flow cell to control for nonspecific binding. A buffer-only tube was run between every 2–3 tubes.
The final kinetic curves were obtained by first subtracting the blank condition and then subtracting the reference flow cell curves. The resulting curve was fit to a 1:1 Langmuir kinetic association model with drifting base line, per manufacturer's instructions. The calculated base-line drift was within the specifications of the instrument, and χ2 values were <2.0. We used ovalbumin as the control. Ovalbumin did not detectably bind tubulin (1 μm) under this condition. Statistical analyses were performed using BIAEvaluation 4.1 and GraphPad Prism 4.0 software.
Single Turnover Tubulin GTPase Activity Assay
A single turnover GTPase activity assay was performed as described previously (19). Briefly, [γ-32P]GTP (450 mCi/mol) was exchanged onto 2 μm tubulin on ice (PEM buffer), and unbound [32P]GTP was removed using a desalting column (Pierce). 200 nm tubulin-[32P]GTP was incubated with the indicated G protein construct, and the released 32P was isolated using charcoal extraction and quantified by scintillation spectrometry (Beckman LS-6000 (Brea, CA) and Econosafe Scintillation Fluid (Research Products International, Mount Prospect, IL)).
Microtubule Polymerization Assay
Microtubule polymerization was performed using 15 μm tubulin in G-PEM buffer (100 mm PIPES, 1 mm MgCl2, 2 mm EDTA, 200 μm GTP, pH 6.9) (6). Tubulin was polymerized for 1 h at 37 °C, GαsQ227L (exchanged into G-PEM buffer using a Microcon spin concentrator) was added to microtubules for 1 h at 37 °C, and the microtubules were separated from soluble tubulin at 100,000 × g for 1 h at 37 °C (Beckman TL-100). Final reaction volume, including Gαs, was 20 μl. The pelleted protein was resuspended in 20 μl of water at 4 °C. Two μl of each fraction were run on a 10% SDS-polyacrylamide gel (125 V, 2 h), followed by Coomassie Blue staining, to determine the relative mass of polymerized versus soluble tubulin.
Microtubule Polymer Mass Concentration Response Curves
Purified tubulin (23 μm) was incubated for 1 h with GαsQL (0.1–10 μm) in the presence of 1 mm GTP in PEM buffer at 30 °C. Polymerization was initiated with microtubule seeds prepared from purified tubulin, 20% DMSO, and 10% glycerol by incubating the mixture at 30 °C for 30 min and shearing the polymers formed through a 25-gauge needle. The ratio of seeds to tubulin was 1:6, and the final DMSO and glycerol concentrations were 3.3 and 1.7%, respectively. The polymers formed were then separated from solvent by centrifugation at 35,000 × g for 1 h at 30 °C. The microtubule pellets were depolymerized at 0 °C overnight, and the protein concentration was determined by the method of Bradford using BSA as the standard (20).
Microtubule Dynamics by Video Microscopy
Purified bovine brain tubulin (15 μm) was assembled onto sea urchin (Strongylocentrotus purpuratus) axonemes in PMEM buffer (87 mm PIPES, 36 mm MES, 1 mm EGTA, and 2 mm MgCl2, pH 6.8) in the presence of 2 mm GTP. The reaction mixture was incubated at 30 °C for 40 min in the presence or absence of different concentrations of GαsQL, GαsGtL/QL, peptide P3, or the control peptide Gαt. Tracking of microtubule plus-ends was carried out at 30 °C by video-enhanced differential interference contrast microscopy using an Olympus IX71 inverted microscope with a ×100 (numerical aperture = 1.4) oil immersion objective (21). The end of an axoneme that possessed more, faster growing, and longer microtubules than the opposite end was designated as the plus-end as described previously (21). The real-time, 10-min videos were analyzed using Real Time Measurement (RTM II) software, and the data were collected using IgorPro (MediaCybernetics, Bethesda, MD). Microtubules were considered to be growing if they increased in length >0.3 μm at a rate of ≥0.3 μm/min. Shortening events were identified by a >1-μm length change at a rate of ≥2 μm/min. We calculated the catastrophe frequency by dividing the total number of catastrophes (transitions to shortening) by the time the microtubules were growing and in the attenuated state. The rescue (transition from shortening to growing) frequency was calculated as the total number of rescue events divided by the total time shortening. Dynamicity was calculated as the sum of the total growth length and the total shortening length divided by the total time (22).
Molecular Modeling
A previously published model of the Gαs-tubulin complex structure, based upon a Gαs crystal structure and the structure of tubulin by electron crystallography, was refined to optimize side chain orientations using SCWRL 3.0 (13, 23, 24). To determine the structure of the GαsGtL/QL-tubulin complex, the Gαs primary sequence was changed to corresponding Gαt residues in the α3–β5 region using an established method (25). Specifically, Modeler 9.1 (Andrej Sali, University of California, San Francisco, CA) was used to replace the residues in Gαs with the corresponding Gαt residues, using the “automodel” function. Likely structures (120 structures) were generated, and the lowest energy structure was used for further analysis. All structures had very similar peptide backbones on a ribbon diagram. Side chain orientation on the lowest energy complex were optimized using SCWRL version 3.0 (Roland Dunbrak, Fox Chase Cancer Center, Philadelphia, PA), followed by Amber 9.0 (Scripps Institute, La Jolla, CA) with the “all atom energy minimization” protocol for 80 steps. To permit comparison between the GαsWT-tubulin and GαsGtL/QL models, the GαsWT model was refined using SCWRL version 3.0.
Statistical Analysis
All data were analyzed using Prism 4.0 (GraphPad Software), with p < 0.05 being considered significant. Significance tests were performed as indicated. All error bars reflect S.E. unless otherwise specified, and dashed lines indicate 95% confidence intervals for best fit curves.
RESULTS
Binding and Kinetics of Gαs-Tubulin Complexes
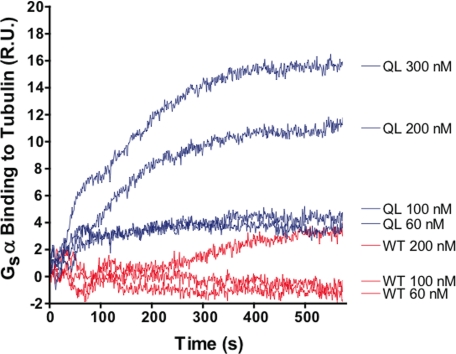
Functional Gαs-tubulin interactions promote neurite or process outgrowth in PC-12 pheochromocytoma cells and epithelial cells (6). The Gαs-tubulin interaction requires Gαs to be in the active (GTP-bound) form. Therefore, active Gαs was generated using the Q227L mutation (GαsQL), which remains constitutively bound to GTP because it cannot hydrolyze the nucleotide (26). Inactive Gαs-GDP, used as a control, was generated by promoting the hydrolysis of GTP on wild-type Gαs by incubation with 5 mm MgCl2 for 1 h at 37 °C. The affinity and kinetics of the Gαs-tubulin interaction were determined by surface plasmon resonance spectroscopy (BIAcore, SPR). Active GαsQL-GTP bound tubulin with kon = 5 × 10⁴ m−1 s−1, koff = 5 × 10⁻³ s−1, and an affinity of 100 nm (Fig. 1). The results are concordant with previous studies and indicate that Gαs must be active in order to bind tubulin (6, 11).
FIGURE 1.
Active Gαs-GTP but not inactive Gαs-GDP binds to tubulin. GαsWT-GDP (red) and GαsQL-GTP (blue) were allowed to bind immobilized tubulin for 10 min. Binding was analyzed by surface plasmon resonance. Active Gαs-GTP reached equilibrium in 300–400 s, whereas inactive Gαs-GDP showed weak and inefficient binding to tubulin. kon = 5 × 10⁴ m−1 s−1, koff = 5 × 10⁻³ s−1, and KD = 100 nm. This suggests that the active form of Gαs is preferred for tubulin binding. Curves are representative of two independent experiments. R.U., resonance units.
Modeling of the Gαs-tubulin complex reveals that Gαs is located close to the nucleotide in β-tubulin. In particular, the α3–β5 region of Gαs is intimately involved in the interface. These results are consistent with a proteomic study using Gαs-derived peptides (13), suggesting that the α3–β5 region of Gαs might be involved in the interface with tubulin.
Gαs Peptides Derived from the α3–β5 Region Bind to Tubulin
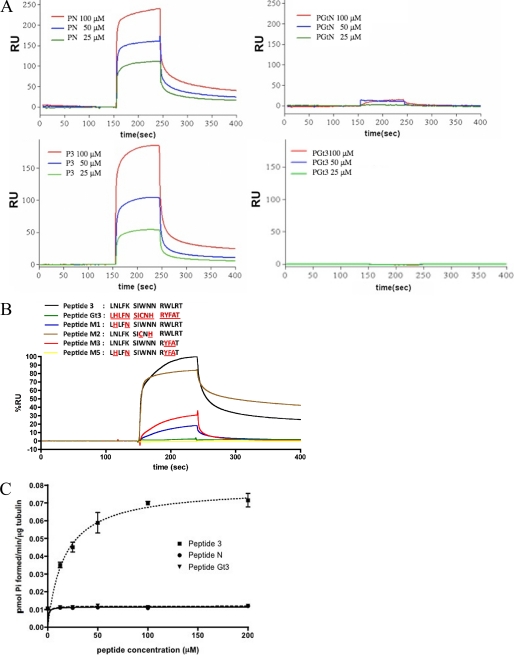
Previous studies have indicated that the α3–β5 region and a region near the N terminus of Gαs may be the regions that bind to tubulin (13). To further understand the role of these regions in binding, 15-amino acid-long peptides corresponding to the α3–β5 regions (P3) or residues 28–42 (peptide N) were synthesized (supplemental Table 2). Control peptides (peptides GtN and Gt3) were derived from Gαt, which does not bind tubulin (11, 27), and corresponded to homologous regions on Gαs. The affinities of all peptides for tubulin were determined. Peptide 3 (P3) bound with a KD of 40 μm, and peptide N displayed 10 μm affinity (Fig. 2A), whereas none of the control (Gαt-derived) peptides bound tubulin. In order to evaluate the contribution of specific residues of P3, four derivative peptides in which some residues were replaced by their Gαt (transducin) homologues were evaluated for their affinity for tubulin (M1, M2, M3, and M5; Fig. 2B and supplemental Table 2). Peptide M2 bound tubulin with an affinity similar to P3 (45 μm) and much more tightly than peptides M1 (KD = 373 μm) and M3 (KD = 313 μm). Peptide M5, which differs from P3 by only 5 residues, did not bind tubulin.
FIGURE 2.
Gαs-derived peptides specifically interact with tubulin. A, sensorgrams from surface plasmon resonance analysis show the mass of indicated peptides bound to tubulin over time (in resonance units (RU)). Varying concentrations of Gαs-derived N-terminal peptide (peptide N (PN)), Gαt-derived N-terminal peptide (PGtN), Gαs-derived α3–β5 peptide (P3), and Gαt-derived α3–β5 peptide (PGt3) were used. n = 3 experiments. B, four variants of P3 (M1, M2, M3, and M5) were synthesized by replacing Gαs residues with homologous residues in transducin (indicated in red). The binding of 100 μm peptides to immobilized tubulin is shown. C, activation of tubulin GTPase by a Gαs-derived peptide (P3). P3 increased tubulin GTPase in a dose-dependent, saturable fashion. Vmax = 0.070 pmol of Pi formed/min/μg of tubulin, and EC50 = 24 μm. Peptide N and peptide Gαt3 have no measurable effect on tubulin GTPase. All peptides are listed in supplemental Table 2.
Gαs Activation of Tubulin GTPase Is Unaltered by Mutating the α3–β5 Loop
In order to determine the functional importance of the α3–β5 loop within the context of Gαs, a chimera of Gαs and Gαt (GαsGtL/QL) was generated, taking into consideration the fact that Gαt does not bind tubulin. Specifically, the α3–β5 loop of Gαs was replaced with homologous residues from Gαt. A similar approach has been used successfully to dissect the interface of Gα subunits with other proteins, including tubulin (13, 16, 27, 28).
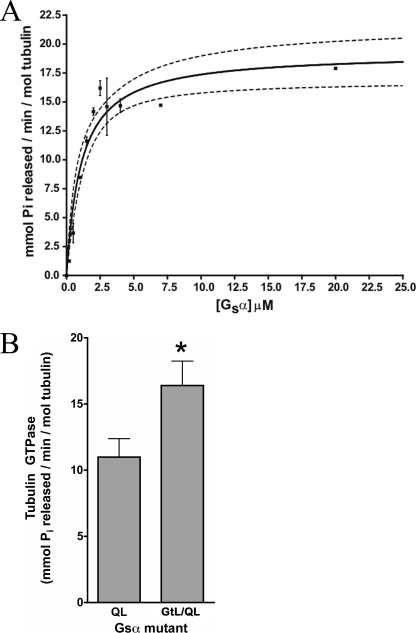
GαsQL stimulated tubulin GTPase with an EC50 of 1.2 μm Gαs and nH = 1.0 (Fig. 3A). This indicates non-cooperative activation of tubulin GTPase by Gαs and is consistent with a 1:1 stoichiometry between the two proteins. The GαsGtL/QL mutants exhibited slightly greater activation of tubulin GTPase activity compared with GαsQL (16 versus 11 nmol of Pi formed/min/pmol of tubulin with 2 μm G protein) (Fig. 3B), suggesting that although the α3–β5 loop is involved in modulating tubulin GTPase activity, its importance within the context of the protein is diminished relative to the peptide. Note that GαsGtL/QL bound tubulin similarly to parent GαsQL (supplemental Fig. 2).
FIGURE 3.
GαsQL and chimeric GαsQL proteins stimulate tubulin GTPase. A, active Gαs was incubated with tubulin-GTP (200 nm) for 30 min, and the tubulin GTPase rate was determined. EC50 = 1.2 μm, Vmax = 20 mmol of GTP hydrolyzed/min/mol of tubulin, and nH = 1.0. Dashed lines, 95% confidence interval for a hyperbolic fit. n = 4. B, active Gαs-Gαt chimera involving the α3–β5 loop (GαsGtL/QL) activates tubulin GTPase. Both Gαs proteins were 2 μm. p < 0.01 versus GαsQL. Error bars, S.E.
Gαs-derived Peptides Functionally Mimic the G Protein Stimulation of Tubulin GTPase
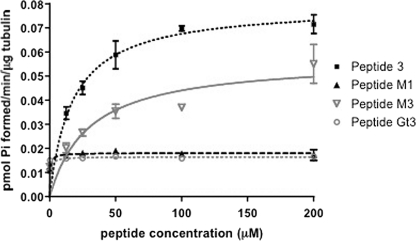
Next, the functional effect of Gαs-derived peptides was tested. The α3–β5-derived peptide (P3) mimicked Gαs by stimulating tubulin GTPase with an EC50 of 24 μm (Fig. 2C). Peptide M2 also stimulated tubulin GTPase but with a lower potency of 47 μm (supplemental Fig. 1). Additionally, peptide N and two peptides with portions of the α3–β5 region from both Gαs and Gαt (M1 and M6) bound to tubulin but failed to stimulate tubulin GTPase, indicating that P3 stimulates tubulin GTPase uniquely (Fig. 4 and supplemental Fig. 1). Peptide M5 does not bind tubulin and, consequently, was without effect on tubulin GTPase (supplemental Fig. 2). Thus, a peptide corresponding to the α3–β5 region of Gαs that mimics the effect of the entire Gαs protein on tubulin GTPase further suggests the functional importance of this region.
FIGURE 4.
Two peptides that bind tubulin similarly have differential effects on tubulin GTPase. Peptides M3 and M1 bind tubulin with similar affinities. However, only peptide M3 stimulates tubulin GTPase activity (Vmax = 0.057 pmol/min/μg tubulin; EC50 = 29 μm), although less efficaciously than P3 (Vmax = 0.070 pmol/min/μg tubulin; EC50 = 24 μm). Error bars, S.E.
The Active Conformation of Gαs Increases Microtubule Dynamic Instability
Because Gαs stimulates tubulin GTPase, it would be expected to increase the switching at microtubule ends from growth to shortening (i.e. to increase the catastrophe frequency). To test this prediction, the effects of Gαs on overall microtubule stability and on dynamic instability were determined.
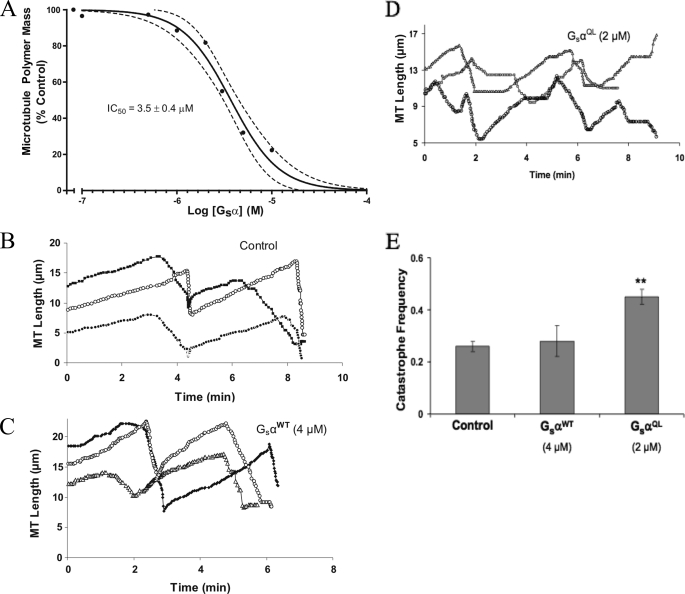
First, the effect of active Gαs on total microtubule polymer mass was determined. Purified tubulin (23 μm) was incubated with GαsQL (0.1–10 μm) for 1 h at 30 °C, and microtubule pellets were separated from soluble tubulin by centrifugation (see “Experimental Procedures”). GαsQL destabilized microtubules in a concentration-dependent manner (Fig. 5A) with an IC50 of 3.5 ± 0.4 μm. This concentration is probably physiologic because Gαs is delivered to microtubule ends at a high local concentration on the surface of endocytic vesicles (6, 10).
FIGURE 5.
Active Gαs promotes microtubule depolymerization and increases the catastrophe frequency. A, tubulin (23 μm) was incubated with GαsQL for 1 h at 30 °C in the presence of 1 mm GTP. Microtubules were pelleted by centrifugation, and the amount of tubulin in supernatant and pellet fractions was quantified (see “Experimental Procedures”). GαsQL inhibited microtubule assembly with an IC50 of 3.5 ± 0.4 μm (n = 3). B–D, life history plot of microtubules in the absence (B) or presence of inactive (C) or active (D) Gαs. Gαs was added to microtubules polymerized on sea urchin axoneme seeds, and the length of microtubules was determined over time (see “Experimental Procedures”). Three representative microtubules are shown in each panel. E, effect of inactive (GαsWT) and active (GαsQL) G proteins on the catastrophe frequency (events/min). ***, p < 0.001. Dashed lines, 95% confidence interval for best fit curves; error bars, S.E.
Next, the steady state dynamic instability behavior of microtubules in the presence of Gαs was determined by video microscopy. GαsQL increased the growing rate, the shortening rate, and the catastrophe frequency (Fig. 5 and Table 1). In contrast, GαsWT had no significant effect on any dynamics parameter, which is consistent with its weak ability to bind tubulin or to stimulate tubulin GTPase (supplemental Table 3; dynamicity was 1.44 with buffer control and 1.40 in the presence of GαsWT). Specifically, GαsQL increased the growing rate by 25% (1 μm) and 63% (2 μm), and increased the catastrophe frequency by 73%. The dynamicity was enhanced by 42% (1 μm) and 63% (2 μm). Notably, 1 μm Gαs caused minimal depolymerization but increased microtubule dynamicity by 42% and nearly doubled the catastrophe frequency, indicating that the primary function of Gαs may be to increase microtubule dynamics rather than to affect microtubule polymer mass.
TABLE 1.
Effects of GαsQL, and GαsGtL/QL on microtubule dynamic instability
Microtubules were polymerized to steady state at the ends of axoneme seeds in the absence and presence of GαsQL or GαsGtL/QL, and the dynamic instability parameters were determined (see “Experimental Procedures”). 15–25 microtubules were measured for each protein concentration. Data are mean ± S.E.
| Dynamic instability parameters | Control | GαsQL (1 μm) | GαsQL (2 μm) | GαsGtL/QL (1 μm) | GαsGtL/QL (2 μm) |
|---|---|---|---|---|---|
| Growing rate (μm/min) | 1.6 ± 0.1 | 2.0 ± 0.2a | 2.6 ± 0.1b | 2.6 ± 0.2b | 3.1 ± 0.3c |
| Shortening rate (μm/min) | 8.9 ± 0.7 | 10.6 ± 1 | 12.4 ± 1.3b | 12.8 ± 1b | 13.4 ± 0.8c |
| Time growing (%) | 39 | 47 | 35 | 50 | 43 |
| Time shortening (%) | 11 | 20 | 23 | 20 | 18 |
| Time attenuated (%) | 50 | 33 | 42 | 30 | 39 |
| Catastrophe frequency (per min) | 0.26 ± 0.02 | 0.45 ± 0.04b | 0.45 ± 0.02b | 0.59 ± 0.1c | 0.62 ± 0.05c |
| Rescue frequency (per min) | 1.42 ± 0.2 | 1.13 ± 0.2 | 0.98 ± 0.1a | 1.22 ± 0.05 | 1.44 ± 0.2 |
| Dynamicity | 1.44 | 2.05 | 2.35 | 2.83 | 2.94 |
a p < 0.05 with respect to control.
b p < 0.01 with respect to control.
c p < 0.001 with respect to control.
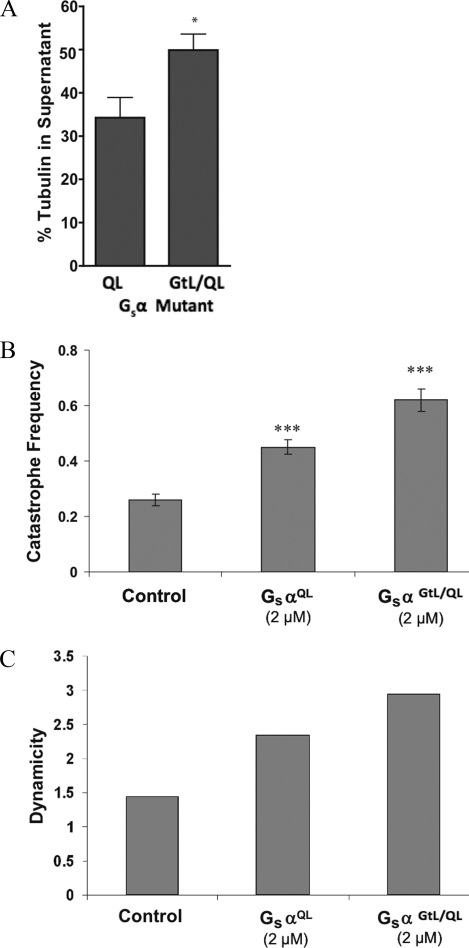
Consistent with its effects on tubulin GTPase, GαsGtL/QL promoted microtubule depolymerization more strongly than GαsQL (1.6-fold difference; Fig. 6A). Moreover, this mutant increased microtubule dynamics more strongly than GαsQL. For example, whereas 2 μm Gαs increased the growing rate, the catastrophe frequency, and the dynamicity by 63, 73, and 63%, respectively, the same concentration of GαsGtL/QL increased these parameters by 94, 138, and 104%, respectively (Fig. 6B and Table 1).
FIGURE 6.
GαsGtL/QL promotes microtubule depolymerization and dynamic instability to a greater extent than GαsQL. A, 15 μm GαsQL and 15 μm GαsGtL/QL (mutation only in the α3–β5 loop) were added to microtubules (15 μm) at 37 °C for 60 min in the presence of 200 μm GTP. GαsGtL/QL depolymerized microtubules to a greater extent than GαsQL. GαsGtL/QL increased the catastrophe frequency (events/min; error bars represent S.E.) (B) and dynamicity (C). *, p < 0.01; ***, p < 0.001.
Gαs-derived Peptides Increase Microtubule Dynamics
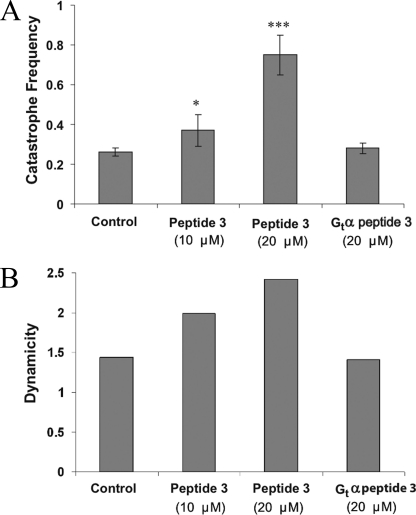
We also determined the effects of the α3–β5-derived peptide (peptide P3) on dynamic instability. The peptide also increased microtubule dynamics but required concentrations higher than those required for the full-length proteins. Specifically, whereas 4 μm P3 did not have any significant effect on dynamic instability, 10 and 20 μm peptide P3 destabilized the microtubules significantly. For example, at 20 μm, peptide P3 increased the growing rate by 63% and the catastrophe frequency by 188%. (Fig. 7 and Table 2). The overall dynamicity was increased by 68% compared with the control. These results suggest that α3–β5-derived peptide P3 mimics the effect of full-length Gαs predominantly by increasing the catastrophe frequency.
FIGURE 7.
A peptide derived from the α3–β5 region of Gαs (P3) mimics Gαs protein in increasing the catastrophe frequency and dynamicity of microtubules. A, 20 μm Gαs peptide P3 increases the catastrophe frequency (events/min) by 188%, whereas the homologous Gαt peptide (PGt3) had no effect. Error bars, S.E. B, in the presence of Gαs P3, the overall dynamicity increased 68% compared with the control (tubulin alone). Gαt P3 has no effect on dynamicity. *, p < 0.01; ***, p < 0.001.
TABLE 2.
Effects of peptides on microtubule dynamic instability
Tubulin was polymerized to steady state with axoneme seeds in the absence and presence of P3 or control peptide (PGt3), and the dynamic instability parameters were determined (see “Experimental Procedures”). 15–25 microtubules were measured for each peptide concentration. Data are mean ± S.E.
| Dynamic instability parameters | Control | P3 Peptide (4 μm) | P3 Peptide (10 μm) | P3 Peptide (20 μm) | PGt3 Peptide (20 μm) |
|---|---|---|---|---|---|
| Growing rate (μm/min) | 1.6 ± 0.1 | 1.7 ± 0.2 | 1.95 ± 0.2a | 2.6 ± 0.3b | 1.5 ± 0.2 |
| Shortening rate (μm/min) | 8.9 ± 0.7 | 9.6 ± 0.9 | 12.5 ± 1b | 13.6 ± 1b | 9.2 ± 0.7 |
| Time growing (%) | 39 | 26.2 | 39.6 | 21.5 | 42 |
| Time shortening (%) | 11 | 10.2 | 11.2 | 15.6 | 10.4 |
| Time attenuated (%) | 50 | 63.6 | 49.2 | 62.9 | 47.6 |
| Catastrophe frequency (per min) | 0.26 ± 0.02 | 0.26 ± 0.02 | 0.37 ± 0.01a | 0.75 ± 0.1c | 0.28 ± 0.03 |
| Rescue frequency (per min) | 1.42 ± 0.2 | 1.40 ± 0.2 | 1.39 ± 0.2 | 1.36 ± 0.3 | 1.32 ± 0.4 |
| Dynamicity | 1.44 | 1.38 | 1.99 | 2.42 | 1.41 |
a p < 0.05 as observed in a t test with respect to control.
b p < 0.01 as observed in a t test with respect to control.
c p < 0.001 as observed in a t test with respect to control.
DISCUSSION
The data presented in this report suggest a model for the action of Gαs on microtubules. We have previously reported that in response to agonist stimulation, Gαs moves from the plasma membrane to the cytosol and associates with microtubule plus-ends (6, 10). We propose that active Gαs both promotes hydrolysis of GTP on tubulin and sequesters the newly released tubulin-GDP, resulting in increased microtubule dynamics. This process is probably terminated by the autohydrolysis of GTP on Gαs. First, we show here that Gαs must be in an active conformation (Gαs-GTP) in order to bind tubulin, to stimulate tubulin GTPase, and to increase microtubule dynamic instability (Fig. 1). The 1:1 interaction of Gαs with tubulin and 1 μm potency of Gαs for tubulin GTPase (and 3 μm for microtubule depolymerization) support a model whereby Gαs is delivered to intracellular microtubule plus-ends on the cytosolic surface of lipid raft-derived vesicle membranes (10, 29, 30). The intracellular concentration of tubulin is in the micromolar range, and Gαs targets microtubules upon internalization (6).
Our results also show that 1 μm Gαs causes a 2-fold increase in the catastrophe frequency with minimal depolymerization of the microtubules (Figs. 5 and 6 and Table 1), suggesting that the primary effect of Gαs is on microtubule dynamics rather than on the mass of assembled polymer. This is consistent with neuronal outgrowth being a dynamic process involving both extension and retraction (31). In addition, Gαs, has a much higher affinity for tubulin (100 nm) than potency for tubulin GTPase (1 μm) (32, 33). We suggest that Gαs sequesters tubulin-GDP to prevent reassociation with microtubules after nucleotide exchange using cytosolic GTP. Indeed, Gαs binds to both tubulin-GDP and tubulin-GTP (6).
Structurally, the α3–β5 region of Gαs appears to be the principal region through which Gαs mediates its activation of tubulin GTPase. Computational modeling data place this region near the hydrolyzable GTP on tubulin. Mutagenesis of this region alters Gαs stimulation of tubulin GTPase and microtubule dynamics. Furthermore, a peptide corresponding to this region mimics the effects of Gαs on tubulin GTPase, microtubule stability, and dynamics (Figs. 2, 4, and 7 and Table 2). The α3–β5 region of Gαs is a highly interactive surface on that molecule because it mediates Gα interaction with adenylyl cyclase and Gβγ (34, 35). This result lends support to the idea that tubulin, like adenylyl cyclase, is an effector for Gαs.
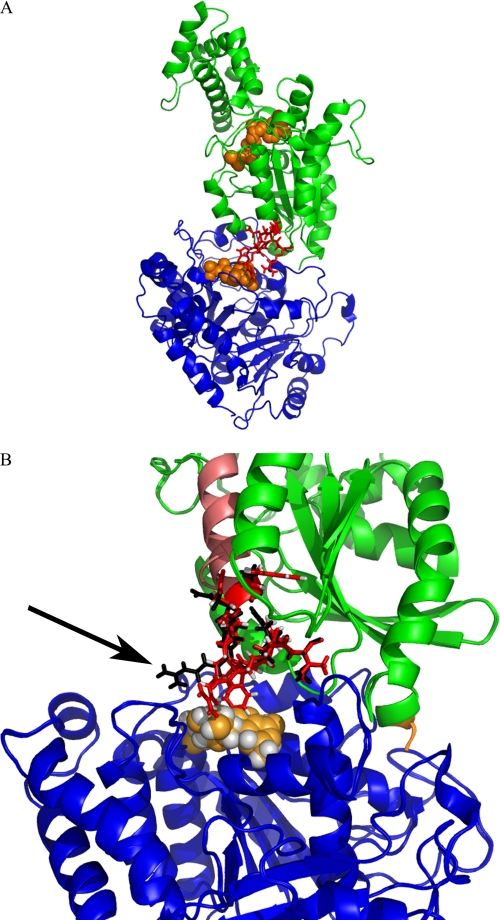
Perhaps counterintuitively, the GαsGtL/QL chimera stimulates tubulin GTPase and increases microtubule dynamic instability to a slightly greater extent than GαsQL (Figs. 3 and 6 and Table 1). Molecular modeling studies suggest that this chimera undergoes conformational changes that may be permissive for increased tubulin GTPase (Fig. 8). It does appear that the α3 helix, loop, and β5 sheet together are crucial for getting the peptide or protein into position. Consistent with the peptide data in this paper, mutation of the two tryptophan residues in the α3β5 loop blocked Gαs/adenylyl cyclase activation by α3β5 region peptides (36). Grishina and Berlot (37) substituted the α3β5 region from Gi2 into Gαs and found that AC activation was blocked. Thus, it appears that the α3β5 region may be more important than the loop itself but that clear conformational distinctions must be drawn between the proteins and peptides derived from those proteins. Ultimately, rigorous evaluation of this will require crystallization of Gαs-tubulin complexes to allow for subnanometer resolution of the structure.
FIGURE 8.
Molecular model of Gαs-GTPγS (guanosine 5′-(3-O-thio)triphosphate) complexed with tubulin-GDP. A, molecular modeling (described under “Experimental Procedures”) was used to visualize the Gαs-GTP·tubulin-GDP complex. Blue, tubulin; green, Gαs. The GDP on tubulin (orange spheres) is located in close proximity to Gαs. Note the α3–β5 loop (red) on Gαs is in close proximity to tubulin. B, the Gαs-tubulin interface is expanded in this model, and interacting residues are shown in red (WT) or black (GtL/QL). The GDP on tubulin is shown in orange. The α3 helix is shown in pink and is located far from the Gαs-tubulin interface. This model suggests that, in GαsGtL/QL, the indicated (black arrow) positively charged Arg residue undergoes a positional change that decreases steric hindrance with GTP on tubulin and may additionally position to better abstract the terminal phosphate (note that nucleotide is still shown as GDP).
We have also developed short peptides (P3, M2, and M3) that mimic the effects of Gαs on tubulin and microtubules (Figs. 2, 4, and 7 and Table 2). Introduction of these peptides should be useful tools to probe Gαs-tubulin interactions in living cells. Peptides have been successfully used to study G protein signaling in striatal membranes as well as in intact cells, even at high micromolar concentrations (38, 39). The specificity of effects in cells can be assessed both by using inactive Gαs peptides that bind tubulin (M1, M6, and PN) and homologous peptides that do not bind tubulin (PGt and P5) (Figs. 2, 4, and 7 and Table 2). Peptides (or peptide mimetics) that target the Gαs/tubulin interface might be of therapeutic usefulness to promote neurite outgrowth and synaptogenesis.
Neurotransmitter (activity)-dependent neuronal remodeling plays a role during development and antidepressant response, and involves alterations in both G protein signaling and microtubule dynamic instability (31, 40–42). Indeed, plastic regions, such as immature dendritic spines, contain highly dynamic microtubules (4, 43). We have recently shown that Gαs, even in the absence of cAMP signaling, modulates microtubule stability and promotes neurite outgrowth in cells (6). These processes may occur via a direct interaction of Gαs with microtubules. The data presented in this report suggest a mechanism for neurotransmitter-induced remodeling of the cytoskeleton and raise the possibility that small molecule probes can be generated to manipulate this process.
Supplementary Material
Acknowledgments
We thank Aarti Sharma for help with designing and preparing G protein mutants and Herb Miller for preparing bovine brain tubulin.
Footnotes
This work was supported, in whole or in part, by National Institutes of Health Grants NS 13560 (to M. L. and L. W.), T32-HL007692 (to R. H. D.), and MH 39595 (to W. S. and M. M. R.). This work was also supported by AbdulRazzaq Al-Siddiqi.

The on-line version of this article (available at http://www.jbc.org) contains supplemental Tables 1–3 and Figs. 1 and 2.
REFERENCES
- 1. Lopus M., Yenjerla M., Wilson L. (2009) Wiley Encyclopedia of Chemical Biology (Begley T. P. ed) Vol. 3, pp. 153–160, John Wiley & Sons, Inc., New York [Google Scholar]
- 2. Conde C., Caceres A. (2009) Nat. Rev. Neurosci. 10, 319–332 [DOI] [PubMed] [Google Scholar]
- 3. Suter D. M., Schaefer A. W., Forscher P. (2004) Curr. Biol. 14, 1194–1199 [DOI] [PubMed] [Google Scholar]
- 4. Jaworski J., Kapitein L. C., Gouveia S. M., Dortland B. R., Wulf P. S., Grigoriev I., Camera P., Spangler S. A., Di Stefano P., Demmers J., Krugers H., Defilippi P., Akhmanova A., Hoogenraad C. C. (2009) Neuron 61, 85–100 [DOI] [PubMed] [Google Scholar]
- 5. van Rossum D., Kuhse J., Betz H. (1999) J. Neurochem. 72, 962–973 [DOI] [PubMed] [Google Scholar]
- 6. Yu J. Z., Dave R. H., Allen J. A., Sarma T., Rasenick M. M. (2009) J. Biol. Chem. 284, 10462–10472 [DOI] [PMC free article] [PubMed] [Google Scholar]
- 7. Roychowdhury S., Rasenick M. M. (2008) FEBS J. 275, 4654–4663 [DOI] [PMC free article] [PubMed] [Google Scholar]
- 8. Roychowdhury S., Panda D., Wilson L., Rasenick M. M. (1999) J. Biol. Chem. 274, 13485–13490 [DOI] [PubMed] [Google Scholar]
- 9. Piao X., Hill R. S., Bodell A., Chang B. S., Basel-Vanagaite L., Straussberg R., Dobyns W. B., Qasrawi B., Winter R. M., Innes A. M., Voit T., Ross M. E., Michaud J. L., Déscarie J. C., Barkovich A. J., Walsh C. A. (2004) Science 303, 2033–2036 [DOI] [PubMed] [Google Scholar]
- 10. Allen J. A., Yu J. Z., Donati R. J., Rasenick M. M. (2005) Mol. Pharmacol. 67, 1493–1504 [DOI] [PubMed] [Google Scholar]
- 11. Wang N., Yan K., Rasenick M. M. (1990) J. Biol. Chem. 265, 1239–1242 [PubMed] [Google Scholar]
- 12. Yan K., Greene E., Belga F., Rasenick M. M. (1996) J Neurochem. 66, 1489–1495 [DOI] [PubMed] [Google Scholar]
- 13. Layden B. T., Saengsawang W., Donati R. J., Yang S., Mulhearn D. C., Johnson M. E., Rasenick M. M. (2008) Biochim. Biophys. Acta 1783, 964–973 [DOI] [PMC free article] [PubMed] [Google Scholar]
- 14. Linder M. E., Ewald D. A., Miller R. J., Gilman A. G. (1990) J. Biol. Chem. 265, 8243–8251 [PubMed] [Google Scholar]
- 15. Guo L. W., Assadi-Porter F. M., Grant J. E., Wu H., Markley J. L., Ruoho A. E. (2007) Protein Expr. Purif. 51, 187–197 [DOI] [PubMed] [Google Scholar]
- 16. Skiba N. P., Thomas T. O., Hamm H. E. (2000) Methods Enzymol. 315, 502–524 [DOI] [PubMed] [Google Scholar]
- 17. Murphy D. B. (1982) Methods Cell Biol. 24, 31–49 [DOI] [PubMed] [Google Scholar]
- 18. Miller H. P., Wilson L. (2010) Methods Cell Biol. 95, 3–15 [DOI] [PubMed] [Google Scholar]
- 19. Mejillano M. R., Shivanna B. D., Himes R. H. (1996) Arch. Biochem. Biophys. 336, 130–138 [DOI] [PubMed] [Google Scholar]
- 20. Yenjerla M., LaPointe N. E., Lopus M., Cox C., Jordan M. A., Feinstein S. C., Wilson L. (2010) J. Alzheimers Dis. 19, 1377–1386 [DOI] [PMC free article] [PubMed] [Google Scholar]
- 21. Yenjerla M., Lopus M., Wilson L. (2010) Methods Cell Biol. 95, 189–206 [DOI] [PubMed] [Google Scholar]
- 22. Lopus M., Oroudjev E., Wilson L., Wilhelm S., Widdison W., Chari R., Jordan M. A. (2010) Mol. Cancer Ther. 9, 2689–2699 [DOI] [PMC free article] [PubMed] [Google Scholar]
- 23. Sunahara R. K., Tesmer J. J., Gilman A. G., Sprang S. R. (1997) Science 278, 1943–1947 [DOI] [PubMed] [Google Scholar]
- 24. Nogales E., Whittaker M., Milligan R. A., Downing K. H. (1999) Cell 96, 79–88 [DOI] [PubMed] [Google Scholar]
- 25. Xiang Z. (2006) Curr. Protein Pept. Sci. 7, 217–227 [DOI] [PMC free article] [PubMed] [Google Scholar]
- 26. Graziano M. P., Gilman A. G. (1989) J. Biol. Chem. 264, 15475–15482 [PubMed] [Google Scholar]
- 27. Chen N. F., Yu J. Z., Skiba N. P., Hamm H. E., Rasenick M. M. (2003) J. Biol. Chem. 278, 15285–15290 [DOI] [PubMed] [Google Scholar]
- 28. Skiba N. P., Bae H., Hamm H. E. (1996) J. Biol. Chem. 271, 413–424 [DOI] [PubMed] [Google Scholar]
- 29. Allen J. A., Halverson-Tamboli R. A., Rasenick M. M. (2007) Nat. Rev. Neurosci. 8, 128–140 [DOI] [PubMed] [Google Scholar]
- 30. Dave R. H., Saengsawang W., Yu J. Z., Donati R., Rasenick M. M. (2009) Neurosignals 17, 100–108 [DOI] [PMC free article] [PubMed] [Google Scholar]
- 31. Poulain F. E., Sobel A. (2010) Mol. Cell Neurosci. 43, 15–32 [DOI] [PubMed] [Google Scholar]
- 32. Margolis R. L., Wilson L. (1977) Proc. Natl. Acad. Sci. U.S.A. 74, 3466–3470 [DOI] [PMC free article] [PubMed] [Google Scholar]
- 33. David-Pfeuty T., Simon C., Pantaloni D. (1979) J. Biol. Chem. 254, 11696–11702 [PubMed] [Google Scholar]
- 34. Hamm H. E., Gilchrist A. (1996) Curr. Opin. Cell Biol. 8, 189–196 [DOI] [PubMed] [Google Scholar]
- 35. Tesmer J. J., Sunahara R. K., Gilman A. G., Sprang S. R. (1997) Science 278, 1907–1916 [DOI] [PubMed] [Google Scholar]
- 36. Chen Y., Yoo B., Lee J. B., Weng G., Iyengar R. (2001) J. Biol. Chem. 276, 45751–45754 [DOI] [PubMed] [Google Scholar]
- 37. Grishina G., Berlot C. H. (2000) Mol. Pharmacol. 57, 1081–1092 [PubMed] [Google Scholar]
- 38. Rasenick M. M., Watanabe M., Lazarevic M. B., Hatta S., Hamm H. E. (1994) J. Biol. Chem. 269, 21519–21525 [PubMed] [Google Scholar]
- 39. Smrcka A. V., Kichik N., Tarragó T., Burroughs M., Park M. S., Itoga N. K., Stern H. A., Willardson B. M., Giralt E. (2010) Proc. Natl. Acad. Sci. U.S.A. 107, 639–644 [DOI] [PMC free article] [PubMed] [Google Scholar]
- 40. Bianchi M., Shah A. J., Fone K. C., Atkins A. R., Dawson L. A., Heidbreder C. A., Hows M. E., Hagan J. J., Marsden C. A. (2009) Synapse 63, 359–364 [DOI] [PubMed] [Google Scholar]
- 41. Lim S. S., Sammak P. J., Borisy G. G. (1989) J. Cell Biol. 109, 253–263 [DOI] [PMC free article] [PubMed] [Google Scholar]
- 42. Donati R. J., Rasenick M. M. (2005) Neuropsychopharmacology 30, 1238–1245 [DOI] [PubMed] [Google Scholar]
- 43. Hu X., Viesselmann C., Nam S., Merriam E., Dent E. W. (2008) J. Neurosci. 28, 13094–13105 [DOI] [PMC free article] [PubMed] [Google Scholar]
Associated Data
This section collects any data citations, data availability statements, or supplementary materials included in this article.


