Abstract
Using structure-based virtual screening, we previously identified a novel stilbenoid inhibitor of Jak2 tyrosine kinase named G6. Here, we hypothesized that G6 suppresses Jak2-V617F-mediated human pathological cell growth in vitro and in vivo. We found that G6 inhibited proliferation of the Jak2-V617F expressing human erythroleukemia (HEL) cell line by promoting marked cell cycle arrest and inducing apoptosis. The G6-dependent increase in apoptosis levels was concomitant with increased caspase 3/7 activity and cleavage of PARP. G6 also selectively inhibited phosphorylation of STAT5, a downstream signaling target of Jak2. Using a mouse model of Jak2-V617F-mediated hyperplasia, we found that G6 significantly decreased the percentage of blast cells in the peripheral blood, reduced splenomegaly, and corrected a pathologically low myeloid to erythroid ratio in the bone marrow by eliminating HEL cell engraftment in this tissue. In addition, drug efficacy correlated with the presence of G6 in the plasma, marrow, and spleen. Collectively, these data demonstrate that the stilbenoid compound, G6, suppresses Jak2-V617F-mediated aberrant cell growth. As such, G6 may be a potential therapeutic lead candidate against Jak2-mediated, human disease.
Keywords: Bone Marrow, Drug Action, Jak Kinase, Nonreceptor Tyrosine Kinase, Spleen, STAT Transcription Factor
Introduction
Hyperkinetic Jak2 tyrosine kinase signaling is a contributor to several human diseases including specific forms of leukemia, lymphoma, myeloma, and the myeloproliferative neoplasms (MPNs).3 MPNs are clonal disorders of multipotent hematopoietic progenitors characterized by increased hematopoiesis. The classic MPNs include polycythemia vera (PV), essential thrombocythemeia (ET), and primary meylofibrosis (PMF). A mutation resulting in a valine to phenylalanine substitution within the pseudokinase domain of Jak2 (Jak2-V617F) was identified in a large number of PV, ET, and PMF patients (1–5). This mutation has also been reported in chronic myelomonocytic leukemia, myelodysplastic syndrome, systemic mastocytosis, chronic neutrophilic leukemia, acute myeloid leukemia, and erythroleukemia (6–8). The mutation causes constitutive activation of the Jak2 signaling pathway when expressed in cells (2–5). Furthermore, its expression in murine bone marrow results in a neoplastic phenotype (9–11).
Because of its pathogenicity, the Jak2-V617F mutation is a target for therapeutic drug development. A number of laboratories have designed and/or identified small molecule inhibitors that have potential Jak2 therapeutic efficacy (10, 12–16). Our laboratory has also identified small molecules with anti-Jak2 tyrosine kinase activity (17, 18). In our most recent work, structure-based virtual screening was employed to identify a novel Jak2 inhibitor named G6 (19). Using a cell-free system, we found that G6 demonstrated good potency and specificity at suppressing Jak2-V617F kinase activity (19). Based on that work, we hypothesized that G6 would have therapeutic efficacy against Jak2-V617F-mediated pathogenesis. Here, we tested this hypothesis and found that G6 did indeed suppress Jak2-V617F-mediated pathological cell growth in vitro and in vivo.
EXPERIMENTAL PROCEDURES
Compound Synthesis
G6 was synthesized following Reaction 1 (next page). The final product, obtained with a 91% yield was >99% pure. 1H NMR (DMSO-d6, 250 MHz): δ 6.9 (dd, 2H, J = 1.5 Hz), 6.8 (d, 4H, J = 8 Hz), 3.8 (S, 4H), 2.6 (q, 8H, J = 7.25 Hz), 2.1 (q, 4H, J = 7.5 Hz), 1.1 (t, 12H, J = 7.25 Hz), 0.8 (t, 6H, J = 7.5 Hz); 13C NMR (DMSO-d6, 62.5 MHz): δ 156.5, 138.7, 133.4, 128.7, 128.5, 121.5, 115.4, 57.1, 46.4, 28.6, 13.6, 11.4. The dried powder was stored at 4 °C and dissolved in dimethyl sulfoxide (DMSO, Sigma) as needed.
REACTION 1.
Reagents and Conditions. (i) Zn, TiCl4, dry THF, 0 °C to reflux. (ii) Diethylamine, paraformaldehyde, MeOH, reflux.
Cell Culture
Human erythroleukemia 92.1.7 (HEL) cells were purchased from ATCC. The cells were cultured in RPMI 1640 medium containing 10% fetal bovine serum at 37 °C in a 5% CO2 humidified atmosphere. Cell proliferation assays, DNA cell cycle analysis, and annexin V/propidium iodide apoptotic levels were measured as we have described previously (18).
Caspase 3/7 Activity Assay
HEL cells were plated in 96-well plates at 104 cells per well and treated with G6 for the indicated periods of time. Caspase Glo 3/7 reagent (Promega) was then added to each well as per the manufacturer's protocol and caspase proteolytic activity was measured using a multi-plate luminescent reader (Spectramax M5, Molecular Devices).
Measurement of Cleaved PARP
107 HEL cells were seeded in 100-mm dishes and subsequently treated with G6 for the indicated periods of time. The cells were lysed in RIPA buffer, and whole cell protein lysates were prepared. 20 μg of soluble protein was separated via SDS-PAGE, transferred onto nitrocellulose membranes, and blotted with an anti-PARP antibody (Cell Signaling). Specific protein bands were visualized using the enhanced chemiluminescence system (Perkin-Elmer). The same membranes were re-probed with anti-β-actin antibody (Cell Signaling) to confirm equal loading of protein.
Phospho-STAT Analysis
Phospho-STAT1 [pY701], STAT3 [pY705], and STAT5a/b [pY694/699] ([pY694] for STAT5a and [pY699] for STAT5b) were similarly measured using the STAT1, 3, 5a/b Phospho 3-Plex assay kit, a solid phase sandwich immunoassay, following the manufacturer's instructions (Invitrogen). The spectral properties of the 3 bead regions specific for each analyte were monitored with a Luminex® 100TM instrument.
In Vivo Animal Model
The in vivo efficacy of G6 was determined using a mouse model of Jak2-V617F mediated, human erythroleukemia. All experimental protocols were performed according to NIH standards established in the Guide for the Care and Use of Laboratory Animals and approved by the Institutional Animal Care Use Committee at the University of Florida. The experimental approach is outlined in supplemental Fig. S1. Thirty-six male adult (3 months old) NOD/SCID mice were purchased from Jackson Laboratory. After arrival and acclimation, baseline body weights and peripheral blood samples were obtained, and the mice were subsequently randomized into 6 groups (n = 6 per group). Mice were inoculated intravenously via the lateral tail vein with 2 × 10⁶ HEL cells expressing the Jak2-V617F mutation. Body weights and blood samples were obtained each week to monitor disease progression. Three weeks after HEL cell injection, the mice received daily intra-peritoneal injections of G6 at dosage rates of 0.1, 1 and 10 mg/kg/day, respectively, for 21 days. Three separate control groups were also included. The first received HEL cells and subsequent daily injections of vehicle alone (DMSO). The second group never received HEL cells, but received G6 at the 10 mg/kg/day dosage over the same 3 week period of drug administration. The third group was completely naïve to any treatment. After the 3 week period of drug or vehicle administration, all groups were euthanized by CO2 asphyxiation and cervical dislocation. Spleen weight to body weight ratios were obtained. A bone marrow aspirate from one femur was obtained for flow cytometry analysis and determination of HEL cell engraftment. Tissue samples (brain, lung, liver, kidney, spleen, and bone marrow) were fixed in 10% neutral-buffered formalin, embedded in paraffin, sectioned, and stained with hematoxylin and eosin for histological analysis.
Analysis of Peripheral Blood Cells
A blood sample was obtained each week (∼25 μl) via sub-mandibular bleeding into a capillary tube. The samples were then smeared onto glass slides and stained using DipQuick (Jorgensen Laboratories). Total white blood cell (WBC) counts, as well as percentages of immature granular leukocytes, monocytes, and nucleated red blood cells (RBC) were counted by a veterinary pathologist using a light microscope.
Histopathological Analysis
Hematoxylin and eosin stained sections (liver, kidney, lung, brain, spleen, and bone marrow) were examined for normal histological appearance as well as any lesions via standard light microscopy.
Bone Marrow Flow Cytometry
At the time of euthanasia, bone marrow was harvested from one femur and teased apart into single cell suspension in staining buffer by filtering it through a 50-μm nylon mesh following the manufacturer's protocol (eBioscience). Cell suspensions were incubated on ice with APC conjugated anti-human CD45 antibody (BD Biosciences), washed, and subjected to flow cytometry.
Bone Marrow Immunohistochemistry
Immunochemistry was carried out on tissue fixed in 10% neutral-buffered formalin and paraffin-embedded. For detection of active STAT5, mouse monoclonal anti-phospho-STAT5a/b (Y694/99; Advantex BioReagents LLP) was diluted 1:500 and incubated on sections overnight at 4 °C. Detection of the antigen-antibody complexes was done by biotinylated secondary antibodies and streptavidin-peroxidase complex (DAKO). Hematoxylin was used for counterstaining. Antigen retrieval was done by heating (95 °C, 20 min) with the BioGenex AR10 retrieval buffer. The staining intensity was quantified using the NIS-Element D software. Apoptotic cells in the tissue were identified via TUNEL. All TUNEL reagents were part of the ApopTag Kit (Millipore). TUNEL-positive cells appeared as highly stained, brown nuclei against the methyl green counterstain.
Pharmacokinetic and Pharmacodynamic Analysis of G6 in Mice
Baseline body weights and peripheral blood samples were obtained from three-month-old male NOD-SCID mice. The mice (n = 12) were then injected in the tail vein with 2 × 10⁶ HEL cells. Three weeks later, peripheral blood samples were again obtained in order to confirm that the animals were in blast crisis. Once this was validated, the animals began receiving either vehicle control (DMSO) or G6 (1 mg/kg/day) via single, daily IP injections for the next 14 days (n = 6 mice per group). The mice were subsequently euthanized and tissues (plasma, marrow, and spleen) were prepared. The concentration of G6 was determined via liquid chromatography-mass spectrometry using a quadratic standard curve (r = 0.9902).
Statistical Analysis
Results are expressed as mean ± S.E. Statistical comparisons were performed by Student's t test or the Mann-Whitney Rank Sum Test. Changes in peripheral blood cell counts and bone marrow cellularity following HEL cell and drug treatment were analyzed by a repeated measures ANOVA followed by Bonferroni and Student-Newman-Keuls post hoc test for multiple comparisons. p values of less than 0.05 were considered statistically significant.
RESULTS
G6 Inhibits Jak2-V617F-dependent Cell Proliferation
Using structure-based virtual screening, we recently identified a Jak2 tyrosine kinase inhibitor called G6 (19). This stilbenoid compound demonstrated good potency and specificity for Jak2 tyrosine kinase as it inhibited Jak2-V617F enzymatic activity (IC50 = 60 nm) while having no effect on c-Src tyrosine kinase activity at concentrations as high as 25 μm (19). Furthermore, it significantly inhibited the growth of cells whose proliferation was driven by the Jak2-V617F mutation while having little to no effect on cells whose proliferation was driven by other mechanisms including a JAK3-A572V-activating mutation, a c-Myc gene translocation, or immortalization via the SV-40 large T antigen (19). As such, we hypothesized that G6 would suppress Jak2-V617F-mediated pathological cell growth.
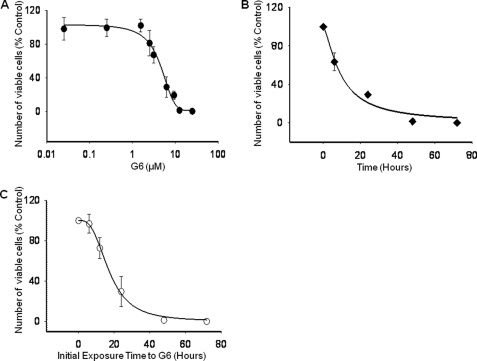
To test this, we utilized the HEL cell line in vitro. This cell line is homozygous for the V617F mutation which induces constitutive Jak2 phosphorylation and drives HEL cell proliferation. Here, 5 × 10⁴ HEL cells were treated with either DMSO or increasing concentrations of G6 for 72 h. The number of viable cells was then determined. We found that G6 inhibited HEL cell growth in a dose-dependent manner with an IC50 of ∼4.0 μm (Fig. 1A). To determine if G6 could suppress HEL cell growth in a time dependent manner, cells were treated with 25 μm G6 for increasing periods of time. We found that G6 inhibited HEL cell growth in a time-dependent manner with 50% inhibition being achieved after ∼12 h of treatment (Fig. 1B). We next wanted to determine whether the effects of G6 on HEL cell growth were reversible. For this, cells were exposed to 25 μm of G6 for 0, 6, 24, 48, and 72 h. At the end of each time point, the cells were collected, washed extensively, and allowed to grow for an additional 72 h in the absence of any inhibitor. Viable cell numbers were then determined. We found that for cells that were exposed to G6 for only 6 h, nearly all of them were able to proliferate after they were removed from the drug (Fig. 1C). Analysis of the recovery curve suggested that ∼16 h exposure to G6 prevented 50% of the cells from recovering. For those cells that were exposed to G6 for 48 h, virtually none were able to subsequently grow after the drug was removed from the media. This suggested that a 48 h exposure of the cells to G6 committed them to a fate from which they could not recover. Collectively, these data indicate that G6 inhibits HEL cell growth in both a dose- and time-dependent manner, and exposure of HEL cells to 25 μm G6 for 48 h is sufficient to prevent subsequent Jak2-V617F mediated cell growth.
FIGURE 1.
G6 inhibits Jak2-V617F-dependent HEL cell proliferation, in vitro. A, HEL cells were treated with increasing doses of G6 for 72 h, and the number of viable cells was determined. B, HEL cells were treated 25 μm G6 for 0, 6, 24, 48, and 72 h and cell numbers were determined. C, HEL cells were treated with 25 μm of G6 for 0, 6, 12, 24, 48, and 72 h. At the end of each time point, the cells were placed in medium lacking inhibitor for an additional 72 h. The number of viable cells was then determined. Shown are mean ± S.E. for three independent experiments, each run in triplicate.
G6 Suppresses HEL Cell Growth by Inducing G1 Phase Cell Cycle Arrest and Intrinsic Apoptosis
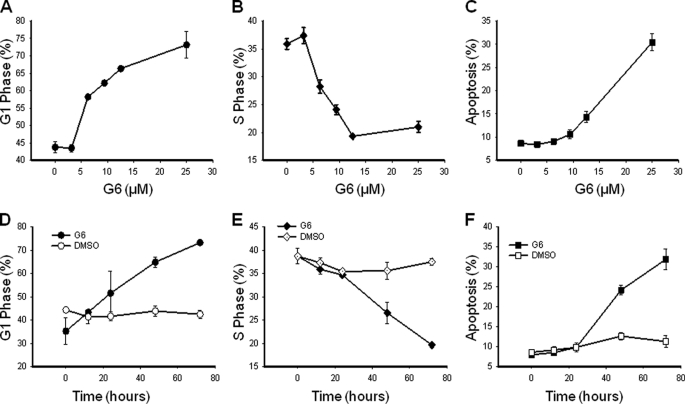
To determine the mechanism by which G6 reduces HEL cell growth, we first measured cell cycle properties as a function of G6 treatment. Specifically, 5 × 10⁵ HEL cells were treated with G6 as a function of either dose or time. Three independent experiments, each measured in triplicate, were averaged and the aggregate data were graphed as a function of G6 concentration or G6 exposure time. We found that G6 dose-dependently increased the percentage of cells in G1 phase (Fig. 2A), decreased cells in S phase (Fig. 2B), and increased cells in apoptosis (Fig. 2C). With respect to the time course study, we found that G6 promoted a time-dependent increase in G1 phase (Fig. 2D), a decrease in S phase (Fig. 2E), and an increase in apoptosis (Fig. 2F) when compared with DMSO control treated cells.
FIGURE 2.
G6 suppresses HEL cell growth by inducing G1 phase cell cycle arrest. HEL cells were treated with increasing doses of G6 for 72 h or with 25 μm G6 for increasing times. Cellular DNA contents were then determined by flow cytometry. Three independent experiments, each measured in triplicate, were averaged and the aggregate cell cycle data were graphed as a function of G6 concentration (A–C) or G6 exposure time (D–F). Shown are the percentage of cells in G1 phase (A and D), S phase (B and E), and apoptosis (C and F). Shown are mean ± S.E.
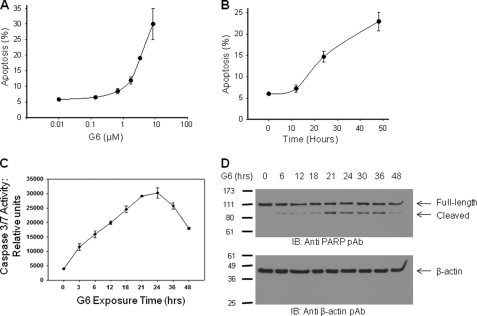
The apoptosis measurements in Fig. 2, C and F represent fragmented DNA, which is only suggestive of late stage apoptosis. Therefore, to fully confirm the induction of apoptosis by G6, we used annexin V/propidium iodide double staining. The values from three independent dose- and time-course experiments were tabulated and graphed. We found that G6 significantly induced apoptosis in both a dose- (Fig. 3A) and time- (Fig. 3B) dependent manner as measured by the number of cells that were annexin V-positive and propidium iodide-negative.
FIGURE 3.
G6 induces the intrinsic apoptotic pathway in HEL cells. For apoptotic measurements, Annexin V/propidium iodide double staining was employed. The values from three independent dose response (A) or time course (B) experiments were graphed. C, caspase 3/7 activity was measured as a function of G6 exposure time. D, after exposure to G6 for the indicated periods of time, whole cell protein lysates were Western blotted with either anti-PARP (top) or anti β-actin antibodies (bottom). Shown is one of three (A and B) or two (C and D) representative experiments. For A–C, the data are presented as the mean ± S.E.
A hallmark of apoptosis is the activation of caspase 3/7 and the subsequent downstream cleavage of PARP. To determine whether G6 treatment of HEL cells is concomitant with the activation of caspase 3/7 and the cleavage of PARP, HEL cells were treated with 25 μm of G6 for increasing periods of time and caspase 3/7 proteolytic activity was measured using a luminescence-based assay. We found that treatment of HEL cells with G6 significantly increased caspase 3/7 activity over time (Fig. 3C). To determine if G6 treatment is sufficient to cleave PARP, HEL cells were treated with 25 μm G6 for increasing periods of time and whole cell protein lysates were prepared. The samples were subsequently Western blotted with an anti-PARP antibody that recognizes both the full-length and cleaved forms of the protein. We found that treatment of the Jak2-V617F expressing HEL cells with G6 resulted in the cleavage of PARP over time (Fig. 3D, top). To confirm equal loading of all lanes, the same membrane was blotted with an anti β-actin antibody (Fig. 3D, bottom). Collectively, these data indicate that the mechanism by which G6 reduces HEL cell growth is via marked cell cycle arrest and induction of apoptosis.
G6 Inhibits Jak2-V617F-dependent Constitutive Activation of STAT5
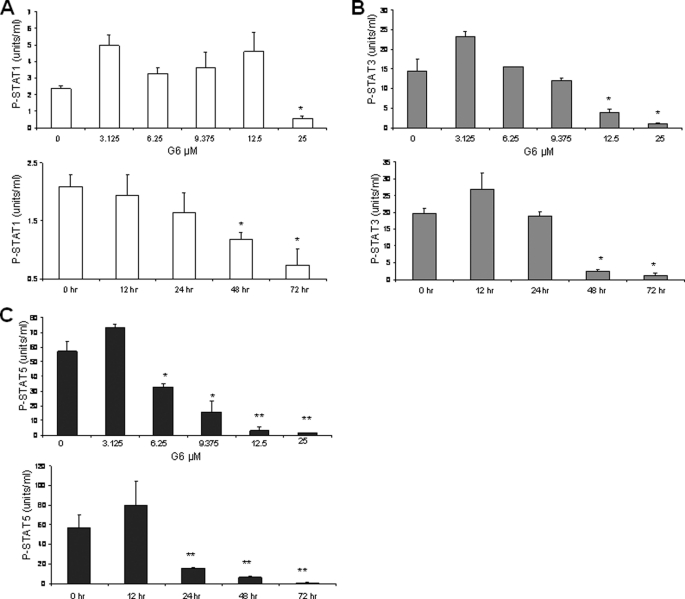
We previously showed that G6-mediated reduction in HEL cell numbers directly correlates with suppression of Jak2 kinase activity (19). We now wanted to determine whether treatment with G6 and subsequent HEL cell growth inhibition also correlated with reduced STAT signaling. This is important as it is possible that G6 could work through mechanisms that are independent of the Jak/STAT signaling pathway. Here, HEL cells were treated with either increasing concentrations of G6 or with 25 μm G6 for increasing periods of time. The levels of phospho-STAT1 (pY701), phospho-STAT3 (pY705), and phospho-STAT5a/b (pY694/699) were then simultaneously measured. We found that the dose- and time-dependent inhibition of phospho-STAT1 had little to no correlation with the reduced levels of HEL cell growth (Fig. 4A). The dose- and time-dependent inhibition of phospho-STAT3 exhibited only a modest correlation with the reduced levels of HEL cell growth (Fig. 4B). Finally, we observed that the dose- and time-dependent inhibition of phospho-STAT5a/b correlated very well with the G6-dependent inhibition of HEL cell growth (Fig. 4C). Thus, these results suggest that STAT1, STAT3 and STAT5a/b are differentially affected by G6 treatment, with STAT5 being the most sensitive. Furthermore, the reduction in phospho-STAT5 correlates very well with G6-mediated reduction in HEL cell growth (Fig. 1) and inhibition of Jak2 kinase activity (19). As such, our data suggest that G6 inhibits HEL cell growth via a Jak2/STAT5-dependent mechanism.
FIGURE 4.
G6 preferentially inhibits Jak2-V617F dependent constitutive activation of STAT5. HEL cells were treated with either increasing concentrations of G6 or with 25 μm G6 for increasing periods of time. The levels of phospho-STAT1 (pY701), phospho-STAT3 (pY705), and phospho-STAT5a/b (pY694/699) were then simultaneously measured. Dose- and time-dependent inhibition of phospho-STAT1 (A), phospho-STAT3 (B), and phospho-STAT5a/b (C) are shown. *, p < 0.05 versus DMSO control.
G6 Reduces Blast Cells in the Peripheral Blood and the Spleen Weight to Body Weight Ratio in a Murine Model of Jak2-V617F-dependent Hyperplasia
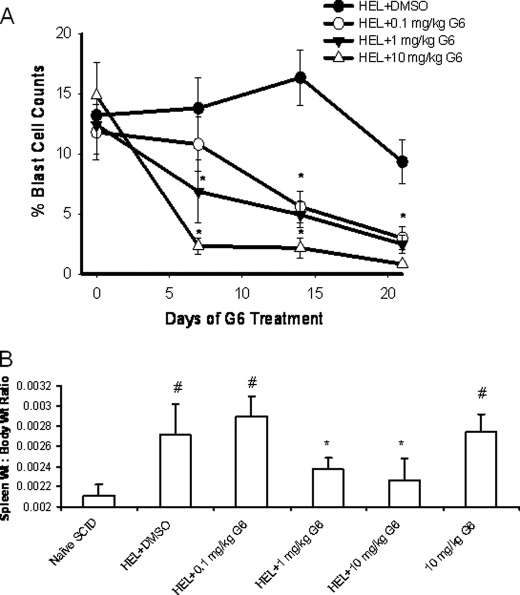
To test the in vivo efficacy of G6 at inhibiting Jak2-V617F-mediated pathologic cell growth, we generated a mouse model of human, Jak2-V617F-mediated hyperplasia by injecting 2 × 10⁶ HEL cells into the tail vein of immunodeficient NOD/SCID mice. We then treated the mice with increasing concentrations of G6 to determine the therapeutic efficacy of this stilbenoid compound. Mice injected with HEL cells followed by vehicle control injections rapidly developed a fully penetrant hematopoietic disease. Specifically, we found that injection of HEL cells resulted in the pathological appearance of blast cells in the peripheral blood and G6 treatment significantly reduced this pathological effect, in a dose-dependent manner (Fig. 5A).
FIGURE 5.
G6 decreases the percentage of blast cells in the peripheral blood and reduces the spleen weight to body weight ratio in a mouse model of Jak2-V617F-mediated hyperplasia. A, percentages of blast cells in the peripheral blood plotted as a function of both treatment group and days of treatment. *, p < 1.0 × 10⁻⁴ versus DMSO-treated mice. B, spleen to body weight ratio was obtained and plotted as a function of treatment group. #, p < 0.05 versus naïve mice; *, p < 0.05 versus HEL+DMSO.
To determine the efficacy of G6 at inhibiting Jak2-V617F-dependent hyperplasia via alternate means, spleen weight to body weight ratios were determined. We found that HEL cell injection and subsequent administration of vehicle control solution resulted in an increased spleen weight to body weight ratio and this deleterious effect was abrogated with G6 treatment (Fig. 5B). These data indicate that G6 suppresses Jak2-V617F-mediated pathologic cell growth in vivo, as evidenced by reduced blast cells in the peripheral blood and reduced spleen weight to body weight ratios.
G6 Corrects a Pathologically Low Myeloid to Erythroid Ratio by Reducing the Number of Mutant HEL Cells in the Bone Marrow of Mice
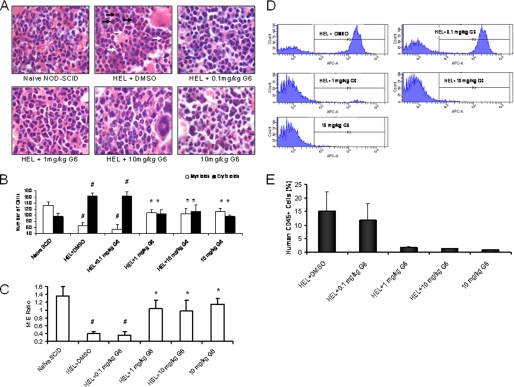
The in vivo anti-tumor activity of G6 was further investigated using histopathological analysis. Tissue sections from brain, liver, lungs and kidney appeared histologically normal and indistinguishable across all six treatment groups suggesting that G6 is not globally cytotoxic even at the 10 mg/kg dosage (data not shown). However, quantification of cellular elements of the bone marrow revealed marked changes; representative histological sections for each treatment group are shown (Fig. 6A). In mice that received HEL cells followed by vehicle control, two distinct populations of neoplastic cells were observed. The first were consistent with erythroblast morphology. These cells were ∼15 μm with a dark gray blue round nucleus and moderate, bluish cytoplasm (black arrows). The second population of cells was myleoid blasts (monoblasts or myeloblasts). These atypical myeloid cells were large (15–20 μm) with irregular nuclei that were frequently clefted. The chromatin pattern was finely stippled and lacy. Nucleoli were prominent and occasionally multiple. The nuclear to cytoplasmic ratio was high and the cytoplasm was pink (white arrows).
FIGURE 6.
G6 improves the M:E ratio in a mouse model of Jak2-V617F-mediated hyperplasia by reducing HEL cell engraftment in the bone marrow. After a 3-week period of drug or vehicle administration, all groups were euthanized and histological sections of the femurs were prepared. A, representative H&E stained bone marrow sections for each treatment group. B, number of mature myeloid and erythroid cells was determined. #, p < 0.05 relative to naïve; *, p < 0.05 relative to HEL+DMSO. C, myeloid and erythroid cell numbers plotted as the M:E ratio. #, p < 0.05 relative to naïve; *, p < 0.05 relative to HEL+DMSO. D, representative flow cytometry profiles of human CD45+ cells from each treatment group are shown. E, average percentages of human CD45+ cells present in the bone marrow were plotted as a function of treatment group.
The absolute numbers of myeloid and erythroid cells for each treatment group were determined (Fig. 6B) and subsequently plotted as the myeloid to erythroid (M:E) ratio (Fig. 6C). For the naïve group of animals, the M:E ratio was ∼1.4 (Fig. 6C). Injection of HEL cells and subsequent treatment with vehicle control caused a significant reduction of the M:E ratio that was driven by myeloid suppression and increased numbers of erythroid cells. The 0.1 mg/kg dosage of G6 was without effect on the cellular composition of the bone marrow as evidenced by the unchanged M:E ratio. However, for the 1 and 10 mg/kg doses, there was a significant correction of the M:E ratio that was driven by restoration of myeloid cells and suppression of erythroid cells. With respect to the mice that received G6 alone, we observed a small reduction in erythroid cell numbers and a moderate reduction in myeloid cells. However, the M:E ratio of this group was not significantly different from that of the naïve mice.
We reasoned that the therapeutic correction of the M:E ratio by G6 was due to reductions in the engraftment of the Jak2-V617F expressing HEL cells in the bone marrow. To validate this, we carried out flow cytometry analysis of bone marrow aspirates from the various treatment groups to identify the percentage of cells that were human CD45-positive; a marker found on HEL cells, but not on any of the mouse cells (data not shown). Representative profiles of individual animals are shown (Fig. 6D) and the aggregate data for all animals were graphed as a function of treatment group (Fig. 6E). We found that HEL cell injection alone resulted in robust bone marrow engraftment as evidenced by the appearance of human CD45+ cells in the aspirates. The 0.1 mg/kg dose was largely without effect. However, the 1 and 10 mg/kg dosages eliminated all human CD45+ cells from the marrow.
Overall, the data in Fig. 6 demonstrate that intravenous injection of HEL cells into NOD/SCID mice results in marked Jak2-V617F-mediated pathogenesis as evidenced by engraftment of these cells in the bone marrow and a skewing of the M:E ratio. However, G6 corrected these pathologies as evidenced by reduced numbers of HEL cells in the bone marrow and subsequent correction of the M:E ratio.
G6 Reduces the Levels of Phospho-STAT5 and Induces Cellular Apoptosis, in Vivo
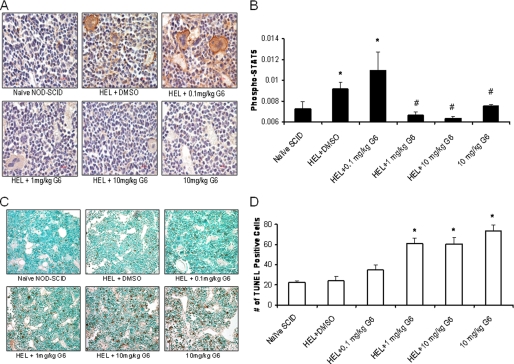
The data in Figs. 2–4 demonstrate that in vitro, G6 suppresses pathologic HEL cell growth via a mechanism that involves inhibition of STAT5 phosphorylation and induction of apoptosis. We hypothesized that this also occurs in vivo. To confirm this, we performed anti-phospho-STAT5a/b immunohistochemistry on bone marrow sections of animals from all the treatment groups. Representative sections from all treatment groups are shown (Fig. 7A). The relative phospho-STAT5 signal (brown colored stain) was then quantitated and graphed as a function of treatment group (Fig. 7B). We found that HEL cell injection alone resulted in a significant increase in phospho-STAT5 staining, suggestive of an increased proliferative state. However, G6 treatment at the 1 and 10 mg/kg doses significantly reduced this effect, suggesting that G6 suppresses STAT5 phosphorylation in vivo.
FIGURE 7.
G6 reduces the levels of phospho-STAT5 and induces cellular apoptosis in the bone marrow. A, representative anti phospho-STAT5 immunohistochemistry bone marrow sections from the indicated treatment groups. B, anti-phospho-STAT5 staining was quantified and plotted as a function of treatment group. *, p < 0.05 versus naïve; #, p < 0.05 versus HEL+DMSO. C, representative TUNEL stained bone marrow sections from each treatment group. D, bone marrow TUNEL-positive cells were counted and plotted as a function of treatment group. *, p < 0.05 versus HEL+DMSO.
To determine whether G6 induces apoptosis in vivo, bone marrow sections were analyzed via TUNEL staining. Representative sections for the six groups are shown (Fig. 7C). The number of TUNEL-positive cells were then counted and plotted as a function of treatment group (Fig. 7D). We found that G6 induced apoptosis in a dose-dependent manner. Overall, the data in Fig. 7 demonstrate that in vivo, G6 inhibits STAT5 phosphorylation and induces cellular apoptosis, two events that are essential for suppressing Jak2-V617F-mediated pathologic cell growth.
G6 Treatment Results in Normalization of Hematopoiesis in the Spleen
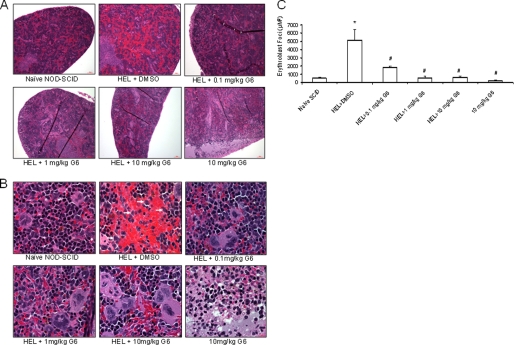
To determine the effect of G6 on the spleen, histological sections were prepared and viewed at 10× (Fig. 8A) and 100× (Fig. 8B) magnifications. Mice that received HEL cells + DMSO displayed neoplastic erythroid morphology when compared with naïve animals. Specifically, we observed large cells with lacy, vesicular chromatin (white arrows). Mice that received HEL cells and the 0.1 mg/kg/day dosage exhibited fewer neoplastic cells. Mice receiving HEL cells at the 1 and 10 mg/kg/day dosages of G6 had even fewer neoplastic cells as well as increasing megakaryopoietic activity, indicating a normalization of hematopoiesis within the spleen. Finally, in the cohort of mice that received G6 alone, four of the spleens were histologically normal, but two displayed some necrosis and edema; one of those two is shown.
FIGURE 8.
G6 treatment results in neoplastic regression and normalization of hematopoiesis in the spleen. Histological sections of the spleen were prepared from each treatment group and viewed at 10× magnification (A) and 100× magnification (B). Injection of HEL cells resulted in the appearance of neoplastic cells in the spleen (arrowheads in panel B) and this was reduced with G6 treatment. C, number of erythroblast foci were counted and plotted as a function of treatment group. *, p < 0.05 versus naïve; #, p < 0.05 versus HEL+DMSO.
To obtain a quantitative measure for the efficacy of G6 in the spleen, the number of pathological erythroblast foci was determined by computer-assisted morphometric analysis and then plotted as a function of treatment group (Fig. 8C). We found that G6 treatment provided significant therapeutic benefit as evidenced by a significant reduction in the number of erythroblast foci. Furthermore, these results had a positive correlation with spleen size; namely, the reduction in splenic erythroblast numbers directly correlated with decreased spleen size. Thus, the data in Fig. 8 suggest that G6 provides therapeutic benefit to the spleen in a mouse model of Jak2-V617F-mediated hyperplasia.
The Presence of G6 in the Plasma, Marrow and Spleen Correlates with Indicators of Therapeutic Efficacy
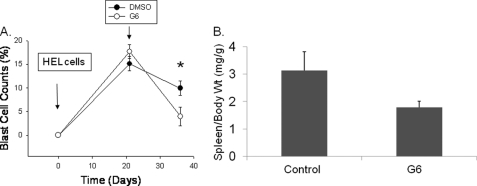
Finally, we wanted correlate the presence of G6 in hematopoietic tissues with indicators of therapeutic efficacy. For this, baseline body weights and peripheral blood samples were obtained from twelve NOD-SCID mice. The mice were subsequently injected, intravenously, with 2 × 10⁶ HEL cells. Three weeks later, peripheral blood samples were again obtained to confirm that the animals were in blast crisis, at which time the animals began receiving either vehicle control (DMSO) or G6 (1 mg/kg/day) via single, daily IP injections. After 2 weeks of injection, analysis of peripheral blood samples indicated that the G6-treated mice had significantly fewer blast cells in the peripheral blood when compared with the DMSO-injected mice (Fig. 9A). The mice were euthanized the following day, and the spleen weight to body weight ratios were determined for both treatment groups (Fig. 9B). We found that for the mice that received G6, the spleen weight to body weight ratio was reduced by ∼40% when compared with the mice that received vehicle control.
FIGURE 9.
Therapeutic indicators of G6 efficacy correlate with the present of G6 in the plasma, marrow, and spleen. A, percentages of blast cells in the peripheral blood plotted as a function of both treatment group and time. *, p < 0.05 versus DMSO-treated mice. B, spleen to body weight ratio was obtained and plotted as a function of treatment group.
To correlate these efficacious indicators to the presence of G6, the concentration of G6 in the plasma, marrow and spleen was determined. Analysis of the plasma samples that were collected at baseline and after HEL cell injection, but prior to any vehicle/drug injection, completely lacked G6 (data not shown). For the terminal plasma samples that were collected at euthanasia along with the marrow and spleen, G6 was completely absent in the samples that came from vehicle control-injected mice, but present in the samples that came from G6-treated mice (Table 1). Overall, the data in Fig. 9 and Table 1 correlate therapeutic efficacy in the form of decreased blast cells in the peripheral blood and reduced spleen weight to body weight ratios with the presence of G6 in the plasma, marrow and spleen.
TABLE 1.
Mass spectrometry results showing plasma and tissue concentrations of G6 at euthanasia
The standard curve was quadratic (1/×2) r = 0.9902 ranging from 0.005–5.00 μg/ml.
| Animal ID | Plasma | Bone Marrow | Spleen |
|---|---|---|---|
| μg/mla | mg/g of tissueb | mg/g of tissueb | |
| Vehicle-treatedc | |||
| 1 | No Peak | No Peak | No Peak |
| 2 | <0 | No Peak | No Peak |
| 3 | No Peak | No Peak | No Peak |
| 4 | No Peak | No Peak | No Peak |
| 5 | No Peak | No Peak | No Peak |
| 6 | No Peak | No Peak | No Peak |
| G6-treated | |||
| 1 | 0.010 | 0.249 | 0.402 |
| 2 | 2.710 | 0.106 | 0.063 |
| 3 | 0.024 | 1.490 | 0.336 |
| 4 | <0 | 0.057 | 0.205 |
| 5 | 0.023 | 0.041 | 0.203 |
| 6 | 2.700 | 0.025 | 0.834 |
a Average of replicate injections.
b Calculations based on average of four replicate injections back-calculated using analyte concentrations (mg/ml) divided by prepared tissue concentration (g/ml) resulting in mg/g of tissue concentrations.
c <0 indicates peak quantitates were below the 0 value of the standard curve. No Peak indicates no peak was observed in raw chromatography.
DISCUSSION
The main finding of this work is that G6 suppresses Jak2-V617F mediated hyperplasia, in vitro and in vivo. Chemically, G6 is classified as a stilbenoid. Stilbenoids are diarylethenes, that is, a hydrocarbon consisting of an ethene double bond substituted with a phenyl group on both carbon atoms of the double bond. Stilbenoids are known to have beneficial properties including anti-oxidative, anti-proliferative, and tumor-suppressive effects (20–22). Resveratrol, a naturally occurring stilbenoid found in the skin of red grapes, reduces the incidence of cardiovascular disease (23). Piceatannol, a naturally occurring phenolic stilbenoid, exhibits anti-tyrosine kinase activity. Specifically, it inhibits LMP2A, a tyrosine kinase associated with Epstein-Barr virus infections (24, 25). The significance of these reports is that there is marked precedent for stilbene compounds such as G6 possessing beneficial biological activity in general, and anti tyrosine kinase activity in particular.
Evaluation of the in vivo data suggests that we have identified dosages of G6 that range from subtherapeutic through toxic. Specifically, the 0.1 mg/kg/day dosage provided some observable benefit. This low dosage reduced the percentage of blast cells in the peripheral blood and neoplastic cells in the spleen. However, it was unable to alleviate the splenomegly or significantly reduce the numbers of HEL cells in the marrow. The 1 mg/kg/day dosage was highly therapeutic as evidenced by reductions of blast cells in the peripheral blood, reduced splenomegaly, elimination of HEL cells from the marrow with a corresponding correction of the M:E ratio, neoplastic regression in the spleen, and signs of return to normal hematopoiesis. Additionally, animals treated at this dose displayed absolutely no signs of histological toxicity. Finally, while the 10 mg/kg/day dosage clearly provided therapeutic benefit, one animal receiving this dose exhibited some splenic necrosis. However, the brains, lungs, kidneys, and livers from all these animals were histologically normal, indicating the G6-mediated cytotoxicity might be targeted to hematopoietic organs at this dose. For the mice that received the high dose of G6 alone, the marrow was hypo-cellular with two of six animals exhibiting some bone marrow necrosis. Overall, the spleen weight to body weight ratio for this cohort was increased (Fig. 5B). Two of the six spleens from this group were necrotic and edematous. However, the brains, lungs, kidneys, and livers from these mice were histologically normal. As such, the data suggest that when given alone at the 10 mg/kg/day dosage, G6 can be cytotoxic to hematopoietic tissues.
An important consideration is understanding the precise linkage between G6-mediated Jak2 inhibition, suppression of STAT5 phosphorylation and apoptosis within HEL cells as it relates to our xenograft model. Jak2/STAT signaling is known to positively regulate cell growth by directly increasing expression of the anti-apoptotic marker, Bcl-xL, via STAT-binding elements located in its proximal promoter region (26, 27). In a recently published work, we reported that G6 inhibits HEL cell growth via the down-regulation of Bcl-xL and this correlates with significantly reduced phospho-STAT5 levels (28). Furthermore, we showed that G6 treatment of HEL cells results in up-regulation of pro-apoptotic Bim, and cleavage of pro-apoptotic Bid, from its inactive precursor to its active form (28). In our work here, we show that G6 treatment results in reduced STAT5 phosphorylation within HEL cells (Fig. 4C) and within the bone marrow (Fig. 7, A and B). Additionally, we show here that treatment of HEL cells with G6 results in increased apoptosis (Fig. 3, A and B), increased caspase 3/7 activity (Fig. 3C), cleavage of PARP (Fig. 3D), and a dose-dependent increase of apoptosis levels within the bone marrow of treated mice (Fig. 7, C and D). As such, we believe that the underlying mechanism that allows G6 to provide therapeutic efficacy involves the direct inhibition of Jak2, the corresponding suppression of STAT5 phosphorylation, down-regulation of anti-apoptotic Bcl-xL, up-regulation of pro-apoptotic Bim, and cleavage of Bid.
Recent works have reported paradoxical effects regarding the efficacy of Jak2 inhibitors when tested in vitro versus in vivo. For example, while the Jak2 inhibitor CEP-701 exhibited good Jak2 efficacy in vitro, Santos et al. (29) reported that it failed to improve the marrow fibrosis or alleviate the burden of marrow derived Jak2-V617F mutant clones in humans suffering from PMF. Similarly, while the Jak2 inhibitor INCB16562 exhibited good Jak2 efficacy in vitro, Koppikar et al. (30) reported that it was unable to reduce the number of malignant clones in the bone marrow using a mouse model of MPLW515L-induced thrombocytosis and myelofibrosis. Likewise, while the Jak2 inhibitor compound CYT387 exhibited good Jak2 efficacy in vitro (15), work by Tyner et al. showed that it was unable to eliminate Jak2-V617F mutant clones in vivo using a murine myeloproliferative neoplasm model (31). This collective inability of putative Jak2 inhibitors to reduce the mutant Jak2 allele burden in the marrow was the focus of a very recent review (32). Our work here is significant in that we show that G6 not only exhibits excellent therapeutic efficacy in vitro, but also in vivo as measured by the critical elimination of mutant clones from the marrow of mice (Fig. 6D) and a corresponding correction of the M:E ratio (Fig. 6C). As such, our work suggests that stilbenoid-based compounds such as G6 may possess unique Jak2 inhibitory properties that other compounds lack.
In summary, we show that the stilbenoid compound, G6, has therapeutic efficacy against Jak2-V617F-mediated human pathogenesis in vitro and in vivo. As such, this compound may have practical applications in Jak2-related research and as a potential therapeutic agent.
Supplementary Material
Acknowledgments
We thank Steve McClellan for help with FACS analysis and Dr. Ann Fu for assistance with sample preparation. Naime Fliess assisted with the immunohistochemistry, and Marcus Moore assisted with the phospho-STAT analysis. We are indebted to Rebekah Baskin for editing the manuscript.
This work was supported, in whole or in part, by National Institutes of Health Grant R01-HL67277, an American Heart Association Greater Southeast Affiliate Grant in Aid (0855361E), a University of Florida Opportunity Fund Award, and a University of Florida/Moffitt Cancer Center Collaborative Initiative Award.

The on-line version of this article (available at http://www.jbc.org) contains supplemental Fig. S1.
- MPN
- myeloproliferative neoplasm
- PV
- polycythemia vera
- ET
- essential thrombocythemeia
- PMF
- primary meylofibrosis
- PARP
- poly (ADP-ribose) polymerase.
REFERENCES
- 1. Baxter E. J., Scott L. M., Campbell P. J., East C., Fourouclas N., Swanton S., Vassiliou G. S., Bench A. J., Boyd E. M., Curtin N., Scott M. A., Erber W. N., Green A. R. (2005) Lancet 365, 1054–1061 [DOI] [PubMed] [Google Scholar]
- 2. James C., Ugo V., Le Couédic J. P., Staerk J., Delhommeau F., Lacout C., Garçon L., Raslova H., Berger R., Bennaceur-Griscelli A., Villeval J. L., Constantinescu S. N., Casadevall N., Vainchenker W. (2005) Nature 434, 1144–1148 [DOI] [PubMed] [Google Scholar]
- 3. Levine R. L., Wadleigh M., Cools J., Ebert B. L., Wernig G., Huntly B. J., Boggon T. J., Wlodarska I., Clark J. J., Moore S., Adelsperger J., Koo S., Lee J. C., Gabriel S., Mercher T., D'Andrea A., Fröhling S., Döhner K., Marynen P., Vandenberghe P., Mesa R. A., Tefferi A., Griffin J. D., Eck M. J., Sellers W. R., Meyerson M., Golub T. R., Lee S. J., Gilliland D. G. (2005) Cancer Cell 7, 387–397 [DOI] [PubMed] [Google Scholar]
- 4. Kralovics R., Passamonti F., Buser A. S., Teo S. S., Tiedt R., Passweg J. R., Tichelli A., Cazzola M., Skoda R. C. (2005) N. Engl. J. Med. 352, 1779–1790 [DOI] [PubMed] [Google Scholar]
- 5. Zhao R., Xing S., Li Z., Fu X., Li Q., Krantz S. B., Zhao Z. J. (2005) J. Biol. Chem. 280, 22788–22792 [DOI] [PMC free article] [PubMed] [Google Scholar]
- 6. Jelinek J., Oki Y., Gharibyan V., Bueso-Ramos C., Prchal J. T., Verstovsek S., Beran M., Estey E., Kantarjian H. M., Issa J. P. (2005) Blood 106, 3370–3373 [DOI] [PMC free article] [PubMed] [Google Scholar]
- 7. Jones A. V., Kreil S., Zoi K., Waghorn K., Curtis C., Zhang L., Score J., Seear R., Chase A. J., Grand F. H., White H., Zoi C., Loukopoulos D., Terpos E., Vervessou E. C., Schultheis B., Emig M., Ernst T., Lengfelder E., Hehlmann R., Hochhaus A., Oscier D., Silver R. T., Reiter A., Cross N. C. (2005) Blood 106, 2162–2168 [DOI] [PubMed] [Google Scholar]
- 8. Levine R. L., Loriaux M., Huntly B. J., Loh M. L., Beran M., Stoffregen E., Berger R., Clark J. J., Willis S. G., Nguyen K. T., Flores N. J., Estey E., Gattermann N., Armstrong S., Look A. T., Griffin J. D., Bernard O. A., Heinrich M. C., Gilliland D. G., Druker B., Deininger M. W. (2005) Blood 106, 3377–3379 [DOI] [PMC free article] [PubMed] [Google Scholar]
- 9. Xing S., Wanting T. H., Zhao W., Ma J., Wang S., Xu X., Li Q., Fu X., Xu M., Zhao Z. J. (2008) Blood 111, 5109–5117 [DOI] [PMC free article] [PubMed] [Google Scholar]
- 10. Wernig G., Kharas M. G., Okabe R., Moore S. A., Leeman D. S., Cullen D. E., Gozo M., McDowell E. P., Levine R. L., Doukas J., Mak C. C., Noronha G., Martin M., Ko Y. D., Lee B. H., Soll R. M., Tefferi A., Hood J. D., Gilliland D. G. (2008) Cancer Cell 13, 311–320 [DOI] [PubMed] [Google Scholar]
- 11. Lacout C., Pisani D. F., Tulliez M., Gachelin F. M., Vainchenker W., Villeval J. L. (2006) Blood 108, 1652–1660 [DOI] [PubMed] [Google Scholar]
- 12. Lipka D. B., Hoffmann L. S., Heidel F., Markova B., Blum M. C., Breitenbuecher F., Kasper S., Kindler T., Levine R. L., Huber C., Fischer T. (2008) Mol. Cancer Ther. 7, 1176–1184 [DOI] [PubMed] [Google Scholar]
- 13. Ferrajoli A., Faderl S., Van Q., Koch P., Harris D., Liu Z., Hazan-Halevy I., Wang Y., Kantarjian H. M., Priebe W., Estrov Z. (2007) Cancer Res. 67, 11291–11299 [DOI] [PubMed] [Google Scholar]
- 14. Gozgit J. M., Bebernitz G., Patil P., Ye M., Parmentier J., Wu J., Su N., Wang T., Ioannidis S., Davies A., Huszar D., Zinda M. (2008) J. Biol. Chem. 283, 32334–32343 [DOI] [PubMed] [Google Scholar]
- 15. Pardanani A., Lasho T., Smith G., Burns C. J., Fantino E., Tefferi A. (2009) Leukemia 23, 1441–1445 [DOI] [PubMed] [Google Scholar]
- 16. Antonysamy S., Hirst G., Park F., Sprengeler P., Stappenbeck F., Steensma R., Wilson M., Wong M. (2009) Bioorg. Med. Chem. Lett 19, 279–282 [DOI] [PubMed] [Google Scholar]
- 17. Sandberg E. M., Ma X., He K., Frank S. J., Ostrov D. A., Sayeski P. P. (2005) J. Med. Chem. 48, 2526–2533 [DOI] [PubMed] [Google Scholar]
- 18. Sayyah J., Magis A., Ostrov D. A., Allan R. W., Braylan R. C., Sayeski P. P. (2008) Mol. Cancer Ther. 7, 2308–2318 [DOI] [PMC free article] [PubMed] [Google Scholar]
- 19. Kiss R., Polgár T., Kirabo A., Sayyah J., Figueroa N. C., List A. F., Sokol L., Zuckerman K. S., Gali M., Bisht K. S., Sayeski P. P., Keseru G. M. (2009) Bioorg. Med. Chem. Lett 19, 3598–3601 [DOI] [PMC free article] [PubMed] [Google Scholar]
- 20. Larrosa M., Tomás-Barberán F. A., Espín J. C. (2003) J. Agric. Food Chem. 51, 4576–4584 [DOI] [PubMed] [Google Scholar]
- 21. Le Corre L., Chalabi N., Delort L., Bignon Y. J., Bernard-Gallon D. J. (2005) Mol. Nutr. Food Res. 49, 462–471 [DOI] [PubMed] [Google Scholar]
- 22. Kimura Y. (2005) In Vivo 19, 37–60 [PubMed] [Google Scholar]
- 23. Pace-Asciak C. R., Hahn S., Diamandis E. P., Soleas G., Goldberg D. M. (1995) Clin. Chim. Acta 235, 207–219 [DOI] [PubMed] [Google Scholar]
- 24. Geahlen R. L., McLaughlin J. L. (1989) Biochem. Biophys. Res. Commun. 165, 241–245 [DOI] [PubMed] [Google Scholar]
- 25. Swanson-Mungerson M., Ikeda M., Lev L., Longnecker R., Portis T. (2003) J. Antimicrob. Chemother. 52, 152–154 [DOI] [PubMed] [Google Scholar]
- 26. Baker S. J., Rane S. G., Reddy E. P. (2007) Oncogene. 26, 6724–6737 [DOI] [PubMed] [Google Scholar]
- 27. Socolovsky M., Fallon A. E., Wang S., Brugnara C., Lodish H. F. (1999) Cell 98, 181–191 [DOI] [PubMed] [Google Scholar]
- 28. Majumder A., Govindasamy L., Magis A., Kiss R., Polgár T., Baskin R., Allan R. W., Agbandje-McKenna M., Reuther G. W., Keseru G. M., Bisht K. S., Sayeski P. P. (2010) J. Biol. Chem. 285, 31399–31407 [DOI] [PMC free article] [PubMed] [Google Scholar]
- 29. Santos F. P., Kantarjian H. M., Jain N., Manshouri T., Thomas D. A., Garcia-Manero G., Kennedy D., Estrov Z., Cortes J., Verstovsek S. (2010) Blood 115, 1131–1136 [DOI] [PMC free article] [PubMed] [Google Scholar]
- 30. Koppikar P., Abdel-Wahab O., Hedvat C., Marubayashi S., Patel J., Goel A., Kucine N., Gardner J. R., Combs A. P., Vaddi K., Haley P. J., Burn T. C., Rupar M., Bromberg J. F., Heaney M. L., de Stanchina E., Fridman J. S., Levine R. L. (2010) Blood 115, 2919–2927 [DOI] [PMC free article] [PubMed] [Google Scholar]
- 31. Tyner J. W., Bumm T. G., Deininger J., Wood L., Aichberger K. J., Loriaux M. M., Druker B. J., Burns C. J., Fantino E., Deininger M. W. (2010) Blood 115, 5232–5240 [DOI] [PMC free article] [PubMed] [Google Scholar]
- 32. Wadleigh M., Tefferi A. (2010) Clin. Adv. Hematol. Oncol. 8, 557–563 [PubMed] [Google Scholar]
Associated Data
This section collects any data citations, data availability statements, or supplementary materials included in this article.


