

Abstract
Tissue factor pathway inhibitor-2 (TFPI-2) inhibits factor XIa, plasma kallikrein, and factor VIIa/tissue factor; accordingly, it has been proposed for use as an anticoagulant. Full-length TFPI-2 or its isolated first Kunitz domain (KD1) also inhibits plasmin; therefore, it has been proposed for use as an antifibrinolytic agent. However, the anticoagulant properties of TFPI-2 or KD1 would diminish its antifibrinolytic function. In this study, structure-based investigations and analysis of the serine protease profiles revealed that coagulation enzymes prefer a hydrophobic residue at the P2′ position in their substrates/inhibitors, whereas plasmin prefers a positively charged arginine residue at the corresponding position in its substrates/inhibitors. Based upon this observation, we changed the P2′ residue Leu-17 in KD1 to Arg (KD1-L17R) and compared its inhibitory properties with wild-type KD1 (KD1-WT). Both WT and KD1-L17R were expressed in Escherichia coli, folded, and purified to homogeneity. N-terminal sequences and mass spectra confirmed proper expression of KD1-WT and KD1-L17R. Compared with KD1-WT, the KD1-L17R did not inhibit factor XIa, plasma kallikrein, or factor VIIa/tissue factor. Furthermore, KD1-L17R inhibited plasmin with ∼6-fold increased affinity and effectively prevented plasma clot fibrinolysis induced by tissue plasminogen activator. Similarly, in a mouse liver laceration bleeding model, KD1-L17R was ∼8-fold more effective than KD1-WT in preventing blood loss. Importantly, in this bleeding model, KD1-L17R was equally or more effective than aprotinin or tranexamic acid, which have been used as antifibrinolytic agents to prevent blood loss during major surgery/trauma. Furthermore, as compared with aprotinin, renal toxicity was not observed with KD1-L17R.
Keywords: Blood Coagulation Factors, Enzyme Inactivation, Enzyme Inhibitors, Fibrinolysis, Plasmin, Kunitz Inhibitors, TFPI Type 2
Introduction
Serine proteases are ubiquitous in living organisms and are involved in many physiologic processes, including digestion and respiration (1–3), blood coagulation and fibrinolysis (4, 5), kinin formation and tumorigenesis (6), complement activation and phagocytosis (7), osteoarthritis and bone remodeling (8, 9), as well as in ovogenesis and fertilization (10). Biologic activity of serine proteases is tightly regulated by their cognate inhibitors. A majority of these inhibitors are proteins, and based upon their unique folding characteristics, they are classified into the Kunitz (11), Kazal (12), Serpin (13), and mucus (14) families. The prototypical Kunitz inhibitor, aprotinin, also referred to as bovine basic pancreatic trypsin inhibitor (BPTI),5 is a single chain protein of 58 amino acids and has three intrachain disulfide bonds that are conserved in all family members (15). Although a human homolog of BPTI has not been identified, several larger human proteins that contain one or more Kunitz inhibitory domains are known.
Kunitz domain-containing proteins that inhibit coagulation and/or fibrinolysis include tissue factor pathway inhibitor type-1 (TFPI) (16), tissue factor pathway inhibitor type-2 (TFPI-2) (17), bikunin (18), and membrane-associated amyloid β-precursor protein (AβPP) (19). TFPI contains three Kunitz-type domains, and the physiologic function of the N-terminal first domain is to inhibit factor VIIa/tissue factor (FVIIa/TF), whereas the function of the second domain is to inhibit factor Xa (16). However, the isolated first domain also inhibits plasmin (Pm) and cathepsin G, whereas the isolated second domain also inhibits trypsin and chymotrypsin (20). No direct protease-inhibiting function has been ascribed to the third Kunitz domain (21). TFPI-2 features a domain organization similar to TFPI and via its Kunitz domain-1 inhibits trypsin, chymotrypsin, VIIa/TF, factor XIa (FXIa), plasma kallikrein (pKLK), and Pm (22, 23). The other two Kunitz domains in TFPI-2 have no known inhibitory function. Placental bikunin inhibits several proteases involved in intrinsic coagulation and fibrinolysis (18), whereas the Kunitz domain of AβPP inhibits FXIa and Pm (24). Thus, during evolution, insertion and/or duplication resulted in a diverse Kunitz family of proteins containing a broad spectrum of inhibitory as well as noninhibitory modules.
BPTI inhibits several serine proteases and has been used as a therapeutic agent, Trasylol® (25), to reduce blood loss during cardiac surgery (26). These benefits appear to be derived from its pKLK and/or Pm inhibitory activity (25). However, its use has been linked to kidney damage, myocardial infarction, and strokes (27, 28). Notably, BPTI is of bovine origin, and its anaphylactic potential has been a major concern (29). For these reasons, BPTI (aprotinin) has been taken off the clinical market. Thus, a human homolog with the least modifications to yield superior biochemical and clinical characteristics is needed to replace BPTI.
Several investigators have used a suitable 58-residue human Kunitz domain to obtain selective inhibitors of pKLK and/or Pm. Dennis et al. (30) and Markland et al. (31) used the AβPP domain (30) or the TFPI domain-1 (31) as a scaffold and phage display technology to obtain potent pKLK inhibitors, termed KALI-DY and EPI-K503, respectively. KALI-DY (30) differed in six residues from AβPP, and EPI-K503 (31) differed in seven residues from TFPI. Furthermore, KALI-DY also inhibited FXIa, whereas EPI-K503 inhibited FXIa and Pm with a Ki ∼30 nm. In a conceptually similar study, Markland et al. (32) used TFPI domain-1 to generate a potent Pm inhibitor, termed EPI-P302. The EPI-P302 differed in seven residues from TFPI domain-1 and exhibited very high affinity for Pm; however, it also inhibited FXIa and pKLK with Ki ∼200 nm. Moreover, in each case, as noted above, several residues were changed from the starting molecular scaffold, which could elicit an immune response in human subjects. In fact, anaphylactic reactions have been observed in patients treated with EPI-K503/DX-88 (33).
In this study, we used serine protease S2′/P2′ subsite6 profiling and a structure-based approach to engineer the Kunitz domain 1 of TFPI-2 (KD1) to selectively inhibit fibrinolysis. Our analysis indicates that coagulation proteases prefer hydrophobic residues at the P2′ position in their substrates/inhibitors, whereas Pm, a fibrinolytic enzyme, prefers a basic residue at this position. Thus, we inferred that replacing Leu with Arg at the P2′ site in KD1 could abolish its anticoagulant property while simultaneously enhancing its antifibrinolytic function. Moreover, such a small change in KD1 may not elicit an immune response in humans. Furthermore, as compared with BPTI (aprotinin) or tranexamic acid (TE), KD1-L17R was found to be more effective in reducing blood loss in a mouse liver laceration model, and kidney toxicity was not observed with KD1-L17R.
EXPERIMENTAL PROCEDURES
Materials
Escherichia coli strain BL21(DE3) pLysS and pET28a expression vector were obtained from Novagen Inc. (Madison, WI). Amicon centrifugal filter devices (3000 Mr cutoff) were purchased from Millipore (Bedford, MA). Q-Sepharose FF, Superdex 200, and His-Trap HP columns were obtained from Amersham Biosciences. Kanamycin and isopropyl thiogalactopyranoside were obtained from Sigma. Human α-thrombin (IIa), activated protein C (APC), FXIa, pKLK, and Pm were purchased from Hematologic Technologies Inc. BPTI was received from ZymoGenetics (Seattle), and human factor VIIa (FVIIa) was prepared as described previously (35). Tissue plasminogen activator (tPA; Alteplase) was purchased from Genentech (South San Francisco). Recombinant sTF was provided by Tom Girard (Monsanto/Pfizer, St. Louis, MO), and soluble thrombomodulin (sTM) was received from Dr. S. Krishnaswamy (Children's Hospital of Philadelphia). Recombinant TF containing the transmembrane domain (residues 1–243) was a gift from Genentech (San Francisco). Pm substrate S-2251 (H-d-Val-Leu-Lys-p-nitroanilide), pKLK, and FXIa substrate S-2366 (pyroGlu-Pro-Arg-p-nitroanilide), IIa and IIa/sTM substrate S-2238 (H-d-Phe-pip-Arg-p nitroanilide), and tPA, APC, and FVIIa substrate S-2288 (H-d-Ile-Pro-Arg-p nitroanilide) were obtained from Diapharma Inc. All other reagents were of the highest purity commercially available.
Expression and Purification of KD1-WT and KD1-L17R
Residues 1–73 of human TFPI-2 containing the first Kunitz domain were cloned and overexpressed as an N-terminal His6-tagged fusion protein in E. coli strain BL21(DE3) pLysS using the T7 promoter system. The recombinant plasmid derived from pET28a, containing a His6 leader sequence followed by a thrombin cleavage site and the cDNA encoding the KD1, was prepared according to standard procedures (36). The point mutant KD1-L17R was generated using the QuikChange® site-directed mutagenesis kit (Stratagene, La Jolla CA) according to the manufacturer's instructions. Both recombinant constructs were checked for in-frame orientation by nucleic acid sequencing. The His6-tagged KD1-WT and KD1-L17R fusion proteins were expressed in E. coli grown in Luria broth containing 15 mg/liter kanamycin and induced at 37 °C with 1 mm isopropyl thiogalactopyranoside at mid-log phase (A600 ∼0.9) for 4–6 h at 37 °C. The cells were harvested by centrifugation at 6000 × g and stored frozen at −20 °C.
The frozen cell pellets were suspended in 50 mm Tris, pH 7.2, containing a complete Mini® protease inhibitor mixture tablet from Roche Applied Science. After 15 min on ice, the cells were sonicated in lysis buffer (50 mm Tris, 60 mm EDTA, 1.5 m NaCl, 6% Triton X-100, pH 7.2), and inclusion bodies were recovered by centrifugation for 30 min at 12,000 × g. The inclusion bodies were solubilized in 20 mm sodium phosphate, pH 7.4, containing 0.5 m NaCl, 10 mm β-mercaptoethanol, and 8 m urea. The insoluble material was removed by centrifugation at 10,000 × g for 10 min, and the supernatant was applied to a nickel-charged His-Trap column. The column was washed with equilibration buffer (20 mm sodium phosphate, 0.5 m NaCl, 6 m urea, and 25 mm imidazole), and the His6-tagged KD1-WT (or KD1-L17R) fusion protein was eluted using a 25 mm to 1 m imidazole gradient.
The His-Trap purified KD1-WT (or KD1-L17R) was reduced with 50 mm dithiothreitol and dialyzed against 20 volumes of 50 mm Tris, pH 9.0, 6 m urea for 12 h at 4 °C. The dialyzed fusion protein was refolded using the reduced and oxidized glutathione system as described earlier (37, 38). The refolded protein was then purified using Q-Sepharose FF column, and the His6 tag was removed by proteolysis with IIa as outlined previously (38). His6 tag free protein was separated from the His6 tag and IIa using Superdex 200 gel filtration chromatography equilibrated with 50 mm Tris-HCl, pH 7.5, containing 100 mm NaCl (TBS). Each batch of purified protein was concentrated to >3 mg/ml using an Amicon centrifugal filter device with a 3000 Mr cutoff membrane.
Protease Inhibition Assay
All reactions were carried out in TBS, pH 7.5 (50 mm Tris-HCl, pH 7.5, containing 100 mm NaCl), containing 0.1 mg of BSA/ml (TBS/BSA) and 2 mm Ca2+ (TBS/BSA/Ca2+, pH 7.5). Each enzyme (Pm, pKLK, FXIa, APC, IIa, IIa/sTm, FVIIa/sTF, and tPA) was incubated with various concentrations (10−1 to 105 nm) of BPTI (aprotinin), KD1-WT, or KD1-L17R for 1 h at room temperature in a 96-well microtitration plate (total volume 100 μl). Synthetic substrate (5 μl) appropriate for each enzyme was then added to a final concentration of 1 Km, and residual amidolytic activity was measured in a Vmax kinetic microplate reader (Molecular Devices). The inhibition constant, Ki*′, was determined using the nonlinear regression data analysis program Grafit. Data for BPTI, KD1-WT, and KD1-L17R were analyzed with an equation for a tight-binding inhibitor (Equation 1) where vi and v0 are the inhibited and uninhibited rates, respectively, and [I]0 and [E]0 are the total concentrations of inhibitor and enzyme, respectively (39, 40).
 |
Inhibition data for APC, IIa, IIa/sTM, tPA, or FVIIa/sTF, where Ki*′ ≫ [E]0 were analyzed using Equation 2.
Ki* values were obtained by correcting for the effect of substrate according to Beith (39), using Equation 3, where [S] is substrate concentration and Km is specific for each enzyme.
Coagulation Assays
The inhibitory effects of aprotinin, KD1-WT, and KD1-L17R and TE were measured in the activated partial thromboplastin time (aPTT) and in dilute thromboplastin time using recombinant TF (24 pm functional concentration) prepared as described previously (35). In the aPTT assay, 50 μl of pooled normal human plasma (NPP) was incubated with 50 μl of aPTT reagent (Diapharma) and 50 μl of test sample in TBS/BSA, pH 7.5, for 5 min at 37 °C. A 50-μl volume of 35 mm CaCl2 at 37 °C was then added, and the clotting time recorded. In the TF-induced clotting assay, 80 μl of NPP each containing various concentrations of the test compound was incubated with 80 μl of dilute recombinant TF for 3 min at 37 °C at which point 80 μl of 25 mm CaCl2 at 37 °C was added and the clotting time recorded.
Fibrinolysis (Clot Lysis) Assay
In principal, the method followed was of that of Sperzel and Huetter (41) with a few modifications. As BPTI (aprotinin) inhibits intrinsic coagulation and KD1-WT inhibits both the extrinsic and the intrinsic pathways of coagulation, we chose IIa to initiate clotting and fibrin formation in NPP. The lysis of the formed clot (fibrinolysis) was induced by simultaneous addition of tPA. Clot formation and lysis were monitored with a microplate reader (SPECTRAmax 190, Molecular Devices) measuring the optical density at 405 nm. Briefly, 10 μl of each test compound or saline control was added to 240 μl of NPP. Two hundred twenty five μl of this mixture was then added to 25 μl of IIa and tPA in TBS/BSA containing 25 mm CaCl2. In the 250-μl final volume, concentration of IIa was 0.15 μg/ml and that of tPA was 1 μg/ml. Under control conditions (zero tPA and zero test compound), OD405 increased immediately indicating clotting followed by an extremely slow decrease representing fibrinolysis. As clotting was almost complete after 5 min, fibrinolysis induced by tPA was evaluated as a relative decrease of OD405 within 5–30 min. BPTI (aprotinin) was tested at final concentrations ranging from 0.1 to 8 μm, KD1-WT from 0.1 to 60 μm, KD1-L17R from 0.1 to 20 μm, and TE from 0.3 μm to 1 mm. Each compound was tested in triplicate.
Amino Acid Sequence Analysis and Mass Spectrometry
Automated N-terminal protein sequencing was performed using a pulsed-liquid solid phase sequenator with on-line phenylthiohydantoin-amino acid analysis (Applied Biosystems cLC system) at the UCLA Biopolymer Core Laboratory directed by Dr. Dave Teplow. MALDI-TOF (matrix-assisted laser desorption/ionization-time of flight) mass spectra (MS) were acquired using Applied Biosystems Voyager-DE-STR at the UCLA Molecular Instrumentation Center Core Facility directed by Dr. Joseph Loo.
Molecular Modeling and the Selected Serine Proteases P2′ Residue Specificity
The crystal structures of BPTI (42) and that of the KD1 (38) with trypsin have been determined. The crystal structure of the protease domain of Pm (43) and that of pKLK (44) have also been determined. Using these structures as templates, we modeled the complexes of protease domain of Pm and of pKLK with KD1 with high degree of accuracy. The structure of the protease domain of FXIa complexed with AβPP (45) was used to obtain the model of FXIa-KD1 complex, and the structure of FVIIa/sTF with a BPTI mutant was used to obtain the model of FVIIa-KD1 complex (46). Mutations in KD1 at position 17 were introduced using the program O (47). The relative positions of the inhibitors and the protease domains of various enzymes were maintained, and minor adjustments were only made in the side chains. Hydrophobic/van der Waals, hydrogen bonds, and ionic interactions were observed between each protease-inhibitor complex. All of these interactions were taken into consideration in evaluating each inhibitor-protease complex, and it was assumed that all potential hydrogen bond donors and acceptors would participate in these interactions. The protocols for modeling these complexes have been described earlier (21). For P2′/S2′ subsite specificity, the sequences of the various coagulation factors and selected other serine proteases as well as the sequence of Pm from different species were obtained from the Uniprot database (48). The ClustalW program was used for multiple sequence alignment (49).
Mouse Liver Laceration Model
A protocol using this mouse model to study efficacy of KD1 variants was approved by Chancellor's Animal Research Committee, UCLA. C57/BL6 mice (8–10 weeks old), weighing ∼20 g in weight were purchased from Taconic Farms (Germantown, NY). Animals were fed standard rodent chow and water and housed in a vivarium room with normal room temperature and 12-h light-dark cycles. Dosage of KD1 variants was comparable with that used in humans, i.e. 4 μg/g adjusted for mouse weight. A calculated blood level achieved by this dose was ∼8 μg/ml (∼1 μm) for each KD1 variant. Animals injected with BPTI (aprotinin, 4 μg/g) or TE (10 μg/g, calculated blood level of 20 μg/ml or ∼125 μm) were used as positive controls, and those receiving saline were used as negative controls. All four antifibrinolytic agents were free of lipopolysaccharide as tested using the Limulus amebocyte lysates kit (BioWhittaker Inc., Walkersville, MD).
Animals were injected intravenously via the tail vein, with the drug in a volume of 100 μl of sterile balanced salt solution immediately preceding anesthesia. Anesthesia was induced and maintained with Isofluorane. The animals were placed on a heating pad in supine position throughout the procedure to maintain rectal temperature at 37 °C. The abdomen was shaved and prepped. Liver was exposed via an anterior right subcostal incision. The left lobe of the liver was exteriorized by gentle continuous pressure on the left flank posteriorly. A 5-mm transverse incision was made on the left lobe at 1 cm from its inferior edge, using a sharp sterile number 10 scalpel blade. All blood oozing from the site of the left lobe incision was collected in a sterile preweighed 3 × 3-cm plastic tray for a total duration of 30 min. Animals were euthanized at the end of the 30-min period. Total blood loss was compared between different groups.
Statistical Methods
We compared mean total blood loss in milligrams from the mouse liver across five treatment groups (saline, BPTI, KD1-WT, TE, and KD1-L17R) using factorial one-way analysis of variance methods. The p value for comparing any two means was computed using a post hoc test under this analysis of variance model. Examination of the mean total blood loss error distribution pooled across all five treatments showed that it was normal (Gaussian) after controlling for the effect of treatment. The Shapiro-Wilk goodness of fit test was used to formally compare this distribution to a Gaussian. Thus, no transformations of total blood loss were needed.
Toxicity Studies
Toxicity studies were performed by an intravenous administration of BPTI using 2.5 times and the KD1-L17R using 3 times the dose employed in efficacy experiments. Following the injection of a single dose, animals (three in each group) were monitored closely for any obvious changes in appetite, behavior, activity, limb weakness, and body weight. The choice of time at which animals were euthanized for evaluation of organ injury was based on a time line of progression of aprotinin-induced renal injury in humans. In BPTI-treated animals, noticeable renal epithelial injury and tubular necrosis were detected on day 10, with a significant resolution by day 21. Accordingly, in a separate experiment, two animals each in BPTI and KD1-L17R group were euthanized on days 2, 10, and 20, and a terminal cardiac puncture was performed to obtain blood samples for renal and liver function tests prior to performing autopsies. Organ weight, gross microscopic examination, and full histopathologic examination were also performed.
RESULTS
As a rational approach for mutagenesis of KD1-WT for gain of function in Pm inhibition, we examined the modeled structures (see “Discussion”) of KD1-WT and of BPTI in complex with the catalytic domain of human Pm. From these modeled structures, it was inferred that changing Leu-17 (BPTI numbering) in KD1-WT to Arg would improve Pm inhibition and weaken inhibition of the coagulation enzyme(s). This concept was tested by expression of KD1-L17R and investigations of its inhibitory properties.
Sequence and Mass Spectrometry Analysis of Purified KD1-WT and KD1-L17R
His6-tagged KD1-WT and KD1-L17R were expressed in E. coli strain BL21(DE3)pLysS. The fusion proteins were refolded and purified using Q-Sepharose FF column. The His6 tag was then removed by proteolysis with IIa, and His6 tag-free proteins were separated from the His6 tag and IIa using Superdex 200 gel filtration chromatography. The N-terminal sequence of KD1-WT and that of KD1-L17R was the same (Gly-Ser-His-Met-Asp-Ala-Ala-Gln-Glu-Pro). Clearly, the His tag has been removed, and the proteins have the correct sequences. The mass spectra of KD1-WT and KD1-L17R are given in Fig. 1. The mass of each protein is within ±1 Da of the expected mass. From the mass spectra, we envision that all six Cys residues in the KD1 Kunitz domains are involved in making the correct three disulfide bonds. This was also seen in the crystal structure of KD1-WT with trypsin (38). Furthermore, each KD1 preparation migrated as a single band with an apparent molecular mass of ∼11,000 Da (Fig. 1, inset) in denaturing reduced SDS-polyacrylamide gels (50).
FIGURE 1.

MALDI-TOF mass spectra and SDS-PAGE analysis of KD1-WT and KD1-L17R. The mass spectra of KD1-WT (top) and KD1-L17R (bottom) obtained using Applied Biosystems Voyager-DE-STR are depicted. The spectra were calibrated so that the masses should be within ±1 Da. KD1-WT measured was 8844.8 Da and predicted was 8843.9 Da; KD1 L17R measured was 8888.2 Da and predicted was 8886.9 Da. Inset, reduced SDS-PAGE (15% acrylamide) of KD1-WT (top) and of KD1-L17R (bottom). Lane 1, mixture of reduced standard proteins; lane 2, 5 μg of KD1-WT (top) or 5 μg of KD1-L17R (bottom).
Effect of KD1-WT, KD1-L17R, BPTI, and TE on the Clotting Activity of Normal Plasma
KD1-WT prolonged the clotting times of normal plasma both in the aPTT (Fig. 2A) and in the dilute thromboplastin assay (Fig. 2B). BPTI (aprotinin) prolonged the clotting time of normal plasma only in the aPTT assay (Fig. 2A); however, it was somewhat more potent than KD1-WT. In contrast, KD1-L17R or TE did not prolong the normal plasma clot times in either of these two assays. These clotting data are consistent with the previous observations with BPTI (25), TE (41), and full-length TFPI-2 (22). From these observations, we infer that KD1-L17R might not inhibit pKLK, FXIa, or FVIIa/TF. Experimental results presented below support this hypothesis.
FIGURE 2.

Inhibition of plasma coagulation by BPTI, KD1-WT, KD1-L17R, and TE. A, activated partial thromboplastin time (aPTT); B, dilute thromboplastin time (dilute PT). Clotting times were obtained as outlined under “Experimental Procedures.”
Comparison of the Inhibitory Properties of KD1-WT, KD1-L17R, and BPTI
In agreement with previous studies (22, 23), KD1-WT inhibited pKLK, FXIa, and Pm with Ki* values of 25, 18, and 6 nm, respectively (Fig. 3 and Table 1). BPTI inhibited Pm with 0.5 nm Ki* and pKLK with 18 nm Ki*; however, it inhibited FXIa weakly with a Ki* value of ∼346 nm (Fig. 3 and Table 1). The Ki* values studied here for BPTI for each enzyme are in agreement with the values studied earlier (30–32).
FIGURE 3.
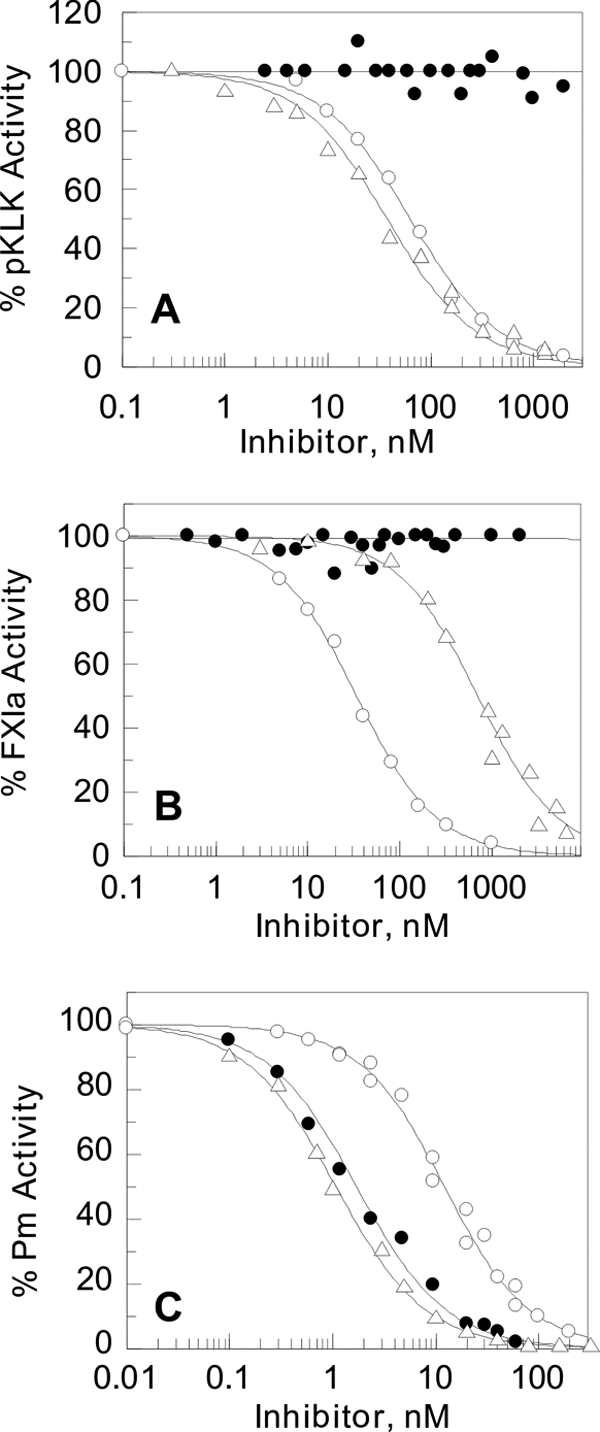
Determination of equilibrium dissociation constants (Ki*) of KD1-WT, KD1-L17R, and BPTI with pKLK, FXIa, and Pm. The enzyme activity is expressed as the percent fractional activity (inhibited rate/uninhibited rate) at increasing inhibitor concentrations. The dissociation constants (Ki*) were determined using Equations 1 and 2 as outlined under “Experimental Procedures.” Shown in A is the percent activity of 1 nm pKLK remaining in the presence of various concentrations of KD1-WT (○), KD1-L17R (●), and BPTI (Δ). Shown in B is the percent activity of 1 nm FXIa remaining in the presence of various concentrations of KD1-WT (○), KD1-L17R (●), and BPTI (Δ). Shown in C is the percent activity of 3 nm Pm remaining in the presence of various concentrations of KD1-WT (○), KD1-L17R (●), and BPTI (Δ). The Ki* values are listed in Table 1.
TABLE 1.
Ki* values for the inhibition of selected coagulation proteases, tPA and Pm, by KD1-WT, KD1-L17R, and BPTI
| Enzyme |
Ki* valuesa |
||
|---|---|---|---|
| KD1-WT | KD1-L17R | BPTI | |
| nm | |||
| pKLK | 25 ± 3 | >3000b | 18 ± 2 |
| FXIa | 18 ± 2 | >3000b | 346 ± 25 |
| Pm | 6 ± 0.5 | 0.9 ± 0.1 | 0.5 ± 0.1 |
| VIIa/sTF | ∼1000 | >3000b | >3000b |
| IIa | >3000b | >3000b | >3000b |
| IIa/sTM | >3000b | >3000b | ∼3000 |
| APC | >3000b | >3000b | ∼2000 |
| tPA | >3000b | >3000b | >3000b |
a All Ki* values represent an average of at least three independent measurements.
b Data represent lower limit Ki* values; the actual values could not be determined.
KD1-L17R did not inhibit pKLK or FXIa; however, it inhibited Pm with high affinity (Ki* ∼0.9 nm) very similar to BPTI (Fig. 3 and Table 1). Neither BPTI nor KD1-L17R inhibited FVIIa/sTF; however, as previously studied (22, 23), KD1-WT inhibited FVIIa/TF with ∼1 μm Ki*. Moreover, similar to KD1-WT, the KD1-L17R did not inhibit IIa, IIa/sTM, APC, or tPA (Table 1). In this context, BPTI only inhibited IIa/sTM and APC with Ki* values of 2–3 μm (Table 1). Collectively, our data presented in Figs. 2 and 3 corroborate that KD1-L17R is a very specific and potent inhibitor of Pm.
In the normal aPTT assay system, higher concentrations of KD1-WT were needed to inhibit clotting than those predicted from the Ki* value for FXIa inhibition. A most likely explanation for this could be that aPTT is a kinetic based assay, whereas the equilibrium inhibition constant Ki* was obtained upon prolonged incubation (1 h) of the inhibitor KD1-WT with the enzyme FXIa.
Fibrinolysis Assay
The objective of these experiments was to evaluate the potency of KD1-L17R in inhibiting tPA-induced plasma clot fibrinolysis. As shown in Fig. 4A, addition of IIa to NPP results in an increase in OD405 reflective of a stable fibrin clot formation (▴); however, simultaneous addition of tPA results in a biphasic curve with an initial increase in OD405 (fibrin formation), which is followed by a rapid decrease associated with the fibrinolytic activity (Fig. 4A, Δ) induced by Pm that is formed by the action of tPA on plasminogen. Using KD1-L17R as a representation, it reveals that antifibrinolytic agents inhibit fibrinolysis in a dose-dependent manner under these conditions (Fig. 4A). Such data were collected with each antifibrinolytic compound (BPTI, KD1-L17R, Kd1-WT, and TE). To better represent these experiments, results are presented as percent clot lysed at 12 min (the time when fibrin clot is completely lysed in the absence of inhibitor) as a function of inhibitor concentration (Fig. 4B). Under these conditions, BPTI inhibited fibrinolysis with an apparent IC50 of 0.31 ± 0.04 μm, KD1-L17R with an apparent IC50 of 0.36 ± 0.05 μm, KD1-WT with an apparent IC50 of 1.52 ± 0.24 μm, and TE with an apparent IC50 of 15.2 ± 1.71 μm, respectively. These results are in good agreement with the antifibrinolytic activity of BPTI and TE obtained by Sperzel and Huetter (41) under similar conditions. Of significance is the observation that KD1-L17R is very effective in inhibiting plasma clot fibrinolysis that is quite comparable with BPTI.
FIGURE 4.

Effect of KD1-WT, KD1-L17R, BPTI, and TE on fibrinolysis in human NPP. A, evaluation of fibrinolysis in NPP. IIa was added to NPP to initiate fibrin clot formation, which is associated with an increase in optical density at 405 nm (OD405). The clot was stable for 4 h; however, for clarity, the data are shown for up to 30 min only (▴). Simultaneously added tPA converted plasminogen to Pm, which dissolved the fibrin clot completely within ∼12 min, as indicated by an initial increase followed by a decrease in OD405 (Δ). Addition of KD1-L17R inhibited fibrinolysis in a dose-dependent manner as follows: 0.5 μm (●), 1 μm (○), 2 μm (■), and 4 μm (□), respectively. For comparison, such data were collected for all four antifibrinolytic compounds at varying concentrations, and fibrinolysis was evaluated as the % lysis (decrease in OD405) at 12 min, the time at which the fibrin clot is completely lysed without the added inhibitor. B, evaluation of the potency of various antifibrinolytic agents. BPTI was tested at concentrations ranging from 0.01 to 8 μm, KD1-L17R from 0.1 to 20 μm, KD1-WT from 0.1 to 60 μm, and TE from 0.3 to 1000 μm. The data are presented as average of three determinations. Percent clot lysis (y axis) at 12 min is plotted against inhibitor concentration (x axis, log scale). BPTI, Δ; KD1-L17R, ●; KD1-WT, ○; and TE, ▴.
Mouse Liver Laceration Model
Because tPA and excessive fibrinolysis is the main cause of bleeding in the liver laceration animal model (51), we evaluated the effects of BPTI, KD1-WT, KD1-L17R, and TE on blood loss in this animal model. These in vivo experiments complement the in vitro studies presented in Fig. 4. The effects of all four antifibrinolytic agents on the amount of blood loss are depicted in Fig. 5. As compared with saline, the amount of blood loss was reduced by ∼84% by KD1-L17R (p 0.0005), by ∼70% by BPTI (p 0.0036), ∼52% by TE (p 0.0196), and only ∼10% by KD1-WT (p 0.6505). Clearly, KD1-L17R is very effective in reducing blood loss in this animal model. Statistically, there was no significant difference in the amount of blood loss between KD1-L17R and BPTI-treated animals (p 0.5223). Furthermore, at this point, we cannot conclude whether there is a significant difference in the amount of blood loss between KD1-L17R and TE-treated animals (p 0.1312). Additional experiments using >40 animals in each group would be required to establish whether or not KD1-L17R is superior to BPTI and/or TE. In contrast, KD1-L17R was significantly effective compared with the KD1-WT treated animals (p 0.0017).
FIGURE 5.

Effect of KD1-WT, KD1-L17R, BPTI, and TE in a mouse liver laceration bleeding model. Animals were treated with saline, KD1-WT, KD1-L17R, BPTI, or TE by bolus injection, and - mm transverse incision was made on the left lobe at 1 cm from its inferior edge, using a sharp sterile number 10 scalpel blade. All blood oozing from the site of the left lobe incision was collected in a sterile preweighed 3 × 3-cm plastic tray for a total duration of 30 min. Total blood loss was compared between different groups. Data are presented as mean ± S.E. of 10 animals. Probability p values between different groups were as follows: 1) saline versus KD1-L17R, 0.0005; saline versus BPTI, 0.0036; saline versus TE, 0.0196; saline versus Kd1-WT, 0.6505; 2) KD1-L17R versus BPTI, 0.5223; KD1-L17R versus TE, 0.1312; KD1-L17R versus KD1-WT, 0.0017; and 3) KD1-WT versus BPTI, 0.0118; KD1-WT versus TE, 0.0578. *, p value < 0.01 compared with saline control.
Toxicity Studies
Out of the eight animals that were given an intravenous dose of BPTI (2.5× the efficacy dose) or KD1-L17R (3× the efficacy dose), necropsy was performed on two animals in each group on the following days, 2, 10, and 20. In the BPTI group, no injury was noted on day 2; moderate degree of multifocal renal tubular epithelial necrosis was noted on day 10 (Fig. 6A); and scattered areas of tubular necrosis with many areas of regeneration was noted on day 20. No injury was noted in KD1-L17R group (Fig. 6B) on any of these days. However, renal function tests such as blood urea nitrogen and serum creatinine were normal and remained essentially unchanged in both groups. Our animal data on BPTI toxicity corroborate previous findings that aprotinin causes renal dysfunction in humans (27, 52).
FIGURE 6.

Renal tubular necrosis with BPTI but not KD1-L17R. Photomicrographs of kidneys from mice 10 days after the injection of BPTI (A) and KD1-L17R (B) are shown. The dosage used was 2.5× for BPTI and 3× for KD1-L17R of the dose used in efficacy studies (Fig. 5). Tissues were fixed in formalin and stained with hematoxylin and eosin. Magnification is 40×. Thin arrow depicts tubular necrosis, and thick arrow depicts normal tubular epithelium in A. Tubular necrosis was not seen in group B.
DISCUSSION
Kunitz-type domains are compact stable modules and have been widely used for therapeutics where the extent of proteolysis must be carefully controlled; however, they lack specificity and often inhibit the target protease as well as anti-target proteases. For example, KD1 of TFPI-2 inhibits intrinsic and extrinsic coagulation as well as Pm, a fibrinolytic enzyme. The objective of this study was to minimally mutate KD1 such that the mutant molecule strongly inhibits plasmin without inhibiting extrinsic and/or the intrinsic pathway of coagulation. To accomplish this goal, we modeled complexes of protease domain of Pm and of selected coagulation proteases with KD1. We examined S2′/P2′ subsite interactions in these protease inhibitor complexes and predicted that changing residue Leu-17 to Arg in KD1 might abrogate the anticoagulant property of KD1 while simultaneously enhancing Pm inhibition. Experimental evidence presented in Figs. 2 and 3 supports this contention. The molecular models of protease domain of Pm with KD1-WT and mutants as well as those of pKLK, FXIa, and FVIIa with KD1-WT and KD1-L17R discussed below provide structural support for the experimental results.
Pm Protease Domain-KD1 Structural Model and S2′ Subsite Specificity
The protease-inhibitor complexes of Pm with KD1-WT and the mutants are shown in Fig. 7. Clearly the S2′ subsite pocket in Pm is outlined by strong electronegative surface that is primarily contributed by the side chain of residues Glu-73 and Glu-143 (chymotrypsin numbering). Although a small hydrophobic residues such as Leu can be accommodated in this pocket (Fig. 7A), a basic residue such as Arg is preferentially suited to interact with Glu-73 of Pm (Fig. 7B). In agreement with this concept, a search for the substrate preference for Pm reveals that it prefers P2′ Arg, Lys, Ser, or Thr residue at the S2′ site (Table 2). Similar to Arg at position 17 in KD1, Lys can also make an H-bond with Glu-73 of Pm (Fig. 7C). Because Arg is much more basic than Lys, it is expected that Arg will make stronger interactions with Glu-73 of Pm and contribute toward higher affinity (32).
FIGURE 7.

Modeled complexes of the protease domain of Pm with KD1-WT and Leu-17 mutants. Ribbon diagram of the overall structures of the complex of KD1-WT (yellow) with the protease domain of Pm (red) is shown on the left. The Leu-17 (BPTI numbering) of KD1-WT is shown in a stick representation. Enlarged views of the PyMol (53)-generated maps of the electrostatic potential at the solvent-accessible surface of the plasmin catalytic domain near residue 17 of KD1 are shown on the right. The residues within 6 Å radius of Leu-17 of KD1 were selected for display. The wild-type residue Leu-17 in KD1 is shown in A. The effect of mutation of KD1 Leu-17 to Arg is shown in B, to Lys in C, to Gln in D, and to Thr in E and F. Blue represents positive, red represents negative, and white represents hydrophobic surface potential. Red sphere represents water molecule. Single letter code and chymotrypsin numbering is used for residues of the protease domain of Pm as follows: M39 {585}, H40 {586}, F41 {587}, C42 {588}, E73 {623}, W141 {685}, G142 {686}, E143 {687}, Q192 {738}, G193 {739}, and D194 {740}. The numbers in braces represent Pm numbering. H-bonds are shown by dashed lines.
TABLE 2.
Specificity of P2′ subsite of Pm versus selected human coagulation serine proteases, matriptase and tPA/urokinase-type
Amino acid sequences of the substrates from P3 to P3′ subsites are shown. The arrow depicts the cleavage site in each case. P2′ residue is in boldface. The listed sequences cleaved by Pm are those that have not been reported to be cleaved by the other serine proteases. Note that Pm prefers Arg, Lys, Ser, or Thr at the P2′ subsite in its substrates/inhibitors, whereas the other proteases prefer nonpolar residues at this subsite. The abbreviations used are as follows: HMWK, high molecular weight kininogen; Fgn, fibrinogen; PAR, protease-activated receptor; Pgn, plasminogen; uPAR, urokinase plasminogen activator receptor; VEGF, vascular endothelial growth factor; CgA, chromogranin; OPN, osteopontin; MMP3, matrix metalloprotease 3; EPI, extrinsic pathway inhibitor same as TFPI type-1; uPA, urokinase Pgn activator.

Although Glu-143 contributes to S2′ electronegative potential, its side chain conformation along with that of Arg/Lys 17 could not be adjusted to make H-bond interactions. Without adjusting the main chain conformation, a constraint imposed on modeling, major steric conflicts were encountered for interaction of Arg/Lys-17 with Glu-143 of Pm to occur. In contrast, residue Thr (or Ser) at position 17 in KD1 could make an H-bond with Glu-143 directly (Fig. 7E) or through a water molecule with Glu-73 (Fig. 7F) in Pm. Further work, especially x-ray crystal structures, is needed to precisely define the S2′/P2′ interactions between Pm with KD1-WT and the P2′ site KD1 mutants.
It has been shown that Pm cleaves FVIII and FVa at sites where the P2′ residue is Gln (Table 2) (59, 65). Although Gln at P2′ position 17 in KD1 could be fitted into the S2′ pocket and might interact with Glu-73 of Pm through a water molecule (Fig. 7D), this interaction is not favorable due to two reasons. First, Gln side chain is neutral but rich in lone electron pairs, and the S2′ pocket itself is electronegative and rich in electrons. Second, interaction of neutral Gln (as compared with basic Arg or Lys) with Glu-73 of Pm is expected to be weaker. These considerations are consistent with previous observations that KD1-L17Q is a weak inhibitor of Pm (23).
pKLK-KD1, FXIa-KD1, and FVIIa-KD1 Structural Models and S2′ Subsite Specificity
The protease inhibitor complexes of pKLK, FXIa, and FVIIa with KD1-WT and KD1-L17R are given in supplemental Fig. S1. The S2′ subsite in these coagulation proteases consists of a hydrophobic pocket that prefers to accommodate a nonpolar residue such as P2′ Leu-17. Thus, the Arg or Lys residue at the P2′ position would not be favorable. In support of this, a search for substrate specificity of coagulation proteases, including pKLK, FXIa, FVIIa, as well as tPA, uPA, matriptase-2, and APC reveals that none of the substrates of these proteases contain Arg/Lys at P2′ position (Table 2). In pKLK or FVIIa, residue 73 is Leu, and it is Gln in FXIa. Although Gln-73 in FXIa has the potential to interact with Arg-17 in KD1, the interaction would be weaker as compared with Glu-73 in Pm. Moreover, conformation of the side chain of Gln-73 in FXIa is stabilized by two H-bonds, one with His-34 through its carbonyl oxygen, and the second with Thr-32 through its NH2 group (45).
Our data presented in Figs. 2 and 3 are consistent with the concept that coagulation proteases prefer a nonpolar residue at P2′ position in their substrates/inhibitors (6, 17, 23, 42). In this context, KD1-L17R has no inhibitory activity toward pKLK, FXIa, and FVIIa/sTF. This concept is also supported by the inhibitory profile of BPTI, which has P2′ Arg residue at position 17 (42). BPTI is a very strong inhibitor of Pm (Ki* ∼0.5 nm) as compared with pKLK (Ki* ∼20 nm), FXIa (Ki* ∼350 nm), or FVIIa/sTF (Ki* >3 μm). In support of this, modeling of protease domain of Pm in complex with BPTI revealed that Arg-17 of BPTI makes a salt bridge with Glu-73 of Pm (data not shown).
Nature of Residues 73 and 143 in Pm and Other Serine Proteases
The primary residues that provide negative electrostatic potential in S2′ pocket of Pm are residues Glu-73 and Glu-143. A data base search reveals that these residues are conserved in Pm from all species (Table 3). Furthermore, instead of an acidic residue, all coagulation proteases have neutral or basic residues at positions 73 and 143 (Table 3). Thus, it would appear that coagulation proteases prefer a hydrophobic residue at the P2′ position in their substrates, whereas Pm prefers a basic residue at this position. Therefore, coagulation proteases and Pm have different substrate specificities at P2′ position and might be used for development of selective synthetic inhibitors and/or substrates.
TABLE 3.
Amino acid sequence alignment of 70–80 and 140–155 loops (chymotrypsin numbering) of Pm and selected serine proteases surrounding the S2′ subsite pocket
Residues 73 and 143 are shaded and are acidic in Pm as compared with the other serine proteases involved in blood coagulation. To aid the reader in identifying the 70–80 and 140–150 segment positions in each protease, the actual sequence numbers (where available) are also given in braces following the name of the protease.

Pharmacologic Implications
First, the choice of the liver laceration model was based on documented enhancement of fibrinolysis in the setting of liver trauma in the clinical situation (51). This mimics the clinical indications for which BPTI (aprotinin) was used in the setting of enhanced fibrinolysis such as cardiac surgery, extremity, and organ trauma and organ transplant. Second, from the enzyme inhibition data and the in vivo animal data, KD1-L17R proved to be a very potent inhibitor of tPA-induced fibrin degradation and blood loss. The dose of KD1-L17R used was the same as the dose for BPTI (aprotinin) in clinical use. Based on calculated total body water, the dose of either BPTI or KD1-L17R translates to a plasma level of ∼8 μg/ml. This concentration is well above that required for effective inhibition in vitro of Pm by both BPTI and KD1-L17R (Figs. 3 and 4). Moreover, BPTI has a half-life of 2.5 h. KD1-L17R is similar in size to BPTI, and although no pharmacokinetic studies have been performed, it is presumed that its half-life would be about the same as BPTI. Therefore, a single dose given in an animal model where the total duration of bleeding is no more than 30 min is presumed to generate sufficient levels for the length of the experiment. Under these conditions, KD1-L17R was as effective or better in preventing blood loss either by BPTI or TE (Fig. 5). Although we did not challenge the animals hemostatically with antiplatelet agents or anticoagulants, we speculate that under such circumstances the dose may be repeated and/or the animal given a continuous infusion of the drug for enhancing its antifibrinolytic efficacy. Studies of the efficacy of KD1-L17R as an antifibrinolytic agent in hemostatically challenged animals and its pharmacokinetic studies are planned.
KD1-L17R does not induce renal toxicity in mice when used at higher doses (3×) compared with BPTI (2.5×). An argument may be made that toxicity studies were performed in normal animals not challenged by the perturbations of pre-existing medical conditions, nephrotoxic medications, prolonged general anesthesia, and blood loss, all of which predispose the organism to renal damage, as is the case clinically where BPTI was used. Nonetheless, BPTI used under similar conditions did cause obvious histopathologic changes as seen in Fig. 6. A plausible explanation for why there was no elevation in indices of renal function such as blood urea nitrogen and serum creatinine despite histopathologic changes, in animals administered toxic doses of BPTI, is that a considerable loss of nephron function is required before renal function tests become elevated. Therefore, it is conceivable that in a setting with above predisposing factors, BPTI could easily lead to detectable abnormality in renal function tests.
Two possible explanations for why KD1-L17R may not cause renal damage are as follows: 1) its acidic charge (isoelectric point 5.0, net charge −2.8, pH 7.5), which precludes it from collecting in the renal tubular epithelium as has been described with BPTI (isoelectric point 8.95, net charge +5.2, pH 7.5); 2) the finding that KD1-L17R does not inhibit pKLK, which leads to altered microcirculation in kidneys. Furthermore, KD1-L17R did not cause any detectable histopathologic changes in any other major organ, including heart, lungs, brain, and liver. KD1-L17R (and BPTI) also did not cause any seizures as indicated for TE (71, 72).
Conclusions
From the in vitro antifibrinolytic data and the in vivo animal data presented here, it is clear that KD1-L17R is a very potent inhibitor of tPA-induced fibrin degradation and loss of blood. KD1-L17R is also a specific inhibitor of Pm and does not inhibit pKLK, FXIa, or FVIIa/TF as opposed to the native TFPI-2 or KD1-WT. In this context, it should be noted that TFPI-2 has been proposed to be used as an anticoagulant (73); however, its anti-Pm activity could offset its proposed beneficial effect. Similarly, KD1-WT has been proposed to be used as anti-Pm agent (74); however, its anticoagulant activity could offset such an effect. Moreover, data presented in this study do not support any efficacy of KD1-WT in the liver laceration mouse injury model. Furthermore, KD1-R15K (BPTI numbering) has also been proposed to be used as an anti-Pm agent (74); however, no supporting evidence is presented as to its efficacy in any animal model.
KD1-L17R does not induce renal toxicity as compared with BPTI or seizures as is the case with TE. Moreover, it is of human origin and differs only from the native protein by one amino acid as compared with EPI-302 (32), which differs in seven residues from the native TFPI Kunitz domain. Thus, KD1-L17R might not be immunogenic. Furthermore, EPI-K503/DX-88/Ecallantide, a specific inhibitor of pKLK, was not effective in reducing blood loss in on-pump cardiothoracic surgery (75), where BPTI is very effective in this setting. Thus, the effect of BPTI is due to its ability to inhibit Pm and not pKLK. KD1-L17R inhibits Pm and none of the coagulation enzymes, including pKLK. Thus, it could represent as an alternative to BPTI (aprotinin) therapy in clinical settings where excessive blood loss is anticipated. Importantly, our data indicate that S2′/P2′ subsite interactions play a major role in Pm/inhibitor selectivity.
Acknowledgments
We thank Dr. Jeffery Gornbein of Department of Biomathematics, UCLA, for help with the statistical analysis of the animal bleeding data. We also thank Dr. Teplow for amino acid sequence analysis and Dr. Loo for MALDI-TOF MS analysis.
This work was supported, in whole or in part, by National Institutes of Health Grants R21HL89661 and RO1HL36365.
This article was selected as a Paper of the Week.

The on-line version of this article (available at http://www.jbc.org) contains supplemental Fig. 1S.
KD1 and BPTI residues P2, P1, P1′, P2′ are numbered according to Schechter and Berger (34). The corresponding subsites are S2, S1, S1′, S2′ in the enzyme, respectively. The residue numbering corresponds to that of BPTI such that residue 15 is at the P1 position. For comparison, KD1 is numbered using the BPTI numbering system such that residue 15 in BPTI numbering corresponds to residue 24 in KD1. Thus, the BPTI numbering and KD1 numbering differ by 9 throughout. The chymotrypsin amino acid numbering system is used throughout for the protease domain of Pm, FXIa, pKLK, and FVIIa. For example, residue 73 in chymotrypsin numbering corresponds to 623 in Pm, 433 in FXIa, 435 in pKLK, and 213 in FVIIa. In Fig. 7 and Table 2, the amino acid corresponding to a given protease is given in braces (e.g. {623}). Where insertions occur, the chymotrypsin numbering is followed by a capital letter, such as A.
- BPTI
- bovine pancreatic trypsin inhibitor
- TFPI
- tissue factor pathway inhibitor-1
- TFPI-2
- tissue factor pathway inhibitor-2
- KD1
- Kunitz domain 1 of TFPI-2
- AβPP
- amyloid β-precursor protein
- IIa
- α-thrombin
- factor VIIa
- FVIIa
- TF
- tissue factor
- sTM
- soluble thrombomodulin
- sTF
- soluble TF
- FXIa
- factor XIa
- APC
- activated protein C
- tPA
- tissue plasminogen activator
- pKLK
- plasma kallikrein
- Pm
- plasmin
- aPTT
- activated partial thromboplastin time
- TE
- tranexamic acid
- NPP
- normal pooled plasma.
REFERENCES
- 1. Neurath H., Walsh K. A. (1976) Proc. Natl. Acad. Sci. U.S.A. 73, 3825–3832 [DOI] [PMC free article] [PubMed] [Google Scholar]
- 2. Huber R., Bode W. (1978) Acc. Chem. Res. 11, 114–122 [Google Scholar]
- 3. Whitcomb D. C., Lowe M. E. (2007) Dig. Dis. Sci. 52, 1–17 [DOI] [PubMed] [Google Scholar]
- 4. Davie E. W. (2003) J. Biol. Chem. 278, 50819–50832 [DOI] [PubMed] [Google Scholar]
- 5. Plow E. F., Hoover-Plow J. (2004) Trends Cardiovasc. Med. 14, 180–186 [DOI] [PubMed] [Google Scholar]
- 6. Debela M., Magdolen V., Schechter N., Valachova M., Lottspeich F., Craik C. S., Choe Y., Bode W., Goettig P. (2006) J. Biol. Chem. 281, 25678–25688 [DOI] [PubMed] [Google Scholar]
- 7. Gros P., Milder F. J., Janssen B. J. (2008) Nat. Rev. Immunol. 8, 48–58 [DOI] [PubMed] [Google Scholar]
- 8. Wu J., Liu W., Bemis A., Wang E., Qiu Y., Morris E. A., Flannery C. R., Yang Z. (2007) Arthritis Rheum. 56, 3675–3684 [DOI] [PubMed] [Google Scholar]
- 9. Daci E., Everts V., Torrekens S., Van Herck E., Tigchelaar-Gutterr W., Bouillon R., Carmeliet G. (2003) J. Bone Miner. Res. 18, 1167–1176 [DOI] [PubMed] [Google Scholar]
- 10. Ebisch I. M., Steegers-Theunissen R. P., Sweep F. C., Zielhuis G. A., Geurts-Moespot A., Thomas C. M. (2007) Fertil. Steril. 87, 619–626 [DOI] [PubMed] [Google Scholar]
- 11. Kunitz M., Northrop J. H. (1936) J. Gen. Physiol. 19, 991–1007 [DOI] [PMC free article] [PubMed] [Google Scholar]
- 12. Kazal L. A., Spicer D. S., Brahinsky R. A. (1948) J. Am. Chem. Soc. 70, 3034–3040 [DOI] [PubMed] [Google Scholar]
- 13. Potempa J., Korzus E., Travis J. (1994) J. Biol. Chem. 269, 15957–15960 [PubMed] [Google Scholar]
- 14. Wiedow O., Schröder J. M., Gregory H., Young J. A., Christophers E. (1990) J. Biol. Chem. 265, 14791–14795 [PubMed] [Google Scholar]
- 15. Laskowski M., Jr., Kato I. (1980) Annu. Rev. Biochem. 49, 593–626 [DOI] [PubMed] [Google Scholar]
- 16. Girard T. J., Warren L. A., Novotny W. F., Likert K. M., Brown S. G., Miletich J. P., Broze G. J., Jr. (1989) Nature 338, 518–520 [DOI] [PubMed] [Google Scholar]
- 17. Sprecher C. A., Kisiel W., Mathewes S., Foster D. C. (1994) Proc. Natl. Acad. Sci. U.S.A. 91, 3353–3357 [DOI] [PMC free article] [PubMed] [Google Scholar]
- 18. Delaria K. A., Muller D. K., Marlor C. W., Brown J. E., Das R. C., Roczniak S. O., Tamburini P. P. (1997) J. Biol. Chem. 272, 12209–12214 [DOI] [PubMed] [Google Scholar]
- 19. Ponte P., Gonzalez-DeWhitt P., Schilling J., Miller J., Hsu D., Greenberg B., Davis K., Wallace W., Lieberburg I., Fuller F. (1988) Nature 331, 525–527 [DOI] [PubMed] [Google Scholar]
- 20. Petersen L. C., Bjørn S. E., Olsen O. H., Nordfang O., Norris F., Norris K. (1996) Eur. J. Biochem. 235, 310–316 [DOI] [PubMed] [Google Scholar]
- 21. Bajaj M. S., Birktoft J. J., Steer S. A., Bajaj S. P. (2001) Thromb. Haemost. 86, 959–972 [PubMed] [Google Scholar]
- 22. Petersen L. C., Sprecher C. A., Foster D. C., Blumberg H., Hamamoto T., Kisiel W. (1996) Biochemistry 35, 266–272 [DOI] [PubMed] [Google Scholar]
- 23. Chand H. S., Schmidt A. E., Bajaj S. P., Kisiel W. (2004) J. Biol. Chem. 279, 17500–17507 [DOI] [PubMed] [Google Scholar]
- 24. Ohri S. K., Parratt R., White T., Becket J., Brannan J. J., Hunt B. J., Taylor K. M. (2001) Perfusion 16, 199–206 [DOI] [PubMed] [Google Scholar]
- 25. Fritz H., Wunderer G. (1983) Arzneimittel-Forschung Res. 33, 479–494 [PubMed] [Google Scholar]
- 26. Royston D., van Haaften N., De Vooght P. (2007) Eur. J. Anaesthesiol. 24, 6–14 [DOI] [PubMed] [Google Scholar]
- 27. Mangano D. T., Tudor I. C., Dietzel C. (2006) N. Engl. J. Med. 354, 353–365 [DOI] [PubMed] [Google Scholar]
- 28. Immer F. F., Jent P., Englberger L., Stalder M., Gygax E., Carrel T. P., Tevaearai H. T. (2008) Heart Surg. Forum 11, E9–E12 [DOI] [PubMed] [Google Scholar]
- 29. Beierlein W., Scheule A. M., Dietrich W., Ziemer G. (2005) Ann. Thorac. Surg. 79, 741–748 [DOI] [PubMed] [Google Scholar]
- 30. Dennis M. S., Herzka A., Lazarus R. A. (1995) J. Biol. Chem. 270, 25411–25417 [DOI] [PubMed] [Google Scholar]
- 31. Markland W., Ley A. C., Ladner R. C. (1996) Biochemistry 35, 8058–8067 [DOI] [PubMed] [Google Scholar]
- 32. Markland W., Ley A. C., Lee S. W., Ladner R. C. (1996) Biochemistry 35, 8045–8057 [DOI] [PubMed] [Google Scholar]
- 33. Caballero T., López-Serrano C. (2006) J. Allergy Clin. Immunol. 117, 476–477 [DOI] [PubMed] [Google Scholar]
- 34. Schechter I., Berger A. (1967) Biochem. Biophys. Res. Commun. 27, 157–162 [DOI] [PubMed] [Google Scholar]
- 35. Bajaj S. P., Schmidt A. E., Agah S., Bajaj M. S., Padmanabhan K. (2006) J. Biol. Chem. 281, 24873–24888 [DOI] [PubMed] [Google Scholar]
- 36. Sambrook J., Russel D. W. (2001) Molecular Cloning: A Laboratory Manual, 3rd Ed., Cold Spring Harbor Laboratory Press, Cold Spring Harbor, NY [Google Scholar]
- 37. Stone M. J., Ruf W., Miles D. J., Edgington T. S., Wright P. E. (1995) Biochem. J. 310, 605–614 [DOI] [PMC free article] [PubMed] [Google Scholar]
- 38. Schmidt A. E., Chand H. S., Cascio D., Kisiel W., Bajaj S. P. (2005) J. Biol. Chem. 280, 27832–27838 [DOI] [PubMed] [Google Scholar]
- 39. Beith J. G. (1984) Biochem. Med. 32, 287–397 [Google Scholar]
- 40. Morrison J. F., Walsh C. T. (1988) Adv. Enzymol. Relat. Areas Mol. Biol. 61, 201–301 [DOI] [PubMed] [Google Scholar]
- 41. Sperzel M., Huetter J. (2007) J. Thromb. Haemost. 10, 2113–2118 [DOI] [PubMed] [Google Scholar]
- 42. Helland R., Otlewski J., Sundheim O., Dadlez M., Smalås A. O. (1999) J. Mol. Biol. 287, 923–942 [DOI] [PubMed] [Google Scholar]
- 43. Parry M. A., Fernandez-Catalan C., Bergner A., Huber R., Hopfner K. P., Schlott B., Gührs K. H., Bode W. (1998) Nat. Struct. Biol. 5, 917–923 [DOI] [PubMed] [Google Scholar]
- 44. Tang J., Yu C. L., Williams S. R., Springman E., Jeffery D., Sprengeler P. A., Estevez A., Sampang J., Shrader W., Spencer J., Young W., McGrath M., Katz B. A. (2005) J. Biol. Chem. 280, 41077–41089 [DOI] [PubMed] [Google Scholar]
- 45. Navaneetham D., Jin L., Pandey P., Strickler J. E., Babine R. E., Abdel-Meguid S. S., Walsh P. N. (2005) J. Biol. Chem. 280, 36165–36175 [DOI] [PubMed] [Google Scholar]
- 46. Zhang E., St Charles R., Tulinsky A. (1999) J. Mol. Biol. 285, 2089–2104 [DOI] [PubMed] [Google Scholar]
- 47. Jones T. A., Zou J. Y., Cowan S. W., Kjeldgaard M. (1991) Acta Crystallogr. A. 47, 110–119 [DOI] [PubMed] [Google Scholar]
- 48. Jain E., Bairoch A., Duvaud S., Phan I., Redaschi N., Suzek B. E., Martin M. J., McGarvey P., Gasteiger E. (2009) BMC Bioinformatics 10, 136 [DOI] [PMC free article] [PubMed] [Google Scholar]
- 49. Larkin M. A., Blackshields G., Brown N. P., Chenna R., McGettigan P. A., McWilliam H., Valentin F., Wallace I. M., Wilm A., Lopez R., Thompson J. D., Gibson T. J., Higgins D. G. (2007) Bioinformatics 23, 2947–2948 [DOI] [PubMed] [Google Scholar]
- 50. Laemmli U. K. (1970) Nature 227, 680–685 [DOI] [PubMed] [Google Scholar]
- 51. Groh J., Welte M., Azad S. C., Kratzer M. A. (1993) Infusionsther. Transfusion Med. 4, 173–179 [PubMed] [Google Scholar]
- 52. Karkouti K., Beattie W. S., Dattilo K. M., McCluskey S. A., Ghannam M., Hamdy A., Wijeysundera D. N., Fedorko L., Yau T. M. (2006) Transfusion 46, 327–338 [DOI] [PubMed] [Google Scholar]
- 53. The PyMOL Molecular Graphics System (2010) Version 1.3, Schrödinger, LLC, New York [Google Scholar]
- 54. Takagi T., Doolittle R. F. (1975) Biochemistry 14, 940–946 [DOI] [PubMed] [Google Scholar]
- 55. Samis J. A., Ramsey G. D., Walker J. B., Nesheim M. E., Giles A. R. (2000) Blood 95, 943–951 [PubMed] [Google Scholar]
- 56. Pryzdial E. L., Lavigne N., Dupuis N., Kessler G. E. (1999) J. Biol. Chem. 274, 8500–8505 [DOI] [PubMed] [Google Scholar]
- 57. Beaufort N., Leduc D., Rousselle J. C., Namane A., Chignard M., Pidard D. (2004) FEBS Lett. 574, 89–94 [DOI] [PubMed] [Google Scholar]
- 58. Jiang X., Couchman J. R. (2003) J. Histochem. Cytochem. 51, 1393–1410 [DOI] [PMC free article] [PubMed] [Google Scholar]
- 59. Jiang Q., Taupenot L., Mahata S. K., Mahata M., O'Connor D. T., Miles L. A., Parmer R. J. (2001) J. Biol. Chem. 276, 25022–25029 [DOI] [PubMed] [Google Scholar]
- 60. Nogami K., Shima M., Matsumoto T., Nishiya K., Tanaka I., Yoshioka A. (2007) J. Biol. Chem. 282, 5287–5295 [DOI] [PubMed] [Google Scholar]
- 61. Christensen B., Schack L., Kläning E., Sørensen E. S. (2010) J. Biol. Chem. 285, 7929–7937 [DOI] [PMC free article] [PubMed] [Google Scholar]
- 62. Nagase H., Enghild J. J., Suzuki K., Salvesen G. (1990) Biochemistry 29, 5783–5789 [DOI] [PubMed] [Google Scholar]
- 63. McSweeney P. L. H., Olson N. F., Fox P. F., Healy A., Højrup P. (1993) Food Biotech. 7, 143–158 [Google Scholar]
- 64. Hervio L. S., Coombs G. S., Bergstrom R. C., Trivedi K., Corey D. R., Madison E. L. (2000) Chem. Biol. 7, 443–453 [DOI] [PubMed] [Google Scholar]
- 65. Mann K. G., Kalafatis M. (2003) Blood 101, 20–30 [DOI] [PubMed] [Google Scholar]
- 66. Colman R. W. (2006) in Hemostasis and Thrombosis: Basic Principles and Clinical Practice (Colman R. W., Marder V. J., Clowes A. W., George J. N., Goldhaber S. Z. eds) 5th Ed., pp. 107–130, Lippincott Williams & Wilkins, Philadelphia [Google Scholar]
- 67. Davie E. W., Greenberg D. L. (2006) in Hemostasis and Thrombosis: Basic Principles and Clinical Practice (Colman R. W., Marder V. J., Clowes A. W., George J. N., Goldhaber S. Z. eds) 5th Ed., pp. 21–58, Lippincott Williams & Wilkins, Philadelphia [Google Scholar]
- 68. Eaton D., Rodriguez H., Vehar G. A. (1986) Biochemistry 25, 505–512 [DOI] [PubMed] [Google Scholar]
- 69. Macfarlane S. R., Seatter M. J., Kanke T., Hunter G. D., Plevin R. (2001) Pharmacol. Rev. 53, 245–282 [PubMed] [Google Scholar]
- 70. Booth N. A., Bachmann F. (2006) in Hemostasis and Thrombosis: Basic Principles and Clinical Practice (Colman R. W., Marder V. J., Clowes A. W., George J. N., Goldhaber S. Z. eds) 5th Ed., pp. 365–380, Lippincott Williams & Wilkins, Philadelphia [Google Scholar]
- 71. Breuer T., Martin K., Wilhelm M., Wiesner G., Schreiber C., Hess J., Lange R., Tassani P. (2009) Eur. J. Cardiothorac. Surg. 35, 167–171 [DOI] [PubMed] [Google Scholar]
- 72. Murkin J. M., Falter F., Granton J., Young B., Burt C., Chu M. (2010) Anesth. Analg. 110, 350–353 [DOI] [PubMed] [Google Scholar]
- 73. Sprecher C. A., Kisiel W., Foster D. C. (March 17, 1998) U. S. Patent 5,728,674
- 74. Kisiel W., Chand H. S. (October 7, 2008) U. S. Patent 7,432,238
- 75. Lehmann A. (2008) Expert Opin. Biol. Ther. 8, 1187–1199 [DOI] [PubMed] [Google Scholar]