

Abstract
Human fatty acid synthase (FASN) is a homo-dimeric protein with multi-enzymatic activity responsible for the synthesis of palmitate. FASN expression has been found to be up-regulated in multiple types of human cancers and its expression correlates with poor prognosis possibly by causing treatment resistance. In this study, we tested if FASN expression is up-regulated in human pancreatic cancers and if its higher expression level in pancreatic cancers causes intrinsic resistance to gemcitabine and radiation. We found that FASN expression is significantly up-regulated in human pancreatic cancer tissues without any correlation to age, sex, race, and tumor stage. Knocking down or over-expressing FASN significantly down- or up-regulate resistance of pancreatic cancer cell lines to both gemcitabine and radiation treatments. These findings imply that the elevated FASN expression in pancreatic cancers may contribute to unsuccessful treatments of pancreatic cancers by causing intrinsic resistance to both chemotherapy and radiation therapy.
Keywords: Human fatty acid synthase (FASN), palmitate, gemcitabine, radiation treatments, treatment resistance, pancreatic cancers
Introduction
Pancreatic cancer is the fourth leading cause of death in the US. Unlike some other chemo- and radiation sensitive cancers such as testicular cancer which can now be curable, the average 5 -year survival of pancreatic cancer patients is dismal at less than 5%. One of the major obstacles in pancreatic cancer treatment is its lack of response to both chemo- and radiation therapy. Recently, fatty acid synthase (FASN) over-expression has been found to correlate with poor prognosis of pancreatic cancers [1, 2], suggesting that FASN over-expression may contribute to treatment resistance and inherently poor prognosis of pancreatic cancers.
Human FASN, a key enzyme in the synthesis of palmitate and lipogenesis, is a homo-dimer of a multifunctional protein of ~270 kDa (for a review see [3]). Its over-expression was found to correlate with poor prognosis of human breast cancers in 1994 [4]. Subsequently, FASN over-expression has been found to associate with poor prognosis, higher risk of recurrence, and shorter survival of human cancers of prostate [5], ovary [6], lung [7], tongue [8], pancreas [1, 2], soft tissue [9], head and neck [10], endometrium [11], colon [12], kidney [13], and of melanoma [14] and nephroblastoma [15].
FASN over-expression has been shown to cause resistance of breast cancer cells to DNA-damaging anticancer drugs Adriamycin and mitoxantrone, possibly by increasing resistance to apoptosis induced by these drugs [16]. However, whether FASN over-expression contributes to treatment resistance in pancreatic cancers is unknown. In this study, we addressed this issue and tested the possible role of FASN in resistance to gemcitabine and radiation in pancreatic cancers. We found that FASN expression is indeed up-regulated in human pancreatic cancer tissues and its over-expression in pancreatic cancer cells significantly contributes to both gemcitabine and radiation resistance. These findings imply that the elevated FASN expression in pancreatic cancers may contribute to unsuccessful treatments of pancreatic cancers by causing intrinsic resistance to treatments.
Materials and methods
Human tissues
All studies involving human subjects have been conducted in strict compliance with the Institutional Review Board (IRB) of Indiana University School of Medicine and its affiliated hospitals. All patients in this study signed a written informed consent for collection of pancreatic tumor tissues at the time of routine operation per the Indiana University Pancreas Lesion Tissue Fluid Bank (IUPLTFB) or IU/Lilly Tissue Bank protocol. Research tissue samples were aliquotted and frozen immediately in liquid nitrogen after procurement and stored at -80oC, or fixed in 10% formalin and embedded in paraffin. The clinical diagnostic specimen was fixed in 10% neutral buffered formalin, dehydrated, and embedded in paraffin resin. Pathology material from each patient was retrieved from the archives of the Department of Pathology and Laboratory Medicine and the histopathology was reviewed. Pancreatic cancers were classified and staged according to the current guidelines of the American Joint Committee on Cancer (reference for this is Edge, SB, Byrd, DR, et al. ed. AJCC Cancer Staging Manual, 7th edition, 2010).
Tissue microarray construction and immunohis-tochemistry
2.0 mm diameter punch biopsies were obtained from “donor” paraffin blocks containing areas of pancreatic carcinoma, and transferred to “recipient” paraffin blocks using a semi-automated tissue microarrayer according to manufacturer's instructions (TMArrayer, Pathology Devices, Inc., Westminster, MD). 2 tissue microarray blocks were constructed that consisted of tumor samples from 52 patients. Normal non-neoplastic exocrine and endocrine pancreatic tissue served as a control for each block. The patient demographics are shown in Table 1. Immunohistochemistry was performed to detect FASN expression in these tissues as previously described [17]. Briefly, immunostaining was performed using a kit from Vector laboratories using a specific antibody to FASN (BD Biosciences, 1:100 dilution). Positive staining was in brown with hematoxylin used for counter staining as blue in nucleus.
Table 1.
Correlation between demogreiphics of pancreatic tissues and FASN expression in TMA study
| Patient Demographics | Cases (n) | FASN Expression (±SD) | ||
|---|---|---|---|---|
| Mean Score 1 | Mean Score 2 | |||
| Age (years) | ||||
| Range | 42-85 | |||
| Mean±SD | 62.1±10.7 | |||
| Race | ||||
| White | 48 | 182.3±81.8 | 36.4±21.5 | |
| Black | 4 | 197.5±106.1 | 39.0±15.7 | |
| Sex | ||||
| Male | 27 | 163.7±103.9 | 32.6±25.5 | |
| Female | 25 | 204.8±66.0 | 41.0±17.9 | |
| Stage | ||||
| I | 2 | 190.0±0.0 | 41.4±9.4 | |
| IIA | 2 | 215±77.8 | 43.1±45.3 | |
| IIB | 47 | 181.9±90.7 | 36.1±21.9 | |
| III | 1 | 180 | 36.3 | |
| Total | 52 | 183.5±87.1 | 36.6±21.9 | |
Immunohistochemical staining analysis
The immunohistochemical expression of FASN in the TMA was examined independently by two experienced pathologists (Jey-Hsin Chen and Liang Cheng). The percentage of neoplastic cells staining for FASN in the neoplastic cells were scored semi-quantitatively by visual evaluation on a 5% incremental scale ranging from 0 to 100%. A numeric intensity score was set from 0 to 3 (0, no staining; 1, weak staining; 2, moderate staining; and 3, strong staining). The final staining score is the product of the intensity score multiplied by percentage of stained cells. We also evaluated the FASN staining intensity using an automated image analyzer (Automated Cellular Imaging System (ACIS) III, Dako, Carpinteria, CA). The mean staining intensity of each tumor was determined by selectively sampling 10 areas that contained solely of neoplastic cells. The final staining score of each neoplasm was determined by subtracting the mean staining intensity of FASN in the ductal epithelium of normal (control) pancreatic tissue.
Cell lines and stable FASN-over-expressing clones
Human pancreatic cancer cell lines Panc-1, Mia-PaCa-2, and BxPc-3 (all from ATCC) were maintained in DMEM (BioWhittaker), DMEM with 2.5% donor equine serum, and RPMI1640 (Cellgro), respectively, but all supplemented with 10% fetal bovine serum (Invitrogen) and 1% penicillin/streptomycin mixture (BioWhittaker).
Transient FASN knockdown in Panc-1 cells was performed using FASN siRNA as previously described [16]. Briefly, Panc-1 cells were transiently transfected with 100 nM scrambled control or FASN siRNAs (Dharmacon). Twenty-four hours later, the cells were seeded in 96-well plate and cultured for 24 hrs before treatment with gemcitabine and survival assay.
The cDNA of FASN was engineered into pcDNA3.1(+) (Invitrogen). Transfection of this plasmid and its vector control into Panc-1 cells were performed using Lipofectamine (Invitrogen) and stable clones were selected using 800 μg/ml G418 (Invitrogen) as previously described [16]. Two stable clones for FASN over- expression (FASN3 and FASN7) and one vectortransfected control clone were selected for expansion and further analysis.
Sample preparation and Western blot analysis
Sample preparation and Western blot analysis were performed as previously described [18–20]. Briefly, the frozen tissues were thawed and homogenized in TNN-SDS buffer (50 mM Tris-HCl, pH 7.5, 150 mM NaCl, 0.5% Nonidet P-40, 50 mM NaF, 1 mM sodium orthovanadate, 1 mM dithiothreitol, 0.1% SDS, and 2 mM phenyl-methylsulfonyl fluoride) by using pellet pestle (Fisher scientific) and the lysates were clarified by centrifugation (12,000g for 30 min at 4oC).
The tissue or cell lysates were separated by SDS -PAGE and transferred to a PVDF membrane followed by a 2-hr incubation in blocking solution (Tris- or PBS-buffered saline containing 5% nonfat dried milk and 0.1% Tween 20) and a 2-hr incubation with monoclonal antibody against FASN (BD Biosciences, 1:300 dilution). The reaction was detected by horseradish peroxidaseconjugated anti-mouse IgG antibody and visualized using ECL with exposure to an x-ray film.
Survival assay
Survival assay was performed as previously described using MTT colorimetric assay [19]. Briefly, cell lines were seeded in 96-well plate at ~4000 cells/well and cultured for 24 hrs followed by treatment with anticancer drug gemcitabine or γ-irradiation and cultured continuously for 3 days followed by addition of MTT (5 mg/ mL) to a final concentration of 0.5 mg/mL and incubation of the plates at 37°C for 2 hours. Equal volume of solubilization solution (10% SDS in 0.01 M HCl) was then added and the plates were incubated at 37°C overnight. The OD570nm was measured using an automated plate reader and analyzed using GraphPad Prism software to generate fitted curve and IC50. Relative resistance factor (RRF) is calculated using the following formula: RRF=IC50 (test)/IC50 (control).
Results
FASN expression in human pancreatic cancers
Previously, it has been reported that FASN expression and serum FASN level is increased in pancreatic cancer patients and serum FASN could be used as a diagnosis marker [21]. To further investigate the expression pattern of FASN in pancreatic cancers, we constructed a tissue array with 52 human pancreatic cancer tissue cores and one normal control with non-neoplastic pancreas duct tissue and performed immunohistochemistry staining using FASN antibody. As shown in Figure 1, the control normal tissue had no staining whereas the cancer tissue had strong cytoplasmic staining in ductal adenocarcinoma cells. The TMA was first analyzed and FASN staining was scored by a pathologist followed by analysis independently by another pathologist using imager analyzer as described in Materials and Methods. The two different sets of scores were compared and found having a linear correlation (Figure 1C), suggesting that the scores from both scoring systems are appropriate and validate each other. Table 1 shows the summary of FASN staining results and correlation with demographics of the pancreatic tissues. FASN expression does not appear to correlate significantly with race, sex, age, or stage of the disease. However, about 41 cases (78.8%) have >50% FASN positive cells with staining intensity at 2 or above (Table 2). Thus, we conclude that FASN expression is high in pancreatic cancer tissues.
Figure 1.

FASN expression in pancreatic ductal adenocarcinoma. Examples of pancreatic normal (A) and cancer (B) tissues on TMA slides were stained by FASN antibody followed by visualization under microscope (20X and 200X magnification were used for the entire core and inset, respectively). Panel C shows the correlation of FASN expression level determined using two different scoring systems. Score 1=semi quantitative scores; Score 2=quantitative imager analysis.
Table 2.
Distribution of FASN positive cells in TMA study
| % FASN+ cells | FASN Intensity Cases (%) | |||||
|---|---|---|---|---|---|---|
| 0 | 1 | 2 | 3 | Total | ||
| 0-25 | 4(7.7) | 1 (1.9) | 0 | 0 | 5 | |
| 26-50 | 0 | 0 | 3 (5.8) | 1(1.9) | 4 | |
| 51-75 | 0 | 0 | 5 (9.6) | 6 (11.5) | 11 | |
| 76-100 | 0 | 2 (3.8) | 11(21.2) | 19 (36.5) | 32 | |
| Total | 4 | 3 | 19 | 26 | 52 | |
To further investigate individual differences in FANS up-regulation in pancreatic cancers, we collected 22 pairs of additional matched fresh-frozen normal and cancer pancreatic tissues and determined the protein level of FASN in these samples using Western blot. The relative intensity of FASN protein band was then measured and analyzed. As shown in Figure 2, 14 of the 22 cases (63.6%) had increased FASN expression in cancers compared to their matching normal pancreatic tissues. This increase is statistically significant (Figure 2B). On the other hand, only 8 of the 22 cases (36.4%) had reduced FASN level. Thus, FASN protein level significantly increases in pancreatic cancer compared to their corresponding normal tissues.
Figure 2.

Comparison of FASN expression between matched normal and cancer pancreatic tissues. A. FASN expression in pancreatic tissues. Lysates from fresh frozen matching human normal (N) and pancreatic ductal adenocarcinoma (C) tissues were separated by SDS-PAGE followed by Western blot analysis of FASN and actin loading control. B. Quantitation of relative FASN level. The relative FASN level in each sample was measured and normalized to that of actin with the level of FASN in each normal tissue set to 1. The relative levels of FASN in normal and cancer tissues were graphed with the median level in each group marked by (-). Each tissue was marked by the identification number. Statistical analysis was done using Student T-test.
Correlation between FASN expression and gemcitabine response
Previously, FASN over-expression has been shown to correlate with poor prognosis of pancreatic cancer patients [1, 2]. To determine if FASN over-expression possibly contributes to gemcitabine resistance, we first performed a correlation analysis between FASN expression and gemcitabine response using human pancreatic cancer cell lines, Panc-1, MiaPaCa-2, and BxPc-3. As shown in Figure 3A, FASN expression level in Panc-1 and MiaPaCa-2 cells are similar but both are higher than that in BxPc-3 cells as determined using Western blot. Interestingly, both Panc-1 and MiaPaCa-2 cells are also significantly more resistant to gemcitabine treatment than BxPc-3 cells with higher IC50 (Figure 3B).
Figure 3.

Correlation between FASN expression and gemcitabine resistance. A. FASN expression level in Panc-1, MiaPaCa-2, and BxPc-3 cells. Lysates from Panc-1, MiaPaCa-2, and BxPc-3 cells were prepared for Western blot analyses of FASN and actin loading control. B. IC50 of gemcitabine. The effect of anticancer drug gemcitabine on the survival of Panc-1, Mia-PaCa-2, and BxPc-3 cells was determined using MTT assay and IC50 was determined using Prism program. C. 14-3-3σ expression level in Panc-1 and MiaPaCa-2 cells. Lysates from Panc-1 and MiaPaCa-2 cells were prepared for Western blot analyses of 14-3-3σ and GAPDH loading control.
It is noteworthy that Panc-1 is more resistant than MiaPaCa-2 cells although they have similar level of FASN expression, suggesting that other factors may contribute to chemoresistance. Previously, we have shown that over-expression of 14-3-3σ protein in pancreatic cancer cells also contributes to gemcitabine resistance by reducing drug-induced apoptosis [18]. To test if 14-3-3σ may be up-regulated in Panc-1 cells com-pared to MiaPaCa-2 cells and, thus, contributes to the higher resistance of Panc-1 cells, we performed a Western blot analysis of 14-3-3σ in these cell lines. As shown in Figure 2C, 14-3-3σ is indeed up-regulated in Panc-1 cells whereas its expression in MiaPaCa-2 cells is completely suppressed. Thus, the 14-3-3σ expression likely contributes to the differences in gemcitabine response between Panc-1 and MiaPaCa-2 cells. Taken together, we conclude that the expression level of FASN, along with 14-3-3σ, correlates with gemcitabine resistance level of pancreatic cancer cells.
Effect of FASN knockdown or inhibition on gemcitabine response
To determine if the high FASN level in Panc-1 cells possibly contributes to its gemcitabine resistance, we transiently knocked down FASN expression using siRNA followed by determining the effect of FASN knockdown on gemcitabine response. As shown in Figure 4A, FASN expression is successfully suppressed by siRNA. Compared with control cells transfected with scrambled siRNA, Panc-1 cells with FASN knockdown have reduced gemcitabine resistance (Figure 4B) with a decrease in RRF (relative resistance factor) by 50% (Figure 4C).
Figure 4.

Effect of FASN knockdown on gemcitabine response. A. Western blot analysis of FASN following siRNA transfection. Panc-1 cells were transiently transfected with FASN or scrambled control siRNA followed by Western blot analysis of FASN. B. MTT assay. Panc-1 cells transiently transfected with FASN (Si) or scrambled control (Scr) siRNAs were treated with various concentrations of gemcitabine followed by analysis using MTT assy. C. Relative resistance factor. Relative resistance factor (RRF) was derived as described in Materials and Methods. ** p<0.01.
Next, we examined whether inhibiting FASN using its inhibitor orlistat also reduces gemcitabine resistance of Panc-1 cells. For this purpose, the cytotoxicity and IC50 of orlistat in Panc-1 cells were first determined using MTT assay. As shown in Figure 5A, orlistat has no cytotoxicity to Panc-1 cells up to 40 μM with an IC50 of ~150 μM. Consequently, we used 25 μM orlistat to determine if it would sensitize Panc-1 cells to gemcitabine in a MTT assay. As shown in Figure 5B, orlistat sensitizes Panc-1 cells to gemcitabine treatment with a reduction of RRF by ~40% (Figure 5C). Thus, inhibiting FASN expression using siRNA or its function using an inhibitor reduces gemcitabine resistance of pancreatic cancer cells.
Figure 5.

Effect of orlistat on gemcitabine response. A. Cytotoxicity of orlistat. Panc-1 cells were treated with different concentrations of orlistat followed by MTT assay. B. Sensitization of gemcitabine resistance by orlistate. Panc-1 cells were treated with different concentrations of gemcitaibne in the absence or presence of 25 μM orlistate followed by MTT assay. C. Relative resistance factor. Relative resistance factor (RRF) to gemcitabine was derived as described in Materials and Methods. ** p<0.01.
Effect of FASN over-expression on gemcitabine and radiation response
To further determine the role of FASN in gemcitabine resistance, we next determined if overexpressing ectopic FASN would increase gemcitabine resistance. For this purpose, stable cell lines with ectopic FASN over-expression (FASN3 and FASN7) were established from Panc-1 cells (Figure 6A). These cells were then tested for their response to gemcitabine compared with vector-transfected control cells. As shown in Figure 6B, both FASN3 and FASN7 stable clones are more resistant than the vectortransfected cells. The RRF of FASN3 and FASN7 stable clones are increased about 2-3 fold compared with the vector transfected cells with a correlation to their FASN level (Figure 6C).
Figure 6.
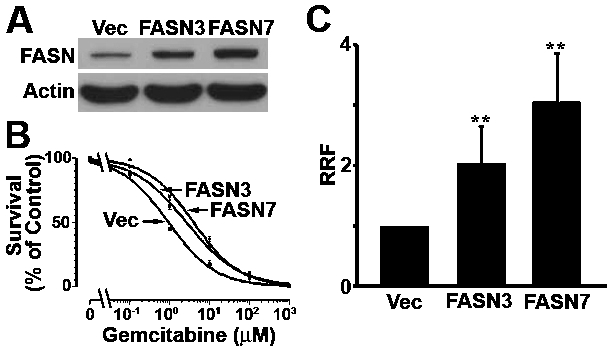
Effect of FASN over-expression on gemcitabine response. A. FASN expression level. Lysates were prepared from Panc-1 cells with stable trans-fection with FASN cDNA (FASN3 and FASN7) or vector (Vec) control and used for Western blot analysis of FASN and actin loading control. B. Survival assay. Panc-1 stable clones were treated with various concentrations of gemcitabine followed by analysis using MTT assy. C. Relative resistance factor. Relative resistance factor (RRF) to gemcitabine was derived as described in Materials and Methods. ** p<0.01.
To determine if FASN over-expression also possibly contributes to resistance of pancreatic cancer cells to radiation, FASN3 and FASN7 stable clones along with the vector-transfected control cells were treated by γ-irradiation followed by survival analysis. As shown in Figure 7A, both FASN3 and FASN7 stable clones are more resistant than the vector-transfected cells to γ-irradiation. The RRF of both FASN3 and FASN7 stable clones to γ-irradiation is ~2 fold more than that of the vector-transfected control cells (Figure 7B). Taken together, we conclude that FASN over-expression in Panc-1 cells likely contributes to gemcitabine and radiation resistance.
Figure 7.

Effect of FASN over-expression on radiation response. A. Survival assay. Panc-1 cells with stable transfection with FASN cDNA (FASN3 and FASN7) or vector (Vec) control were treated with different doses of γ-irradiation followed by analysis using MTT assy. B. Relative resistance factor. Relative resistance factor (RRF) to γ-irradiation was derived as described in Materials and Methods. ** p<0.01.
Discussion
In this study, we show that FASN expression is up-regulated in pancreatic cancers and the upregulated FASN level may contribute to treatment resistance of this dreadful disease. While over-expressing ectopic FASN increased gemcitabine and radiation resistance of pancreatic cancer cell lines, knocking down FASN level reduced the treatment resistance. These results provide a molecular basis for previous findings that FASN expression correlates with poor prognosis of pancreatic cancer patients [1, 2] and indicate that FASN may be more than just a correlative prognostic factor and its expression predicts treatment failure as well.
Pancreatic cancers are known aggressive diseases with less than 5% 5-year survival. The underlying mechanism for the aggressive behavior of this disease is, however, unknown. While molecular signatures of pancreatic cancers have been defined [22], key factors defining the poor prognosis phenotype have yet to be identified. Along these lines of research, FASN has been consistently observed to over-express in pancreatic cancers [1, 2, 21] and the FASN over-expression correlates with poor prognosis [1, 2]. These findings, together with that of other cancers such as breast [4] and prostate [5] cancers consistently suggest that FASN may be an important prognosis factor in many types of human cancers.
In a well nourished individual, normal cells preferentially use circulating dietary free fatty acids for energy and various other purposes. Thus, de novo fatty acid synthesis is not needed and consequently the FASN expression level is low. Cancer cells, however, appear to require alternative sources for energy and synthesize >90% of their triacylglycerides de novo by up-regulating their FASN expression [3]. Previously, it has been shown that FASN is a survival factor for human cancer cells and knocking down its expression or inhibiting its function causes significant growth arrest and apoptosis [23–26]. These findings suggest that FASN may be used as a target for therapeutic development. However, drug resistant cancer cells with further up-regulated FASN level appear to be able to survive FASN knockdown [16]. In this study, we observed no significant growth arrest with Panc-1 cells following FASN knockdown possibly due to its very high level of FASN expression. Considering that FASN expression is up-regulated in majority of human pancreatic cancers, targeting FASN alone, thus, may not provide an effective way to eliminate pancreatic cancers.
FASN over-expression also appears to provide cancer cell survival advantage under the stress of chemo- and radiation treatments. The findings that pancreatic cancer cells with higher levels of FASN are more resistant to gemcitabine than those with lower levels and that over -expressing FASN further increased gemcitabine and radiation resistance suggest that the high level of FASN in pancreatic cancers may contribute to intrinsic gemcitabine and radiation resistance, explaining the dismal prognosis of this cancer with existing treatment options. Previously, elevated FASN expression has been found in Adriamycin-selected breast cancer cell lines and contributes to drug resistance in these cells [16]. Thus, FASN expression may also be up-regulated following chemotherapy and possibly contributes to acquired resistance to chemoand radiation therapy. It is, thus, tempting to speculate that FASN may be used as a therapeutic target in combination therapies to sensitize pancreatic cancers to current treatments such as gemcitabine.
The molecular mechanism by which FASN con-fers treatment resistance of pancreatic cancers is not yet known. However, it has been shown previously that FASN over-expression protects breast cancer cells from drug-induced apoptosis [16]. Recently, it was found that FASN over-expression suppresses drug-induced production of ceramide and, thus, reduced apoptosis via caspase 8 activation induced by Adriamycin (unpublished observations). Since γ-irradiation also causes double strand DNA breaks, similar to that induced by Adriamycin, it is tempting to speculate that FASN-induced resistance to radiation of pancreatic cancers may be via a similar mechanism. However, whether this mechanism is used in FASN-induced gemcitabine resistance remains to be determined.
It is also noteworthy that pancreatic cancers are heterogeneous diseases and many factors may contribute to the observed resistance. Previously, we have shown that 14-3-3σ expression is up-regulated in human pancreatic cancer tissues and its over-expression contributes to gemcitabine and radiation resistance [18]. In this study, we found that Panc-1 cell over-expresses both 14-3-3σ and FASN and it is the most resistant cells among those tested. Future studies in identifying the major factors that contribute to intrinsic and acquired gemcitabine and radiation resistance will likely generate better treatment efficacy and benefit pancreatic cancer patients.
References
- [1].Alo PL, Amini M, Piro F, Pizzuti L, Sebastiani V, Botti C, Murari R, Zotti G, Di Tondo U. Immu-nohistochemical expression and prognostic significance of fatty acid synthase in pancreatic carcinoma. Anticancer Res. 2007;27:2523–2527. [PubMed] [Google Scholar]
- [2].Witkiewicz AK, Nguyen KH, Dasgupta A, Kennedy EP, Yeo CJ, Lisanti MP, Brody JR. Co-expression of fatty acid synthase and caveolin-1 in pancreatic ductal adenocarcinoma: implications for tumor progression and clinical outcome. Cell Cycle. 2008;7:3021–3025. doi: 10.4161/cc.7.19.6719. [DOI] [PubMed] [Google Scholar]
- [3].Liu H, Liu JY, Wu X, Zhang JT. Biochemistry, molecular biology, and pharmacology of fatty acid synthase, an emerging therapeutic target and diagnosis/prognosis marker. Int J Biochem Mol Biol. 2010;1:69–89. [PMC free article] [PubMed] [Google Scholar]
- [4].Kuhajda FP, Jenner K, Wood FD, Hennigar RA, Jacobs LB, Dick JD, Pasternack GR. Fatty acid synthesis: a potential selective target for antineoplastic therapy. Proc Natl Acad Sci U S A. 1994;91:6379–6383. doi: 10.1073/pnas.91.14.6379. [DOI] [PMC free article] [PubMed] [Google Scholar]
- [5].Shurbaji MS, Kalbfleisch JH, Thurmond TS. Immunohistochemical detection of a fatty acid synthase (OA-519) as a predictor of progression of prostate cancer. Hum Pathol. 1996;27:917–921. doi: 10.1016/s0046-8177(96)90218-x. [DOI] [PubMed] [Google Scholar]
- [6].Gansler TS, Hardman W, 3rd, Hunt DA, Schaffel S, Hennigar RA. Increased expression of fatty acid synthase (OA-519) in ovarian neoplasms predicts shorter survival. Hum Pathol. 1997;28:686–692. doi: 10.1016/s0046-8177(97)90177-5. [DOI] [PubMed] [Google Scholar]
- [7].Piyathilake CJ, Frost AR, Manne U, Bell WC, Weiss H, Heimburger DC, Grizzle WE. The expression of fatty acid synthase (FASE) is an early event in the development and progression of squamous cell carcinoma of the lung. Hum Pathol. 2000;31:1068–1073. doi: 10.1053/hupa.2000.9842. [DOI] [PubMed] [Google Scholar]
- [8].Silva SD, Cunha IW, Rangel AL, Jorge J, Zecchin KG, Agostini M, Kowalski LP, Coletta RD, Graner E. Differential expression of fatty acid synthase (FAS) and ErbB2 in nonmalignant and malignant oral keratinocytes. Virchows Arch. 2008;453:57–67. doi: 10.1007/s00428-008-0626-5. [DOI] [PubMed] [Google Scholar]
- [9].Takahiro T, Shinichi K, Toshimitsu S. Expression of fatty acid synthase as a prognostic indicator in soft tissue sarcomas. Clin Cancer Res. 2003;9:2204–2212. [PubMed] [Google Scholar]
- [10].Silva SD, Agostini M, Nishimoto IN, Coletta RD, Alves FA, Lopes MA, Kowalski LP, Graner E. Expression of fatty acid synthase, ErbB2 and Ki-67 in head and neck squamous cell carcinoma. A clinicopathological study. Oral Oncol. 2004;40:688–696. doi: 10.1016/j.oraloncology.2004.01.004. [DOI] [PubMed] [Google Scholar]
- [11].Sebastiani V, Visca P, Botti C, Santeusanio G, Galati GM, Piccini V, Capezzone de Joannon B, Di Tondo U, Alo PL. Fatty acid synthase is a marker of increased risk of recurrence in endo-metrial carcinoma. Gynecol Oncol. 2004;92:101–105. doi: 10.1016/j.ygyno.2003.10.027. [DOI] [PubMed] [Google Scholar]
- [12].Ogino S, Nosho K, Meyerhardt JA, Kirkner GJ, Chan AT, Kawasaki T, Giovannucci EL, Loda M, Fuchs CS. Cohort study of fatty acid synthase expression and patient survival in colon cancer. J Clin Oncol. 2008;26:5713–5720. doi: 10.1200/JCO.2008.18.2675. [DOI] [PMC free article] [PubMed] [Google Scholar]
- [13].Horiguchi A, Asano T, Asano T, Ito K, Sumitomo M, Hayakawa M. Pharmacological inhibitor of fatty acid synthase suppresses growth and invasiveness of renal cancer cells. J Urol. 2008;180:729–736. doi: 10.1016/j.juro.2008.03.186. [DOI] [PubMed] [Google Scholar]
- [14].Innocenzi D, Alo PL, Balzani A, Sebastiani V, Silipo V, La Torre G, Ricciardi G, Bosman C, Calvieri S. Fatty acid synthase expression in melanoma. J Cutan Pathol. 2003;30:23–28. doi: 10.1034/j.1600-0560.2003.300104.x. [DOI] [PubMed] [Google Scholar]
- [15].Camassei FD, Jenkner A, Rava L, Bosman C, Francalanci P, Donfrancesco A, Alo PL, Boldrini R. Expression of the lipogenic enzyme fatty acid synthase (FAS) as a predictor of poor outcome in nephroblastoma: an interinstitutional study. Med Pediatr Oncol. 2003;40:302–308. doi: 10.1002/mpo.10274. [DOI] [PubMed] [Google Scholar]
- [16].Liu H, Liu Y, Zhang JT. A new mechanism of drug resistance in breast cancer cells: fatty acid synthase overexpression-mediated palmitate overproduction. Mol Cancer Ther. 2008;7:263–270. doi: 10.1158/1535-7163.MCT-07-0445. [DOI] [PubMed] [Google Scholar]
- [17].Yang L, He J, Huang S, Zhang X, Bian Y, He N, Zhang H, Xie J. Activation of hedgehog signaling is not a frequent event in ovarian cancers. Mol Cancer. 2009;8:112. doi: 10.1186/1476-4598-8-112. [DOI] [PMC free article] [PubMed] [Google Scholar]
- [18].Li Z, Dong Z, Myer D, Yip-Schneider M, Liu J, Cui P, Schmidt CM, Zhang JT. Role of 14-3-3sigma in poor prognosis and in radiation and drug resistance of human pancreatic cancers. BMC Cancer. 2010;10:598. doi: 10.1186/1471-2407-10-598. [DOI] [PMC free article] [PubMed] [Google Scholar]
- [19].Yang Y, Chen Q, Zhang JT. Structural and functional consequences of mutating cysteine residues in the amino terminus of human multidrug resistance-associated protein 1. J Biol Chem. 2002;277:44268–44277. doi: 10.1074/jbc.M207003200. [DOI] [PubMed] [Google Scholar]
- [20].Yang Y, Liu Y, Dong Z, Xu J, Peng H, Liu Z, Zhang JT. Regulation of function by dimerization through the amino-terminal membrane-spanning domain of human ABCC1/MRP1. J Biol Chem. 2007;282:8821–8830. doi: 10.1074/jbc.M700152200. [DOI] [PubMed] [Google Scholar]
- [21].Walter K, Hong SM, Nyhan S, Canto M, Fedarko N, Klein A, Griffith M, Omura N, Medghalchi S, Kuhajda F, Goggins M. Serum fatty acid synthase as a marker of pancreatic neoplasia. Cancer Epidemiol Biomarkers Prev. 2009;18:2380–2385. doi: 10.1158/1055-9965.EPI-09-0144. [DOI] [PMC free article] [PubMed] [Google Scholar]
- [22].Jones S, Zhang X, Parsons DW, Lin JC, Leary RJ, Angenendt P, Mankoo P, Carter H, Kamiyama H, Jimeno A, Hong SM, Fu B, Lin MT, Calhoun ES, Kamiyama M, Walter K, Nikolskaya T, Nikol-sky Y, Hartigan J, Smith DR, Hidalgo M, Leach SD, Klein AP, Jaffee EM, Goggins M, Maitra A, Iacobuzio-Donahue C, Eshleman JR, Kern SE, Hruban RH, Karchin R, Papadopoulos N, Par-migiani G, Vogelstein B, Velculescu VE, Kinzler KW. Core signaling pathways in human pancreatic cancers revealed by global genomic analyses. Science. 2008;321:1801–1806. doi: 10.1126/science.1164368. [DOI] [PMC free article] [PubMed] [Google Scholar]
- [23].Gao Y, Lin LP, Zhu CH, Chen Y, Hou YT, Ding J. Growth arrest induced by C75, A fatty acid synthase inhibitor, was partially modulated by p38 MAPK but not by p53 in human hepatocellular carcinoma. Cancer Biol Ther. 2006;5:978–985. doi: 10.4161/cbt.5.8.2883. [DOI] [PubMed] [Google Scholar]
- [24].Knowles LM, Axelrod F, Browne CD, Smith JW. A fatty acid synthase blockade induces tumor cell-cycle arrest by down-regulating Skp2. J Biol Chem. 2004;279:30540–30545. doi: 10.1074/jbc.M405061200. [DOI] [PubMed] [Google Scholar]
- [25].Li JN, Gorospe M, Chrest FJ, Kumaravel TS, Evans MK, Han WF, Pizer ES. Pharmacological inhibition of fatty acid synthase activity produces both cytostatic and cytotoxic effects modulated by p53. Cancer Res. 2001;61:1493–1499. [PubMed] [Google Scholar]
- [26].Morikawa K, Ikeda C, Nonaka M, Suzuki I. Growth arrest and apoptosis induced by quercetin is not linked to adipogenic conversion of human preadipocytes. Metabolism. 2007;56:1656–1665. doi: 10.1016/j.metabol.2007.07.008. [DOI] [PubMed] [Google Scholar]