Abstract
Computational fluid dynamics (CFD) predictions of inertial particle deposition have not compared well with data from nasal replicas due to effects of surface texture and the resolution of tomographic images. To study effects of geometric differences between CFD models and nasal replicas, nasal CFD models with different levels of surface smoothness were reconstructed from the same MRI data used to construct the nasal replica used by Kelly et al. (2004) [Aerosol Sci. Technol. 38:1063–1071]. One CFD model in particular was reconstructed without any surface smoothing to preserve the detailed topology present in the nasal replica. Steady-state inspiratory airflow and Lagrangian particle tracking were simulated using Fluent software. Particle deposition estimates from the smoother models under-predicted nasal deposition from replica casts, which was consistent with previous findings. These discrepancies were overcome by including surface artifacts that were not present in the reduced models and by plotting deposition efficiency versus the Stokes number, where the characteristic diameter was defined in terms of the pressure-flow relationship to account for changes in airflow resistance due to wall roughness. These results indicate that even slight geometric differences have significant effects on nasal deposition and that this information should be taken into account when comparing particle deposition data from CFD models with experimental data from nasal replica casts.
Keywords: nasal airway, particle deposition, wall roughness, nasal deposition, computational fluid dynamics
INTRODUCTION
The human nasal passages are comprised of narrow, sinuous airways that direct air currents along a large vascularized surface area. This shape is designed to warm and humidify inhaled air and filter vapors and particulates from the airstream. While this helps protect the sensitive alveolar airways from inhaled materials, it leaves the nasal epithelium susceptible to injury from repeated exposure to toxic materials. This filtering mechanism can also be exploited by engineering spray devices that maximize deposition of aerosolized medications at target sites within the nasal cavity (O’Hagan and Rappouli, 2001; Cheng et al., 2001; Kimbell et al., 2007; Foo et al., 2007; Inthavong et al., 2008). It is therefore important to accurately quantify the amount of inhaled particles depositing in the nose, not only to determine what reaches the lung, but also to measure the dose to the nasal airways for risk assessment and therapeutic purposes.
Many experimental studies have been conducted to quantify particle deposition in the nose using human volunteers (Pattle, 1961, Hounam et al., 1971, Heyder and Rudolf, 1977) and nasal replica casts (Kelly et al., 2004a, 2004b, Guilmette et al., 1994, Swift, 1991, Garcia et al., 2009, Hausserman et al., 2002, Zwartz and Guilmette, 2001, Liu et al., 2010). While there is some degree of variability amongst studies due to experimental technique and nasal anatomy, they all share the consistent finding that total nasal deposition efficiency for particles in the inertial regime (> 1 μm) increases with particle size from near 0% for 1 μm particles to 100% for particles larger than ~10 μm. These experimental techniques have proven successful at measuring total nasal deposition, but both in vivo and in vitro methods have limitations. Human volunteer studies offer the most physiologically realistic scenario but are limited by the number of flow rates and particle sizes that can be considered and are subject to variability. In contrast, nasal replica casts offer the opportunity to restrict measurements to the nose and are conducive to using a wide range of flow rates and particle sizes, but the manufacturing process will always have some level of surface finish that can affect airflow and deposition behavior of micron-sized particles.
Kelly et al. (2004b) compared deposition results for particles in the inertial regime among nasal replica casts that were based on the same MRI scans but had different levels of surface resolution due to their manufacturing techniques. They observed different deposition efficiencies among the models that they attributed to differences in surface roughness. Higher deposition was observed in the nasal replicas developed from coarser manufacturing methods. In some cases the differences were quite dramatic. For example, at an impaction parameter of 10,000 μm2-ml/sec (particle size of ~5 μm), deposition fractions ranged from < 20% in the smoothest mold (with a surface resolution of 0.051 mm) to > 90% in the mold with the coarsest resolution (with an estimated surface resolution of 0.5 mm) (Kelly et al., 2004b). This large variability suggests that even small geometric differences can significantly impact nasal particle deposition, making it difficult to accurately extrapolate results to real exposure scenarios.
An alternative to experimental techniques to estimate nasal particle deposition is the use of computational fluid dynamics (CFD) models (e.g., Shi et al., 2007; Shanley et al., 2008; Xi and Longest, 2008; Liu et al., 2007, 2010). CFD methods require the reconstruction of a virtual nasal model, typically from MRI or CT data, development of a numerical mesh, and simulation of airflow and particle transport equations. Recent advances in medical imaging software and automated mesh generation software have improved these steps, allowing for robustness and flexibility in airflow and particle deposition simulations (Zhao et al., 2004). However, CFD results are subject to numerical error and should be validated by experimental measurements. Comparison of CFD predictions with earlier in vivo results is problematic since it is difficult to mimic the precise breathing pattern of each subject. There may also be significant inter-individual variability in nasal anatomy between the scans on which the CFD model was based and the different subject that was used in an in vivo experiment. For these reasons, CFD results are usually compared against data from nasal replica casts in which it is easier to match experimental conditions and more information is known about the internal geometry. In particular, the deposition data by Kelly et al. (2004b) has frequently been used for validation of CFD predictions (Shi et al., 2007; Inthavong et al., 2006; Wang et al., 2009) because the replica casts in the Kelly study were made with a high resolution stereolithography machine to decrease the effects of wall roughness.
There are two sources of surface irregularities that may affect particle deposition in nasal models, namely “wall roughness” and “surface smoothness”. In this paper, we use the term “wall roughness” to denote the surface resolution of the rapid prototyping machine used to manufacture the nasal replica casts, while the term “surface smoothness” is used to describe surface irregularities due to coarse imaging data (low resolution of CT or MRI scans) and poor interpolation between consecutive cross-sections in sectional anatomic data. Surface smoothness irregularities can be present in both computational and replica models. For example, the geometry of the nasal replica cast used by Kelly et al. (2004b) was based on a CFD model that had been developed from digital tracings of MRI images (Subramaniam et al., 1998). These coronal MRI scan tracings were spaced 3 mm apart and were not perfectly aligned, so the interpolation procedure for the 3D model resulted in a jagged appearance in the nasal walls. This model also contained numerous meshing artifacts that showed up as geometric perturbations in the stereolithography model. The resulting nasal surface was highly irregular with a non-smooth boundary that contained many sharp corners, ridges, and other unrealistic geometric artifacts (Figure 1).
Figure 1.
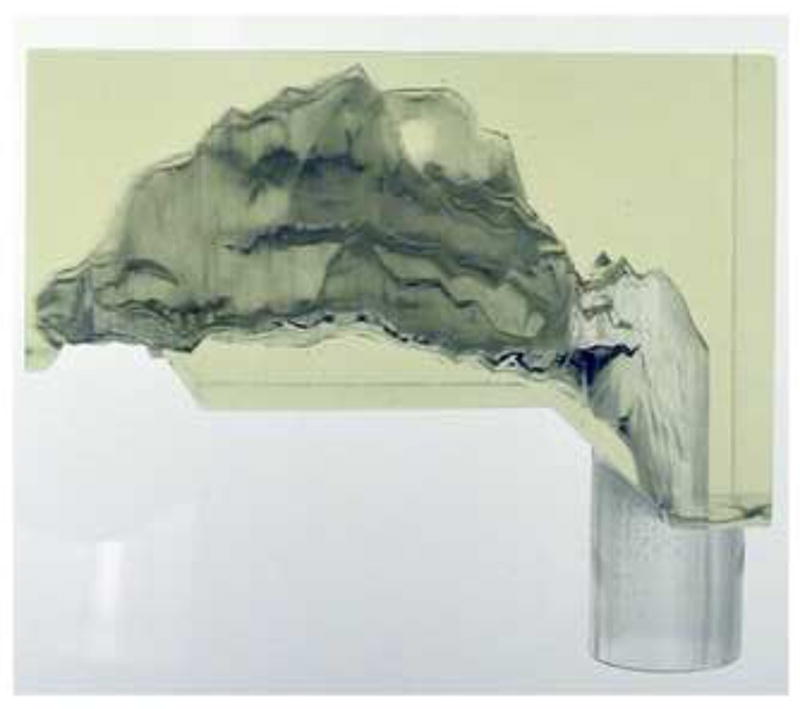
Photograph of the nasal replica used in the experimental particle deposition study of Kelly et al. (2004b).
In contrast to the wall roughness inherent to rapid prototyping techniques, modern CFD model construction and mesh generation inherently results in airway surfaces with a smooth finish. The result is that, when compared to data from nasal casts with a rougher surface finish and non-smooth surfaces, CFD results under-predict particle deposition in the inertial regime (Shi et al., 2007; Liu et al., 2007; Wang et al., 2009). However, the fact that CFD results capture the sigmoidal shape of particle deposition for particles from 1 to 10 μm suggests that differences between CFD and experimental results are due to geometric differences between CFD models and nasal replicas, and not necessarily to numerical error. When CFD models are developed from medical imaging data, the surface contours are typically smoothed by the user to create a more aesthetic, physiologically realistic model. The resulting smoothed CFD models do not perfectly reproduce the geometry from nasal replica casts upon which a supposed “validation” of particle deposition results is based.
In this study, a nasal CFD model was constructed to closely mimic the nasal replica cast used in Kelly et al. (2004b) by retaining all surface artifacts without any surface smoothing. This model was subsequently smoothed using medical imaging software to see how different levels of surface smoothness affect particle deposition. We show that discrepancies between CFD predictions and in vitro measurements of nasal deposition are primarily due to effects of surface smoothness, and that wall roughness effects can be accounted for by comparing results in the exact same geometry using a recently derived form of the Stokes number to account for differences in airflow resistance and pressure.
METHODS
Nasal Airway Models
A nasal CFD model was previously constructed from MRI scans of a healthy adult male (Subramaniam et al., 1998). The scans consisted of 36 coronal cross-sections spaced 3 mm apart from the tip of the nostrils to the back of the nasopharynx. Different versions of this model based on the same MRI dataset have been used by multiple investigators for in vitro (Guilmette et al., 1994; Swift, 1991; Kelly et al., 2004a, 2004b; Garcia et al., 2009) and in silico (Subramaniam et al., 1998; Schroeter et al., 2006, Shi et al., 2007, Xi and Longest, 2008) studies of nasal deposition. In this model, digital tracings of the airway outlines were used to create two-dimensional grids of each coronal slice; these grids were then linked together using in-house software (Godo et al., 1995) to produce the final structured three-dimensional numerical mesh. The resulting mesh contained 130,000 hexahedral elements. Due to the coarseness of the dataset and the limited resolution of the airway outlines, the interpolation between cross-sections produced a corrugated surface in the axial direction. In addition, implementation of a coarse structured grid on a complex geometry such as that found in the human nose resulted in numerous mesh artifacts, including distorted elements and “nubs”. These nubs were artificial mesh structures that were not part of the original geometry but were necessary at the time to generate a quality hexahedral mesh that could adapt to the ever-changing shapes of the nose. This meshing process produced a surface that, by today’s standards, contained many artificial grooves, corners, stair-steps, and mis-aligned cross-sections that were not physiologically realistic. It was this surface structure that was used to generate the nasal replica cast investigated by Kelly et al. (2004b) (Figure 1).
For this study, the surface geometry from the model used by Subramaniam et al. (1998) was imported into ICEM-CFD™ (ANSYS, Inc., Canonsburg, PA) as an STL file where higher density unstructured meshes could be generated. The surface was not smoothed or modified in any fashion to ensure that all surface irregularities were retained and the fidelity of the original data was preserved. This model is referred to as Model A in this study (Figure 2).
Figure 2.
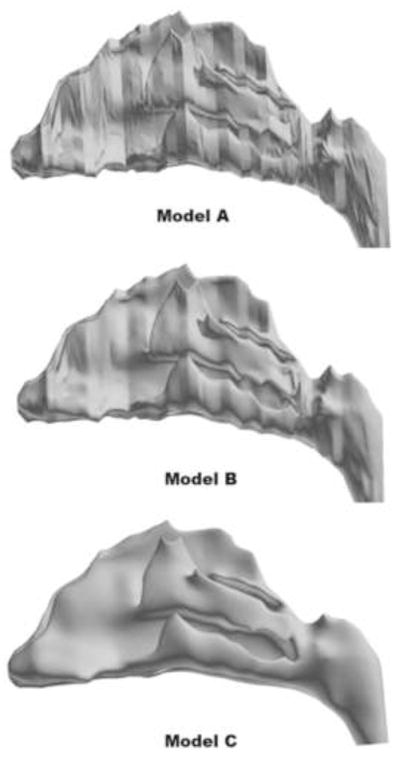
3D reconstructions of human nasal CFD models from the same MRI data. Model A was generated without any surface smoothing to preserve all of the original surface features that are present in the nasal replica cast used by Kelly et al. (2004b); Model B was generated by slightly smoothing the surface contours, but still retaining local topographical features of the original geometry; Model C was generated by smoothing the surface contours until a more realistic anatomic form was obtained.
To generate models with smoother surfaces, the iso-surface contours from Model A were imported into medical imaging software (Mimics™, Materialise, Inc., Ann Arbor, MI), where the surfaces were subsequently smoothed using a Laplacian smoothing algorithm. Model B was developed by slightly smoothing the mesh artifacts and abrupt geometry changes while still preserving sensitive local features of the original geometry. Model C was developed in a similar manner, but using more severe smoothing to create a reduced model of more life-like anatomic form (Figure 2). The smoothing parameters used in Mimics™ to generate each model are summarized in Table 1. Since the xy, and z-resolutions were coarser for Model C, some interpolation errors arose when attempting to reconstruct the surface contours in Mimics. To correct these, some airways on the septal side of the mid-dorsal region had to be manually edited to avoid spurious airway connections.
Table 1.
Smoothing parameters used in Mimics™ to generate the nasal models.
| x, y-resolution (mm) | z-resolution (mm) | Smoothing factor | Number of smoothing iterations | |
|---|---|---|---|---|
| Model A | No smoothing | |||
| Model B | 0.1 | 0.2 | 0.8 | 25 |
| Model C | 0.2 | 0.4 | 1.0 | 100 |
Airflow and Particle Deposition Simulations
Unstructured tetrahedral meshes were generated for Models A, B, and C using ICEM-CFD™. In addition, a 3-layer prism boundary layer was implemented in all models to accurately capture near-wall particle trajectories. In Model A, a non-uniform mesh density was used where mesh parameters were selected so that tetrahedral cells were small enough to resolve the narrow corners and ledges around surface artifacts. Approximately 9 million elements were needed to achieve this level of resolution. Without sufficient mesh resolution in these regions, surface irregularities would be smoothed over in the meshing process, defeating the purpose of using the non-smooth model. A mesh density study was not conducted in this model due to the difficulty in obtaining prism boundary layers on the irregular surface and the need for a large number of elements for surface resolution. Mesh parameters were selected for Models B and C to generate meshes of approximately 4–5 million elements. Simulations were also conducted in Models B and C using larger mesh sizes to ensure that airflow and particle trajectory calculations were independent of mesh density.
Steady-state laminar inspiratory airflow was simulated in all models using the commercial software package Fluent (ANSYS, Inc., Canonsburg, PA). This software numerically solves the viscous incompressible Navier-Stokes equations using the finite volume method. The steady-state form of the mass and momentum conservation laws are
| (1) |
| (2) |
where u is the velocity of air, ρ is the density of air, p is pressure, and μ is the dynamic viscosity. Boundary conditions consisted of a no-slip condition on all nasal airway walls, a zero-pressure condition at the outlet, and a mass flow inlet condition at the nostrils. A steady 20 L/min volumetric flow rate was used in each model to match the experimental conditions used in Kelly et al. (2004b). Although a pressure gradient boundary condition (zero pressure at the nostrils, negative pressure at the outlet) could have been used to generate a more realistic inflow profile, a fixed mass flow rate at the nostrils was needed to accurately assess how surface smoothness affects transnasal pressure drop. Airflow simulations were conducted with an air density of 1.204 kg/m3 and a dynamic viscosity of 1.8 × 10⁻⁵ kg/m-s. The segregated algorithm was used to solve the continuity and momentum equations. The SIMPLEC method was used for particle-velocity coupling, a second order scheme was used to solve for pressure, and a second-order upwind scheme was used for the momentum equations.
Particle trajectories were calculated using the Discrete Phase Model (DPM) in Fluent to solve the Lagrangian equations of motion, given by
| (3) |
| (4) |
where u is the air velocity, xp is the particle position, up is the particle velocity, ρp is the particle density, g is the gravity force, CD is the drag coefficient, FS is the Saffman lift force (Li and Ahmadi, 1992), and Rep is the particle Reynolds number, given by . Further details about the Fluent DPM can be found in the Fluent User’s Guide (ANSYS, Inc., 2009). Equations (3)-(4) were numerically integrated using a Runge-Kutta method. A particle density of 1.0 g/cm3 was used in all simulations. Uniform concentrations of 4000–5000 particles were passively released from the nostrils of each model for each particle size. Particle concentrations were low enough to safely ignore the influence of particles on airflow, so the particle transport equations were solved decoupled from the flow field. Aerodynamic particle sizes of 1–20 μm were simulated to ensure a wide range of nasal deposition efficiencies. All nasal airway walls were assumed to be perfectly absorbing. Deposition fractions were calculated by dividing the number of particles depositing on nasal airway walls by the number of particles released.
Volume and Surface Area Calculations
The volume of the nasal replica cast used in the study by Kelly et al. (2004b) was measured by weighing the cast dry and filled with water or ethanol. Measurements were conducted four times with each solution. The difference between the wet and dry weight was used to calculate the volume of liquid inside the model, which, after dividing by the density of the liquid yields the volume of the inside of the model. The volumes of the CFD models were calculated from the cumulative volume of all of the interior mesh elements. Surface area measurements of the nasal replica cast could not be conducted. Surface area measurements of the CFD models were conducted from the surface mesh using ICEM-CFD.
Stokes Number and the Characteristic Diameter of the Nose
Nasal anatomy displays significant inter-human variability (Guilmette et al., 1997; Liu et al., 2009), which leads to significant inter-individual variability in nasal deposition of micron-sized particles (Kesavanathan et al., 1998; Garcia et al., 2009). Fortunately, the effect of anatomic variability on nasal deposition can be taken into account by investigating deposition as a function of Stokes number, defined as
| (5) |
where da is the aerodynamic particle diameter, U is a characteristic velocity, and dc is a characteristic diameter. Substituting airflow rate for the characteristic velocity ( , where k is a constant), the Stokes number can also be written as
| (6) |
where the constants from the definition in equation (5) are ignored (Garcia et al., 2009). According to aerosol theory (Hinds, 1999), deposition of particles by inertia collected from various nasal anatomies should collapse into a single curve in a plot of deposition versus Stokes number. This prediction has not been experimentally verified, in part due to the difficulty of defining a meaningful characteristic diameter (dc) for a geometry as complex as the nasal anatomy.
Recently, Garcia and collaborators (2009) suggested that a characteristic diameter of the nasal passages can be obtained from pressure-flow measurements as follows. The pressure drop (Δp) for turbulent flow through a circular pipe of diameter d and length L is given by (White, 2008)
| (7) |
where Q is the flow rate and R is the resistance, which is given by R = 0.241Lρ3/4 μ1/4d−19/4. Here ρ = 1.204 kg/m3 is the fluid density, μ = 1.8 × 10⁻⁵ kg/m-s is the dynamic viscosity and all variables are in SI units. Based on this equation, Garcia and colleagues defined the characteristic diameter of the nose (dc) as
| (8) |
where Lnose is the length from the nostrils to the end of the septum and Rnose = Δp/Q1.75 is the nasal resistance. Using this definition of the characteristic diameter, Garcia and collaborators were able to collapse deposition data from replicas of four different individuals into a single curve (Garcia et al., 2009). Here, we use the same definition of the Stokes number. Although the models in this study were all based on the same set of MRI scans and would therefore have identical characteristic diameters based on geometric measurements, the smoother models have less resistance to airflow which will affect the characteristic diameter defined in equation (8). Even though laminar airflow was assumed in this study, the characteristic length should be independent of the flow regime. Also, the pressure-flow curves generated using laminar flow were continuous and followed similar shapes as those generated by Garcia et al. (2009) in nasal replicas at higher flow rates, where turbulence may occur.
RESULTS
The volumes and surface areas of the nasal models are given in Table 2. The volume of Model A (32.8 ml) was very close to the measured volume of the nasal replica cast used by Kelly et al. (2004b) (32.9 ml), indicating that it was an accurate reconstruction of the nasal replica. The slightly reduced volumes in Model B (32.4 ml) and Model C (32.1 ml) are likely due to the effects of smoothing. The surface areas of Models A, B, and C were 247.1, 240.2, and 231.4 cm2, indicating that smoothing also slightly reduced the surface area of the models.
Table 2.
Volume and surface area measurements in the nasal models.
| Nasal Replica | Model A | Model B | Model C | |
|---|---|---|---|---|
| Volume (cm3) | 32.9 | 32.8 | 32.4 | 32.1 |
| Surface area (cm2) | N/A | 247.1 | 240.2 | 231.4 |
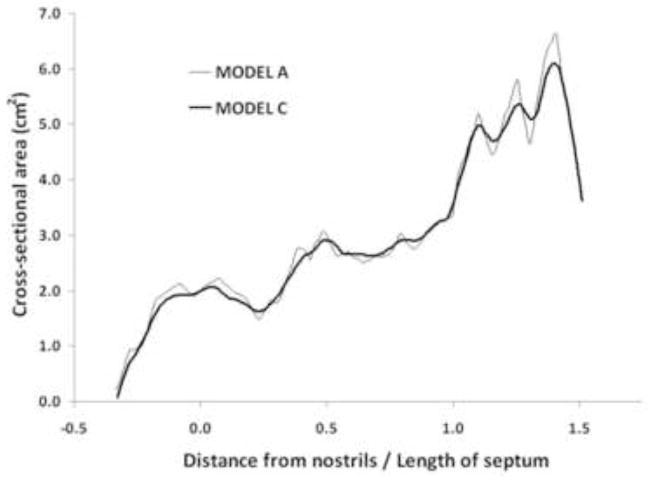
To further characterize the effect of smoothing, coronal cross-sectional areas were calculated in Models A and C. Figure 3 displays the cross-sectional areas as a function of the distance from the nostrils, where the first coronal cross-section after the nostrils was defined as the origin. The surface irregularities of Model A are reflected in its jagged area vs. distance curve, which displays sudden changes in area between consecutive sections. In contrast, Model C displays much more gradual changes, clearly illustrating the effect of smoothing.
Figure 3.
Coronal cross-sectional areas from the nostrils to the nasopharynx in Models A and C. The first coronal cross-section after the nostrils was defined as the origin. The distance from the nostrils was normalized by the length from the nostrils to the end of the septum (Length of septum = 5.85 cm).
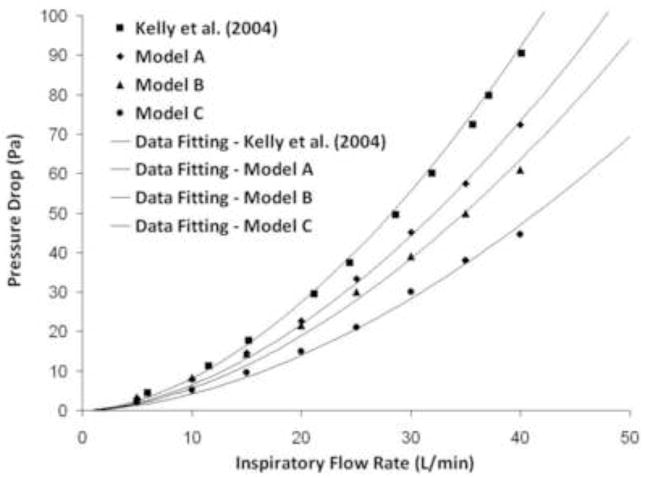
Pressure differences across the nasal replica for constant inspiratory flow rates were reported by Kelly et al. (2004b). Computationally, transnasal pressure drops were estimated by computing the average pressure at the nostrils and at the outlet for steady-state inspiratory airflow rates of 5–40 L/min. For identical flow rates, pressure drops were less in Model A than in the nasal replica cast, even though the model geometries are identical (Figure 4). This is likely due to the wall roughness of the cast which adds resistance to the airflow, thereby increasing the pressure differential. Transnasal pressure drops were also affected by the level of surface smoothness in the CFD models, with the smoother models demonstrating less pressure gradient at an identical flow rate (Figure 4).
Figure 4.
Pressure drop measurements in the nasal replica cast (Kelly et al., (2004b) and in the CFD models for flow rates of 5–40 L/min. Curve fitting was performed using Sigmaplot™ 9.0 (Systat Software, Inc., San Jose, CA).
A curve of the form Δp = aQb was fit to these data, where Δp is the pressure drop measured in Pa and Q the airflow rate in m3/s (Table 3). The exponents estimated from CFD simulations (1.49 to 1.64) were smaller than the exponent 1.83 estimated from the in vitro data by Kelly et al. (2004b) and smaller than the range 1.76–1.87 reported for five nasal replica casts by Garcia et al (2009). The lower exponents estimated from CFD data may be due to the higher airflow rates studied in vitro by Garcia and collaborators (Q ε [0, 75] L/min). The models constructed by Garcia et al. (2009) were developed in a similar manner as the model in Kelly et al. (2004b) and possessed similar levels of surface smoothness and wall roughness, which increases airflow resistance. Differences may also be due to the assumption of laminar flow in the CFD simulations. Nevertheless, the exponent b was sufficiently close to the theoretical value of 1.75 (see Methods), so that equation (8) should still be an accurate definition of the characteristic diameter of the nose. Using equation (8), the characteristic diameter of Models A–C and the replica of Kelly et al. (2004b) were estimated to range from 6.2 mm to 7.1 mm (Table 4). These estimates were in agreement with the range (5.5 to 7.3 mm) reported for healthy noses by Garcia and collaborators (2009).
Table 3.
The pressure drop (Δp, Pa) versus airflow rate ( Q, m3/s) data were fitted with the curve Δp = aQb, where Q ∈[0,50] L/min, yielding the constants a and b and the correlation coefficient r2 below.
| Nasal replica/CFD Model | a | b | r2 |
|---|---|---|---|
| Kelly et al. (2004) | (5.7 ± 0.8) × 107 | 1.83 ± 0.02 | 0.9994 |
| Model A | (1.1 ± 0.2) × 107 | 1.64 ± 0.02 | 0.9996 |
| Model B | (0.32 ± 0.04) × 107 | 1.49 ± 0.02 | 0.9996 |
| Model C | (0.43 ± 0.15) × 107 | 1.57 ± 0.05 | 0.9976 |
Table 4.
Characteristic diameter (dc) of the nasal cavity calculated via equation (8) and length from the nostrils to the end of the septum (Lnose). The nasal resistance (Rnose) was calculated fitting the pressure drop versus flow rate data with Δp = RnoseQ1.75. r2 is the correlation coefficient of the fitting.
| Nasal replica/CFD Model | dc (mm) | Lnose (cm) | Rnose (Pa/(m3/sec)1.75) | r2 |
|---|---|---|---|---|
| Kelly et al. (2004) | 6.17 | 5.85 | (3.33 ± 0.02) ×10−7 | 0.9987 |
| Model A | 6.47 | 5.85 | (2.65 ± 0.03) ×10−7 | 0.9978 |
| Model B | 6.67 | 5.85 | (2.30 ± 0.05) ×10−7 | 0.9876 |
| Model C | 7.10 | 5.85 | (1.70 ± 0.03) ×10−7 | 0.9921 |
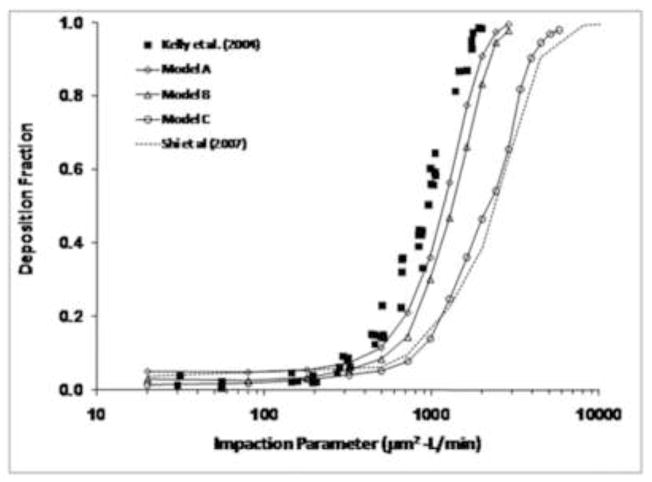
Particle deposition predictions from the CFD models demonstrated classic sigmoidal shapes, with deposition fractions near 0% for 1–2 μm particles, increasing sharply to near 100% for larger particles (Figure 5). Since deposition of particles in this size range is primarily a function of particle inertia, particle deposition results were plotted against the impaction parameter, IP=da2Q, where da is the particle aerodynamic diameter (μm) and Q is the flow rate (L/min). Deposition decreased with increasing smoothness (i.e., Model C < Model B < Model A). Particle deposition results from Model A were closest to the experimental data of Kelly et al. (2004b), although when plotted against impaction parameter, simulations still slightly under-predicted the data. For particles in the 6–10 μm size range, Model A under-predicted deposition by 10–25%. The results from Model B were only slightly less than Model A. However, Model C had significantly less deposition than the experimental data and the results from Models A and B, indicating that surface smoothness effects can have a significant impact on particle deposition results. For example, Models A and C had predicted deposition fractions of 91% and 47%, respectively, for 10 μm particles (IP=2000). The results from Model C were close to those from Shi et al. (2007) without wall roughness effects, indicating similar surface smoothness qualities between the two models.
Figure 5.
Comparison of particle deposition predictions from Models A, B, and C with the experimental data from Kelly et al. (2004b). Also plotted are the computational results of Shi et al. (2007) before incorporation of wall roughness effects.
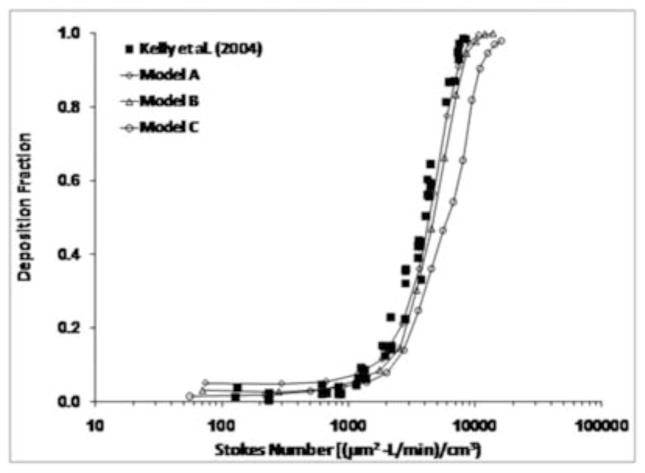
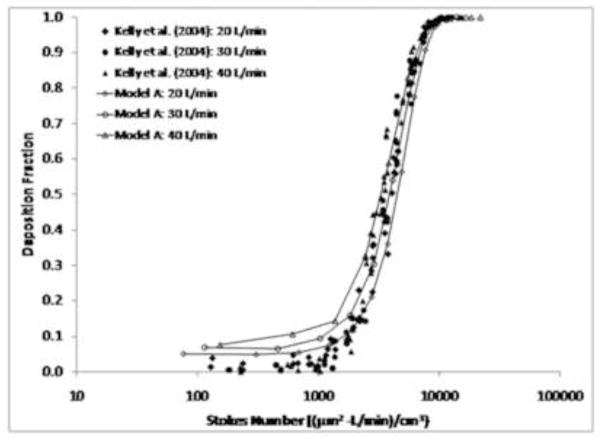
When the results from Model A were plotted using the pressure-based Stokes number (equation (6)), excellent agreement was observed with the experimental data (Figure 6). This demonstrates that the differences observed in deposition behavior between Model A and the replica cast can be attributed to the effects of wall roughness. When plotted against the Stokes number, results from Model C still under-predicted the experimental data, although not by as much as when plotted against the impaction parameter. This behavior indicates that use of the pressure-based Stokes number can account for wall roughness effects when comparing results from CFD models (Model A) that share a similar geometry with the corresponding replica cast, but that geometric differences with smoothed models (Model C) lead to differences in airflow and particle deposition patterns that are too great to be unified by use of a characteristic diameter. A comprehensive comparison of predicted results using Model A with the data from Kelly et al. (2004b) is shown in Figure 7 for flow rates of 20, 30, and 40 L/min. Good agreement was observed between CFD predictions and experimental data at multiple flow rates, with a slight over-prediction at the smallest particle sizes at flow rates of 30 and 40 L/min.
Figure 6.
Comparison of particle deposition results from Models A, B and C with the experimental data from Kelly et al. (2004b) when plotted against the Stokes number using the definition from equation (6).
Figure 7.
Comparison of particle deposition results from Model A with the experimental data from Kelly et al. (2004b) at inhalation flow rates of 20, 30, and 40 L/min.
Spatial deposition patterns were also examined for 10 and 20 μm particles in Models A and C (Figures 8 and 9). More anterior deposition was observed for 20 μm particles (100% deposition in Model A) than for 10 μm particles (91% deposition in Model A). This is due to the effect of particle inertia, with 10 μm particles remaining entrained longer in the airflow streamlines while 20 μm particles have sufficient momentum to deviate from airflow streamlines and readily deposit on nasal walls. Also, surface smoothness affected the spatial deposition patterns (Figures 8 and 9). In Model A, 10 μm particles tended to deposit more anteriorly than in Model C (Fig. 9, panel A) and closer to the nasal floor (Fig. 9, panel B). In addition, Model C had more deposition in the nasopharynx. 20 μm particles penetrated further into the nose in Model C, with more deposition in the middle turbinate region. Most of the 20 μm particles in Model A deposited anterior to the turbinates.
Figure 8.
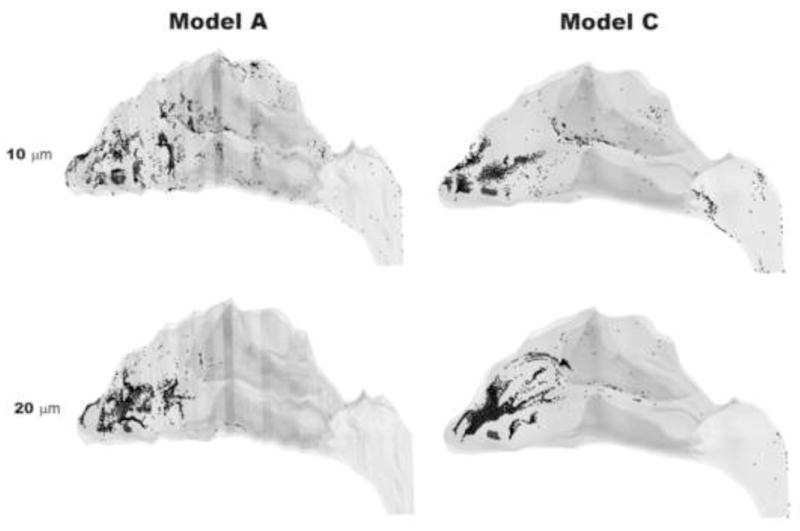
Spatial deposition patterns for 10 and 20 μm particles in Models A and C.
Figure 9.
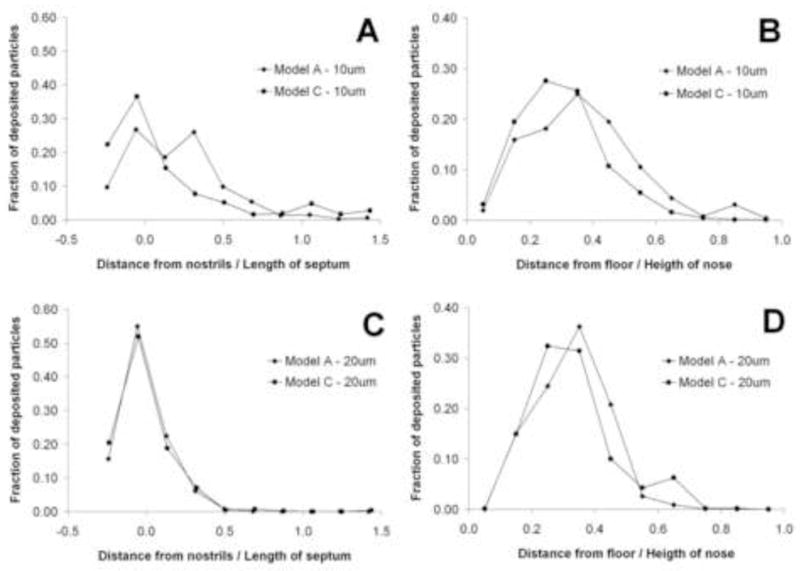
Spatial deposition patterns for 10 μm (top) and 20 μm (bottom) particles in Models A and C. LEFT: Fraction of deposited particles plotted as a function of distance from the nostrils. (The first coronal cross-section after the nostrils is defined as the origin.) RIGHT: Fraction of deposited particles plotted as a function of the distance from the floor of the main nasal passages.
DISCUSSION
The use of respiratory tract CFD models to study airflow and transport processes has received significant attention in recent years. Some applications of nasal CFD models include inhalation toxicology (Kimbell et al., 2001; Schroeter et al., 2008), nasal drug delivery (Kimbell et al., 2007; Inthavong et al., 2008), olfaction (Zhao et al., 2004), and nasal surgery (Garcia et al., 2010). Even with advances in computing power and commercial software, there is still a need to validate CFD results due to the potential for numerical error. For particle deposition studies, validation has typically consisted of comparison with data from hollow respiratory tract models. The ability of the CFD model to faithfully reproduce the geometry of the nasal replica upon which the validation was based is critical since even slight geometric differences can result in large differences in particle deposition behavior. And even when the virtual model does accurately replicate the hollow mold, the manufacturing process results in a wall roughness that is not present in computational models (Oldham, 2006). Kelly and colleagues (2004b) showed that wall roughness can lead to increased air resistance and particle deposition in nasal replica casts for particles in the inertial regime. Since the nasal replicas were constructed using a stereolithography process that builds objects by layers, this process results in rough surfaces that are more efficient at collecting large particles.
This wall roughness effect presents difficulties when comparing deposition predictions from CFD models, where airway walls are naturally smooth, with in vitro measurements. One attempt has been made by Shi and colleagues (2007) to include the effects of wall roughness in nasal CFD models. The model used in their study was also based on the same MRI data as the nasal replica cast used by Kelly et al. (2004b), but the surface contours were smoothed during the 3D reconstruction process, so that the model was closer in appearance to Model C in this study. Particle deposition predictions by Shi et al. (2007) significantly under-predicted the replica cast data, as we also showed with Model C (Figure 5). This poor agreement with the in vitro data motivated these authors to simulate the effects of wall roughness by including a particle-capture distance of 0.2 mm in the model, so that when particles entered this virtual layer near the airway wall, they were assumed to deposit. Since wall roughness does not have the same effect on all particle sizes, this technique was only implemented for particles > 4 μm. The inclusion of a particle-capture region near the airway walls inflated deposition predictions, but still did not completely capture the sigmoidal shape of particle deposition from the in vitro results for all particle sizes considered.
One important point that has been overlooked is the difference in surface smoothness between CFD models and nasal replica casts. In the reconstruction of CFD models, surface contours derived from MRI or CT data are usually smoothed using medical imaging software to give a more physiologically realistic appearance that is closer to that found in vivo (Gambaruto et al., 2009). In addition, small bumps, ridges, and other surface irregularities are ignored in the meshing process if they are smaller than the minimum mesh size. In this study, we were able to isolate the effects of surface smoothness and wall roughness on nasal deposition by comparing models that were identical except for their surface finish. Nasal deposition predictions using Model A, which closely resembled the cast geometry used by Kelly et al. (2004b), were higher than the smoothed models (Models B and C), yet still slightly under-predicted the experimental data when plotted against the impaction parameter. Since the only physical difference between Model A and the replica cast was the surface finish, these differences in particle deposition behavior can be attributed to wall roughness effects.
Although the Impaction Parameter (IP = da2Q) has been frequently used to compare CFD results with in vitro data for validation of computational models, it does not include any description of the nasal anatomy. Given the wide inter-individual variability in nasal anatomy and nasal deposition patterns (Guilmette et al., 1997; Kesavanathan et al, 1998; Liu et al., 2009), a more appropriate parameter is the Stokes number. So far, use of the Stokes number has been hindered by the difficulty of defining a meaningful characteristic diameter of the nasal airways. Garcia and colleagues (2009) showed that by using the pressure-flow relationship, the characteristic diameter can be defined in terms of the nasal resistance (equation (8)). When CFD results were compared with experimental data based on this definition of the Stokes number, the deposition predictions of Model A matched very well with the experimental data (Figures 6 and 7). This suggests that use of the pressure-based Stokes number accounted for differences in nasal resistance caused by wall roughness (Figure 4).
Although geometric changes have been shown to affect deposition behavior of micron-sized particles, this is not the case for submicron particles, where diffusion is the dominant deposition mechanism. Kelly et al. (2004a) showed that changes in surface resolution do not significantly affect deposition rates of ultrafine particles. CFD results of particle deposition for particles < 100 nm have generally agreed well with experimental data, despite the differences in the surface smoothness of the models (Xi and Longest, 2008; Zamankhan et al., 2006). Particles in this size range do not have sufficient momentum to deviate from airflow streamlines and thus are less likely to be influenced by local airflow patterns caused by surface disruptions.
Some potential sources of numerical errors in the simulations in this study include numerical error with the particle tracking algorithm, errors due to poor grid quality, and entrance effects (Taylor et al., 2010). Although no validation exercises were conducted in this study, recent work has shown that the Fluent Discrete Phase Model for particle tracking agrees fairly well with analytical solutions of particle deposition in idealized geometries for the deposition mechanisms of impaction and sedimentation (Robinson et al., 2008). The accuracy of particle trajectory calculations is highly dependent on the mesh structure and size. All simulations in this study were conducted using unstructured tetrahedral meshes with prism boundary layers. Particle deposition simulations conducted with and without the prism boundary layer agreed well for larger particles (> 5 μm). For smaller particles (< 5 μm), however, deposition was higher for meshes without the prism layer due to the lack of resolution near airway walls, where finer mesh resolution is needed for accurate mass transport calculations. In order for all of the intricate surface features in Model A to be resolved, high mesh densities had to be implemented in these regions, with lower mesh densities in smoother locations. This resulted in a large number of cells (~9 million). When these surface features were not fully resolved (lower mesh densities), CFD simulations in Model A under-predicted the in vitro data. Particle deposition results may also be sensitive to the boundary condition at the nostrils, where we assumed a plug-flow condition for airflow and a uniform particle concentration. Other investigators have shown that entrance effects and particle profiles in respiratory tract models can affect particle deposition behavior (Longest and Oldham, 2006; Taylor et al., 2010). Further work is needed to clarify what effect these conditions have on localized particle deposition results in nasal CFD models. Further work is also needed to study the potential effects of turbulence on particle deposition at higher flow rates.
Due to advances in imaging techniques and reconstruction methods, CFD models can now readily be developed from high-resolution CT scans. These models provide more accurate representations of the respiratory system and are of much higher resolution (< 0.5 mm) than older models from coarse MRI data. For this reason, CFD predictions of inertial particle deposition are typically less than those derived from non-smooth physical models. CFD methods provide great opportunity to study the effects of flow rate, particle size, and even changes in nasal geometry on microdosimetry patterns that can assist in risk assessment and the design of nasal delivery devices. But it is essential that validation of particle deposition simulations be conducted in a geometry that is identical to the CFD model. This will only increase in importance as CFD models are constructed for patient-specific purposes.
Acknowledgments
This research was funded in part by the National Institutes of Health (NIH/NHLBI 1 R01 HL073598). We would like to thank Earl Tewksbury for measuring the volume of the nasal replica cast used by Kelly et al. (2004b). We would also like to thank Dr. Bahman Asgharian for his critical review of the manuscript.
Footnotes
Publisher's Disclaimer: This is a PDF file of an unedited manuscript that has been accepted for publication. As a service to our customers we are providing this early version of the manuscript. The manuscript will undergo copyediting, typesetting, and review of the resulting proof before it is published in its final citable form. Please note that during the production process errors may be discovered which could affect the content, and all legal disclaimers that apply to the journal pertain.
References
- ANSYS, Inc. Fluent 12.1 User’s Guide 2009 [Google Scholar]
- Cheng YS, Holmes TD, Gao J, Guilmette RA, Li S, Surakitbanharn Y, Rowlings C. Characterization of nasal spray pumps and deposition pattern in a replica of the human nasal airway. J Aerosol Med. 2001;14:267–280. doi: 10.1089/08942680152484199. [DOI] [PubMed] [Google Scholar]
- Foo MY, Cheng YS, Su WC, Donovan MD. The influence of spray properties of intranasal deposition. J Aerosol Med. 2007;20:495–508. doi: 10.1089/jam.2007.0638. [DOI] [PubMed] [Google Scholar]
- Gambaruto AM, Taylor DJ, Doorly DJ. Modelling nasal airflow using a Fourier descriptor representation of geometry. Int J Numer Meth Fluids. 2009;59:1259–1283. [Google Scholar]
- Garcia GJM, Rhee JS, Senior BA, Kimbell JS. Septal deviations and nasal resistance: An investigation using virtual surgery and computational fluid dynamics. Am J Rhinol & Allergy. 2010;24:e46–e53. doi: 10.2500/ajra.2010.24.3428. [DOI] [PubMed] [Google Scholar]
- Garcia GJM, Tewksbury EW, Wong BA, Kimbell JS. Interindividual variability in nasal filtration as a function of nasal cavity geometry. J Aerosol Med. 2009;22:139–155. doi: 10.1089/jamp.2008.0713. [DOI] [PubMed] [Google Scholar]
- Godo MN, Morgan KT, Richardson RB, Kimbell JS. Reconstruction of complex passageways for simulations of transport phenomena: Development of a graphical user interface for biological applications. Comp Meth Prog Biomed. 1995;47:97–112. doi: 10.1016/0169-2607(95)01638-a. [DOI] [PubMed] [Google Scholar]
- Guilmette RA, Cheng YS, Yeh HC, Swift DL. Deposition of 0.005–12 μm monodisperse particles in a computer-milled, MRI-based nasal airway replica. Inhal Toxicol. 1994;6 (Suppl 1):395–399. [Google Scholar]
- Guilmette RA, Wicks JD, Wolff RK. Morphometry of human nasal airways in vivo using magnetic resonance imaging. J Aerosol Med. 1989;2:365–377. [Google Scholar]
- Guilmette RA, Cheng YS, Griffith WC. Characterising the variability in adult human nasal airway dimensions. Ann Occup Hyg. 1997;41(supplement 1):491–496. [Google Scholar]
- Hausserman S, Bailey AG, Bailey MR, Etherington G, Youngman M. The influence of breathing patterns on particle deposition in a nasal replicate cast. J Aerosol Sci. 2002;33:923–933. [Google Scholar]
- Heyder J, Rudolf G. Deposition of aerosol particles in the human nose. In: Walton WH, editor. Inhaled Particle IV. Pergamon Press; Oxford & New York: 1977. pp. 107–125. [PubMed] [Google Scholar]
- Hinds WC. Aerosol Technology: Properties, Behavior, and Measurement of Airborne Particles. Wiley-Interscience; New York: 1999. [Google Scholar]
- Hounam RF, Black A, Walsh M. The deposition of aerosol particles in the nasopharyngeal region of the human respiratory tract. J Aerosol Sci. 1971;2:47–61. doi: 10.1038/2211254a0. [DOI] [PubMed] [Google Scholar]
- Inthavong K, Tian ZF, Li HF, Tu JY, Yang W, Xue CL, Li CG. A numerical study of spray particle deposition in a human nasal cavity. Aerosol Sci Technol. 2006;40:1034–1045. [Google Scholar]
- Inthavong K, Tian ZF, Tu JY, Yang W, Xue C. Optimising nasal spray parameters for efficient drug delivery using computational fluid dynamics. Comp Biol Med. 2008;38:713–726. doi: 10.1016/j.compbiomed.2008.03.008. [DOI] [PubMed] [Google Scholar]
- Kelly JT, Asgharian B, Kimbell JS, Wong BA. Particle deposition in human nasal airway replicas manufactured by different methods. Part I: Inertial regime particles. Aerosol Sci Technol. 2004a;38:1063–1071. [Google Scholar]
- Kelly JT, Asgharian B, Kimbell JS, Wong BA. Particle deposition in human nasal airway replicas manufactured by different methods. Part II: Ultrafine particles. Aerosol Sci Technol. 2004b;38:1072–1079. [Google Scholar]
- Kesavanathan J, Bascom R, Swift DL. The effect of nasal passage characteristics on particle deposition. J Aerosol Med. 1998;11:27–39. doi: 10.1089/jam.2000.13.17. [DOI] [PubMed] [Google Scholar]
- Kimbell JS, Overton JH, Subramaniam RP, Schlosser PM, Morgan KT, Conolly RB, Miller FJ. Dosimetry modeling of inhaled formaldehyde: Binning nasal flux predictions for quantitative risk assessment. Toxicol Sci. 2001;64:111–121. doi: 10.1093/toxsci/64.1.111. [DOI] [PubMed] [Google Scholar]
- Kimbell JS, Segal RA, Asgharian B, Wong BA, Schroeter JD, Southall JP, Dickens CJ, Brace G, Miller FJ. Characterization of deposition from nasal spray devices using a computational fluid dynamics model of the human nasal passages. J Aerosol Med. 2007;20:59–74. doi: 10.1089/jam.2006.0531. [DOI] [PubMed] [Google Scholar]
- Li A, Ahmadi G. Dispersion and deposition of spherical particles from point sources in a turbulent channel flow. Aerosol Sci Technol. 1992;16:209–226. [Google Scholar]
- Liu Y, Matida EA, Gu J, Johnson MR. Numerical simulation of aerosol deposition in a 3-D human nasal cavity using RANS, RANS/EIM, and LES. J Aerosol Sci. 2007;38:683–700. [Google Scholar]
- Liu Y, Johnson MR, Matida EA, Kherani S, Marsan J. Creation of a standardized geometry of the human nasal cavity. J Appl Physiol. 2009;106:784–795. doi: 10.1152/japplphysiol.90376.2008. [DOI] [PubMed] [Google Scholar]
- Liu Y, Matida EA, Johnson MR. Experimental measurements and computational modeling of aerosol deposition in the Carleton-Civic standardized human nasal cavity. J Aerosol Sci. 2010;41:569–586. [Google Scholar]
- Longest PW, Oldham MJ. Mutual enhancements of CFD modeling and experimental data: A case study of 1-μm particle deposition in a branching airway model. Inhal Toxicol. 2006;18:761–771. doi: 10.1080/08958370600748653. [DOI] [PubMed] [Google Scholar]
- O’Hagan DT, Rappouli R. Novel delivery systems for intranasal immunization with inactivated influenza vaccine. Drug Deliv Syst Sci. 2001;2:41–44. [Google Scholar]
- Oldham MJ. Challenges in validating CFD-derived inhaled aerosol deposition predictions. Inhal Toxicol. 2006;18:781–786. doi: 10.1080/08958370600748752. [DOI] [PubMed] [Google Scholar]
- Pattle RE. The retention of gases and particles in the human nose. In: Davies CN, editor. Inhaled Particles and Vapors I. Pergamon; Oxford, UK: 1961. pp. 302–309. [Google Scholar]
- Robinson RJ, Snyder P, Oldham MJ. Comparison of analytical and numerical particle deposition using commercial CFD packages: Impaction and sedimentation. Inhal Toxicol. 2008;20:485–497. doi: 10.1080/08958370701858435. [DOI] [PubMed] [Google Scholar]
- Schroeter JD, Kimbell JS, Asgharian B. Analysis of particle deposition in the turbinate and olfactory regions using a human nasal computational fluid dynamics model. J Aerosol Med. 2006;19:301–313. doi: 10.1089/jam.2006.19.301. [DOI] [PubMed] [Google Scholar]
- Schroeter JD, Kimbell JS, Gross EA, Willson GA, Dorman DC, Tan YM, Clewell HJ. Application of physiological computational fluid dynamics models to predict interspecies nasal dosimetry of inhaled acrolein. Inhal Toxicol. 2008;20:227–243. doi: 10.1080/08958370701864235. [DOI] [PubMed] [Google Scholar]
- Shanley KT, Zamankhan P, Ahmadi G, Hopke PK, Cheng YS. Numerical simulations investigating the regional and overall deposition efficiency of the human nasal cavity. Inhal Toxicol. 2008;20:1093–1100. doi: 10.1080/08958370802130379. [DOI] [PubMed] [Google Scholar]
- Shi H, Kleinstreuer C, Zhang Z. Modeling of inertial particle transport and deposition in human nasal cavities with wall roughness. J Aerosol Sci. 2007;38:398–419. [Google Scholar]
- Subramaniam RP, Richardson RP, Morgan KT, Kimbell JS. Computational fluid dynamics simulations of inspiratory airflow in the human nose and nasopharynx. Inhal Toxicol. 1998;10:91–120. [Google Scholar]
- Swift DL. Inspiratory inertial deposition of aerosols in human nasal airway replicate casts: Implication for the proposed NCRP lung model. Rad Prot Dosimetry. 1991;38:29–34. [Google Scholar]
- Taylor DJ, Doorly DJ, Schroter RC. Inflow boundary profile prescription for numerical simulation of nasal airflow. J R Soc Interface. 2010;7:515–527. doi: 10.1098/rsif.2009.0306. [DOI] [PMC free article] [PubMed] [Google Scholar]
- Wang SM, Inthavong K, Wen J, Tu JY, Xue CL. Comparison of micron- and nanoparticle deposition patterns in a realistic human nasal cavity. Respir Physiol Neurobiol. 2009;166:142–151. doi: 10.1016/j.resp.2009.02.014. [DOI] [PubMed] [Google Scholar]
- White FM. Fluid Mechanics. McGraw-Hill Companies, Inc; New York: 2008. [Google Scholar]
- Xi J, Longest PW. Numerical predictions of submicrometer aerosol deposition in the nasal cavity using a novel drift flux approach. Int J Heat Mass Transfer. 2008;51:5562–5577. [Google Scholar]
- Zamankhan P, Ahmadi G, Wang Z, Hopke PK, Cheng YS, Su WC, Leonard D. Airflow and deposition of nano-particles in a human nasal cavity. Aerosol Sci Technol. 2006;40:463–476. [Google Scholar]
- Zhao K, Scherer PW, Hajiloo SA, Dalton P. Effects of anatomy on human nasal air flow and odorant transport patterns: Implications for olfaction. Chem Senses. 2004;29:365–379. doi: 10.1093/chemse/bjh033. [DOI] [PubMed] [Google Scholar]
- Zwartz GJ, Guilmette RA. Effect of flow rate on particle deposition in a replica of a human nasal airway. Inhal Toxicol. 2001;13:109–127. doi: 10.1080/089583701300001050. [DOI] [PubMed] [Google Scholar]


