Abstract
The actuation strain and speed of ionic electroactive polymer (EAP) actuators are mainly determined by the charge transport through the actuators and excess ion storage near the electrodes. We employ a recently developed theory on ion transport and storage to investigate the charge dynamics of short-side-chain Aquivion® (Hyflon®) membranes with different uptakes of ionic liquid (IL) 1-ethyl-3-methylimidazolium trifluoromethanesulfonate (EMI-Tf). The results reveal the existence of a critical uptake of ionic liquids above which the membrane exhibit a high ionic conductivity (σ>5×10⁻² mS/cm). Especially, we investigate the charge dynamics under voltages which are in the range for practical device operation (~1 volts and higher). The results show that the ionic conductivity, ionic mobility, and mobile ion concentration do not change with the applied voltage below 1 volt (and for σ below 4 volts). The results also show that bending actuation of the Aquivion membrane with 40 wt% EMI-Tf is much larger than that of Nafion, indicating that the shorter flexible side chains improve the electromechanical coupling between the excess ions and the membrane backbones, while not affect the actuation speed.
Keywords: ionic electroactive polymer actuator, ionic liquids, Poisson-Nernst-Planck equations, Aquivion, Nafion
1. Introduction
Ion transport and storage in ionomer membranes are of great interest for electroactive polymer (EAP) devices, such as actuators, sensors, energy harvesting devices, and supercapacitors.[1–3] Ionic liquids (ILs), which are a class of salt in liquid form that containing both ions and neutral molecules, possess many interesting properties that make them very attractive to be employed as electrolytes in electroactive polymer devices.[4–11] For example, the vapor pressure of ionic liquids is negligibly low and as a result they will not evaporate out of the EAP devices when operated in ambient condition. It has been demonstrated that comparing to water the use of ILs as solvent for EAP actuators can dramatically increase the lifetime of transducer.[12,13] Their high mobility leads to the potential of fast response of EAP devices while the wide electro-chemical window allows for higher applied voltages.[13–19]
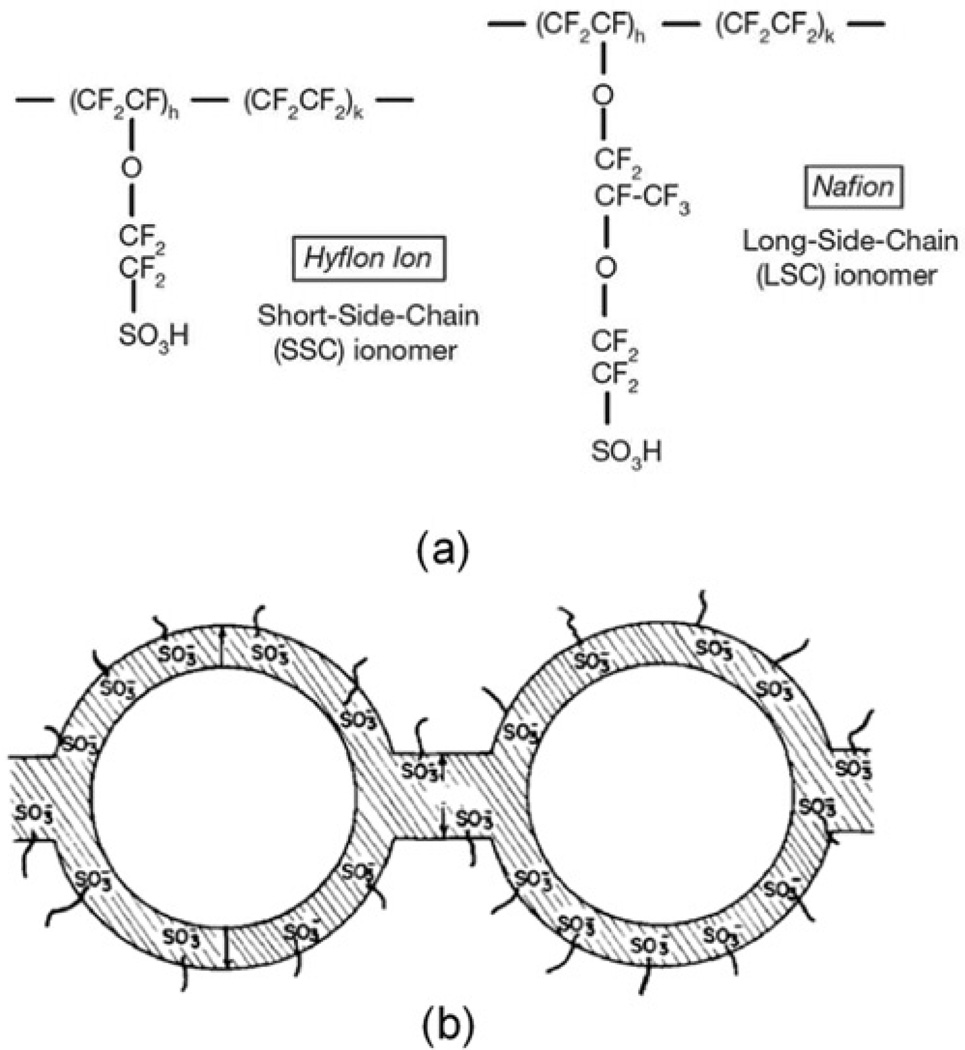
This paper investigates charge dynamics of room temperature ionic liquid 1-ethyl-3-methylimidazolium trifluoromethanesulfonate (EMI-Tf) in Aquivion® (Hyflon®) membranes swelled with different uptakes of ILs and the actuations of the membranes swelled with ILs above the critical uptake. EMI-Tf served in this study due to its comparably high conductivity (8.6 mS/cm), low viscosity (45 cP at 25°C) and larger electrochemical window (4.1V).[17] Hyflon® is known in the literature as short-side-chain ionomer (in comparison to Nafion® that is indicated as long-side-chain ionomer) and was originally developed by Dow Chemicals Company at the beginning of the ’80 but now named Aquivion® by Solvay Solexis.[22–25] These perfluorosulfonate ionomers consist of a polytetrafluoroethylene (PTFE) backbone and double ether perfluoro side-chains terminating in a sulfonic acid group as illustrated in Figure 1(a). The backbone provides the mechanical support and the flexible side chains facilitate the aggregation of a hydrophilic clusters (figure 1(b)). When swelled with ILs the clusters expand. Above a certain IL uptake (critical uptake), these clusters will be connected with narrow channels forming percolation pathways for easy ion conduction, resulting in a high conductivity in the ionomer membrane. [20–25] Although in the literature, most ionic EAPs employ Nafion as the polymer matrix, [14–17] the short flexible side chains in Aquivion may provide better mechanical coupling between the ions and membrane backbones and, consequently, more efficient electromechanical transducers.
Figure 1.
(a) is the molecular structure of short side chain Aquivion and long side chain Nafion (b) the cluster network morphology modeled by Gierke et al.[20,21]
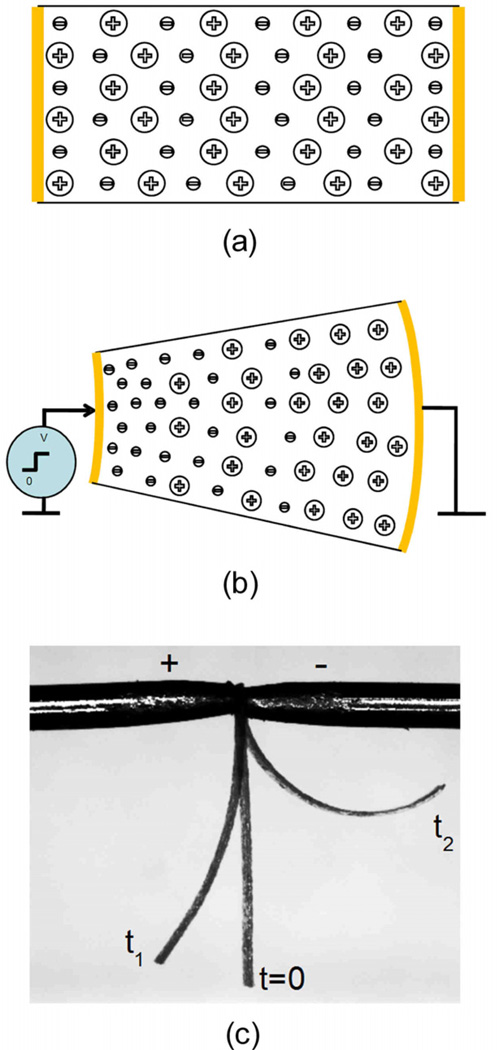
In this study, we investigate the charge transport and storage in Aquivion EAP membranes as schematically illustrated in figure 2(a), where the Aquivion membrane is coated with Au electrodes on two surfaces and swelled with a given amount of EMI-Tf. Under applied voltage, anions and cations migrate towards the anode and cathode, and form electric double layers and diffusion layers as illustrated in figure 2(b). Moreover, the excess ions at the two electrodes cause strains in the membranes, and as a result, generate bending (actuation) of the membrane as shown in figure 2(c). Therefore, these ionomer membranes are attractive for ionic polymer actuators and transducers operated under low voltage (1–4V).
Figure 2.
charge distribution (a) before and (b) after an applied step voltage in ionomer. (c) Bending actuation of 62um thick Aquivion membrane when a voltage step from 0V to 4V is applied.
In general, charge transport is a result of drift and diffusion and can be described by Poisson-Nernst-Planck equations,
| (1) |
| (2) |
where ρ is the charge concentration, ε the dielectric constant of the medium, ε0 the vacuum permittivity, ψ is the ion flux density (current density J=q ψ), μ is the ion mobility, n is the ion concentration (the subscripts + and − indicate positive and negative charges, E electric field, D diffusion coefficient. For the ionic liquids studied here, we assume n+=n−. μ and D are related by the Einstein equation, D = μKT / q. [26,27]
For the ionomer membrane in figure 2(a) under a step voltage (from 0 at t<0 to V volts at t>0), the initial current density before the screening of electric fiield occurs is I0== σ V S/d, where σ(=qnμ) is the conductivity, d is the membrane thickness, and S is the electrode area. When the applied voltage is not high (in the order of 10kT, where k is the Boltzmann’s constant), the initial transient current follows the charging of an electric double layer capacitor CD in series with a bulk resistor R, [28–31]
| (3) |
where τDL = d λDL/2D = RCD, describes the typical charging time for the electric double layer which has a thickness λDL, the Debye length,
| (4) |
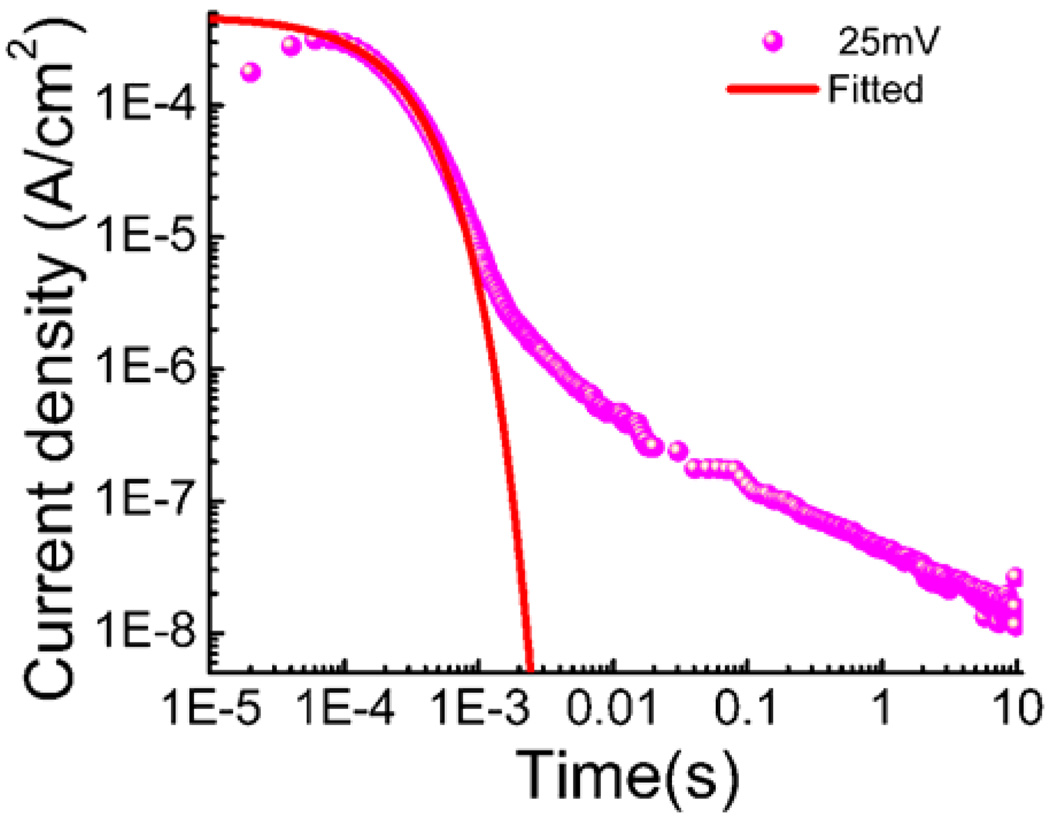
where Z is the mobile ion charge (=1 for EMI-Tf), and q=e, electron charge. It was further shown that at longer time, the charge diffusion from the bulk to the double layer region leads to a power law decay of the diffusion current (see figure 3, in which the initial current fits well by eq. (3), followed by a power law decay of the diffusion current, having a typical time constant τ~ d2/(4D)). Therefore, by fitting experimental transient current I(t) with eq. (3), as illustrated in figure 3, σ, n, and μ can be obtained if εof the ionomer membrane (with ILs) is known, [28–31]
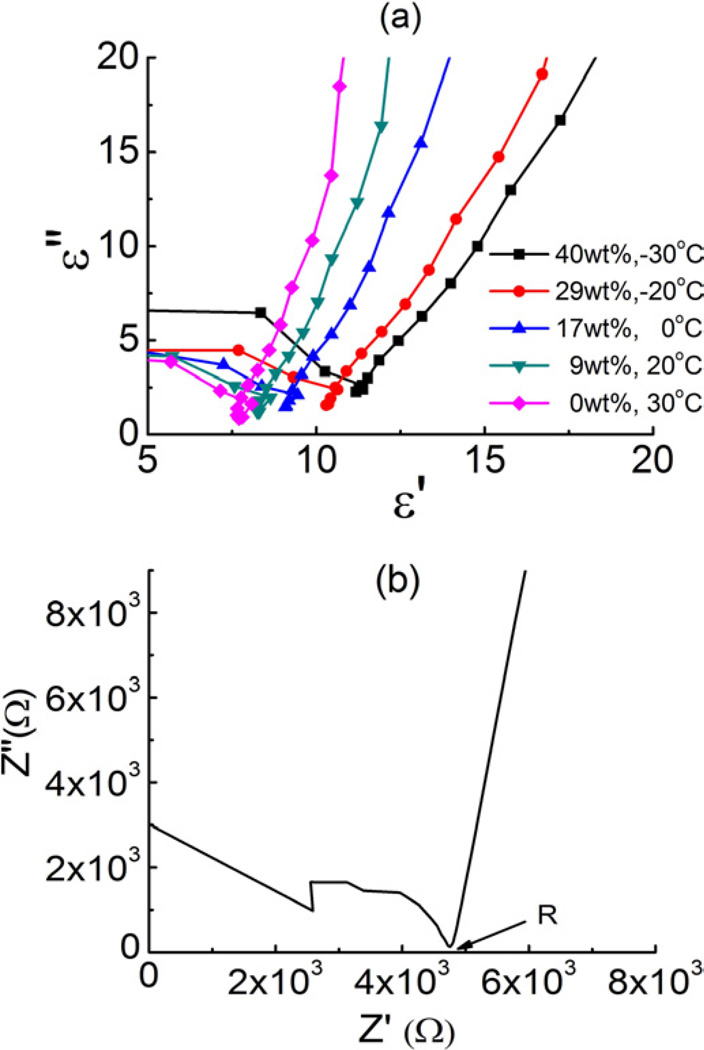
Impedance spectroscope is employed to determine ε, Besides ε, σ (=d/(SR), where d is the thickness and S the surface area of the membrane), can also be determined from the Nyquist plot as shown in figure 4.
Figure 3.
the transient current of Aquivion membrane with 40wt% uptake of EMI-Tf when a voltage step from 0V to 25mV is applied.
Figure 4.
(a) the cole-cole plot of Aquivion (AQ) membrane with various EMI-Tf uptakes under various temperatures (b) Nyquist plot of Aquivion membrane with 17wt% uptake of EMI-Tf
2. Experimental
Aquivion (EW790) membrane and EMI-Tf was purchased from Solvay Solexis and Aldrich, respectively. All the materials were dried in vacuum at 80°C to remove moisture before processing. Aquivion membranes swollen with various EMI-Tf uptakes were prepared by varying the soaking time for the Aquivion membrane in EMI-Tf at 80°C to approach the target values. 50nm thick of gold foils (L.A.Gold Leaf) were hot-pressed on both side of the membrane to serve as the electrodes. The uptake of ionic liquid within Aquivion membrane was calculated by measuring the weight gain after swelling. In this study, membranes with 9, 17, 29 and 40wt% uptake of EMI-Tf were prepared (or 11.5, 19.7, 29.6, 36.7 vol%) and their thicknesses are 55, 57, 59, 62 um after the swelled with ILs, respectively. Nafion with 40wt% uptake was prepared with the same procedure and its thickness is 63um. Samples were held at an elevated temperature (~80°C) for more than 12 hrs to enhance the uniform dispersion of ionic liquids inside the membranes. This is especially important for films with low uptakes of ionic liquids.
The electrical measurement was carried out in a sealed metal box with desiccant inside to prevent the absorption of moisture and equipped with a thermal couple to monitor the temperature during the measurement. The impedance spectroscopy was measured by a potentiostat Princeton 2237. The dc conductivity was calculated by σ = d / RS, where R is the impedance curve intersection on the Z’ axis of Nyquist plot. To obtain the dielectric constant ε of the membranes, the samples were cooled down in an environment chamber (Versa Tenn III) to shift the dielectric spectrum to the measureable frequency window of the set-up which is below 1 MHz (so that the dielectric constant before the screening of the applied field occurs can be measured, at frequencies >> 1/τDL. σ decreases with temperature while in comparison dielectric constant is very weakly temperature dependent). [32–34] The transient current vs. time was collected by a potentiostat Princeton 2237 which output was connected to a high sampling rate oscilloscope to collect data during the fast charging process (<1 μ s). The accumulation of blocked charges on sample electrode interface and the charge imbalance in the membrane may affect the electrical measurement. Therefore, several cycles of Cyclic Voltammetry (CV) scan with a low voltage and high scan rate were preformed to help cleaning the electrode surface then the samples were shorted for a as lest 30minutes to ensure that the charges redistribute to the equilibrium state as possible. [35]
The time-dependent bending actuations of the actuators under applied voltage were recorded using a probe station (Cascade Microtech M150) equipped with a Leica microscope. A DC step voltage was applied to the actuator and images of bending actuation as a function of time were recorded using a CCD camera (Pulnix 6740CL). Radii of curvature of the bending actuators were determined using image-processing software.
3. Results and discussion
3.1 Charge transport behavior of Aquivion membranes swelled with EMI-Tf
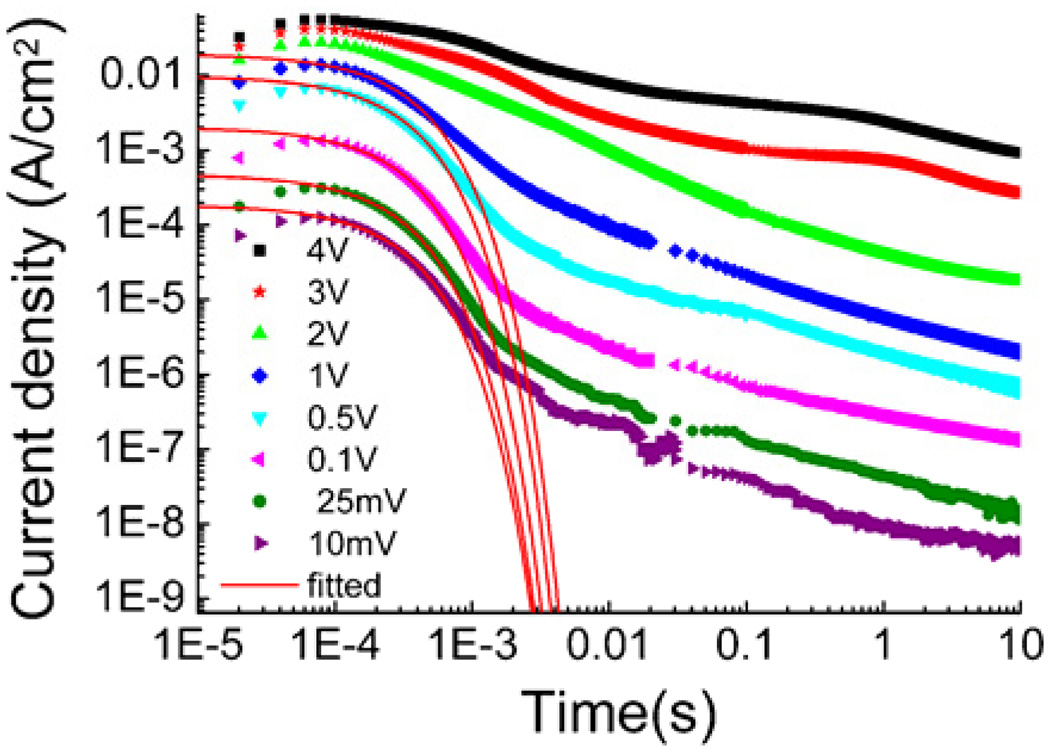
The current responses for Aquivion with 40wt% of EMI-Tf under various step voltages are presented in figure 5. From these curves, conductivity σ under different applied voltages can be determined from I0 (up to 4 volts in the experiment). On the other hand, the data shows that fitting to eq. (3) can be performed only for I(t) at V ≤ 1 volts. Beyond that, there is no distinctive crossover region in the I(t) curve between the exponential decay of the drifting current and the power law decay of the diffusion current.
Figure 5.
the transient current and numerical fitting for Aquivion membrane with 40wt%EMI-Tf uptake when a voltage step from 0V to 8 different voltages is applied.
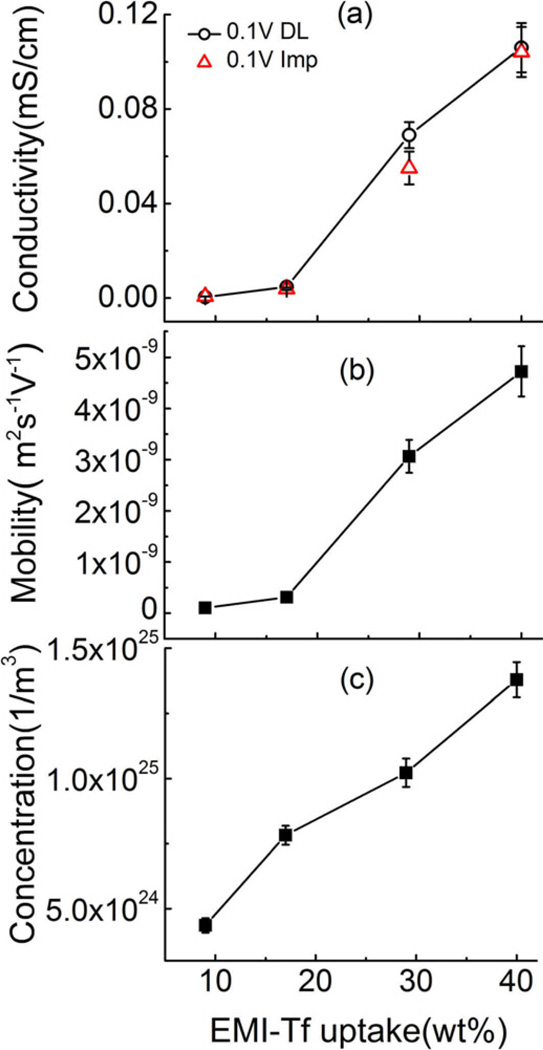
Results for the conductivity σ, free charge concentration n and mobility μ as a function of IL uptake are presented in figure 6. The data reveals that the mobile ion concentration increases almost linearly with the IL uptake. In contrast, the conductivity and mobility display abrupt changes with the increase of IL uptake, revealing a critical uptake of EMI-Tf in the Aquivion (EW790) membrane ~ 29 wt% (0.88 mol EMI-Tf/ mol of SO3−) above which the conductivity and mobility dramatically increase. In the study of IL uptake in Nafion membranes, Leo et al. found that the critical uptake is closely related to the minimum amount of IL required to displace the counter ions away from the exchange sites. [17] Above the critical uptake, the ionomers form percolation path ways for charges to transport and also there are more mobile ions that do not strongly interact with exchange sites. Therefore, with the increase of IL content the mobile charge concentration increase and the mobility and conductivity are enhanced. It is noted that the critical uptake of EMI-Tf in Aquivion is higher than that of EMI-Tf in Nafion membrane (23 wt%, ~1 mol of EMI-Tf/mol of SO3−), which may be due to that Aquivion (EW790) has a higher side chain density than Nafion (EW1100). With 40 wt% of EMI-Tf uptake, at which a substantial actuation is observed in both Aquivion and Nafion membranes, the conductivities of Aquivion and Nafion membranes are close to each other (Aquivion 0.11 mS/cm, Naifon 0.21 mS/cm).
Figure 6.
(a) conductivity (b) mobility and (c) mobile charge concentration as a function of EMI-Tf uptake in Aquivion membrane when a voltage step from 0V to 100mV is applied.
In figure 6(a), σ determined from the ac impedance curve (Nyquist plot, figure 4) under 0.1 V is also shown. The two methods yield nearly identical values of σ, indicating that both methods can be used to determine σ at low voltage. On the other hand, at high voltage, the ac electric impedance method to determine σ may become difficult due to non-linear electric response and even possible heating in the samples.
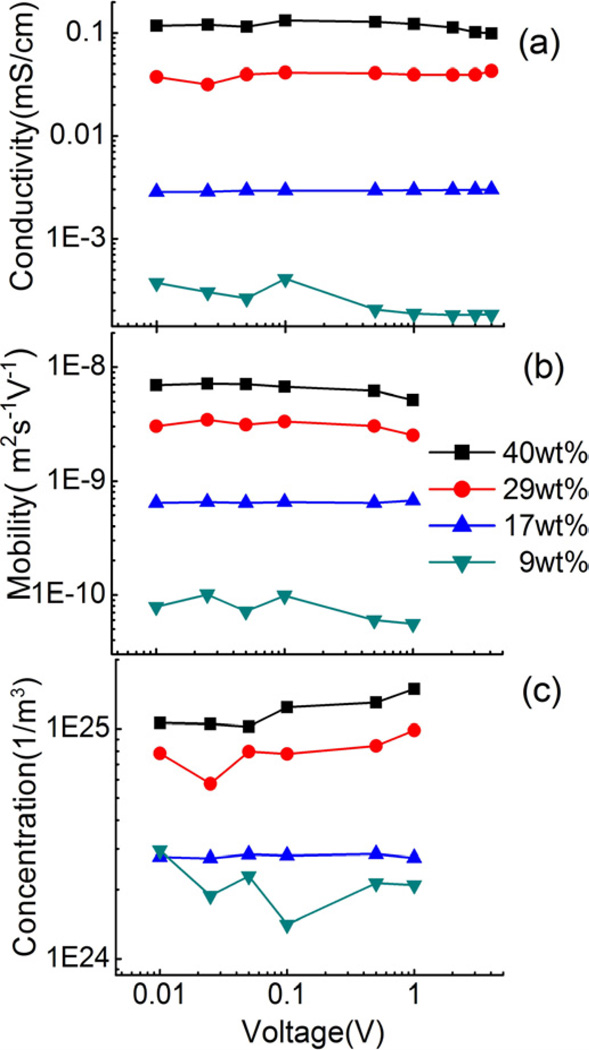
Figure 7(a) presents the conductivity σ of Aquivion membrane with different EMI-Tf uptake as a function of voltage, up to 4 volts. The data shows that within the experimental error (±10%), σ does not change with applied voltage for all EMI-Tf uptakes. Figures 7(b) and (c) are the mobility and mobile ion concentration vs. applied voltage, measured up to 1 volt, and within the experimental error, no systematical variation with applied voltage was observed. These results indicate that the double layer charging time τDL as well as the overall charge dynamics do not change much with voltage, below 1 volt. At voltages higher than 1 volt, the data shown in figure 5 reveal that overall charging process becomes slower. This might be caused by the increased dissociation of ion clusters in EMI-Tf at high voltages.
Figure 7.
(a) conductivity (b) mobility (c) mobile charge concentration of Aquivion membrane with different uptake under different applied voltage step.
In Table 1, we summarize the mobile ion concentration in figure 7(c) and compare them with the total ion concentration from the EMI-Tf. As can be seen, only about 0.5% to 0.55% of EMI-Tf is dissociated for all the ILs uptakes below 1 volt. This low dissociation ratio of ionic liquid may due to the fact that the Bjerrum length of EMI-Tf is larger than the ion pair distance and hence the Coulomb force dominates [36, 37].
Table 1.
the measured mobile charge concentration, the calculated total charges and dissociation ratio for different uptake of EMI-Tf.
| Wt% | Measured charges (1/m3) |
Total charges (1/m3) |
Dissociation ratio |
|---|---|---|---|
| 40 | 1.37E+25 | 2.48E+27 | 5.55E−03 |
| 29 | 1.03E+25 | 2.04E+27 | 5.04E−03 |
| 17 | 7.82E+24 | 1.43E+27 | 5.47E−03 |
| 9 | 4.35E+24 | 8.58E+26 | 5.08E−03 |
3.2. Charge storage in and electromechanical actuation of Aquivion membranes swelled with of EMI-Tf
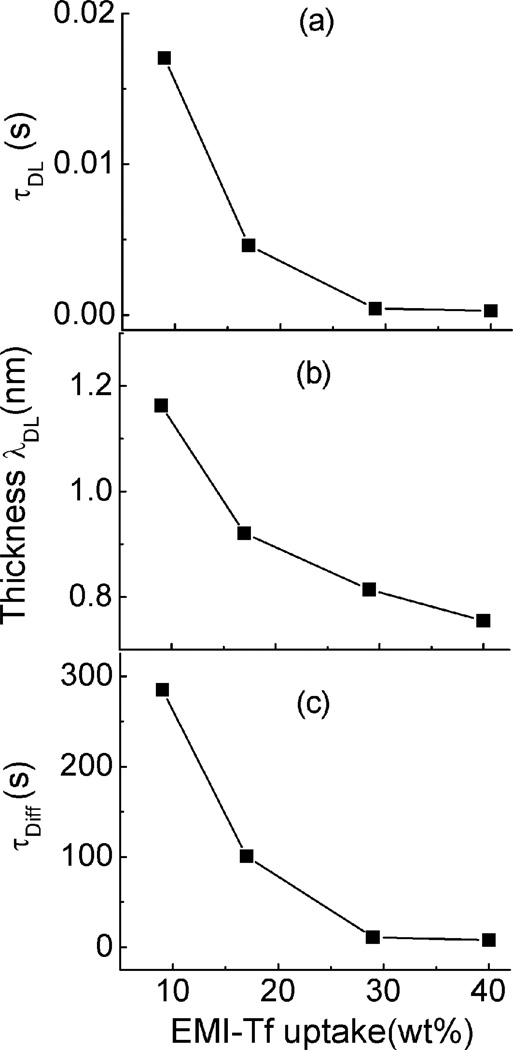
Figure 8 presents τDL (figure 8(a)), λDL (figure 8(b)), and τ=d2/(4D) (figure 8(c)) vs. ILs uptakes. The high conductivity in the membrane above the critical uptake results in a very fast charging time of the double layer, τDL<0.5 ms. The Debye length λDL is ~ 1 nm due to the high free ion concentration and becomes small with decreasing EMI-Tf uptake. On the other hand, the bulk diffusion time constant τD=d2/(4D), which is the time needed for charges to diffuse from bulk to diffuse layer, is still around ~ 10 s even above the critical uptake. As will be shown later, for the membrane bending actuators, the actuation is mainly determined by the diffusion charges that stored near the electrodes. Hence by reducing d, the membrane thickness, the bending action time can be reduced significantly.
Fig. 8.
double layer (a) time constant (b) thickness and (c) diffusion time constant as a function of EMI-Tf uptake when a voltage step from 0V to 100mV is applied.
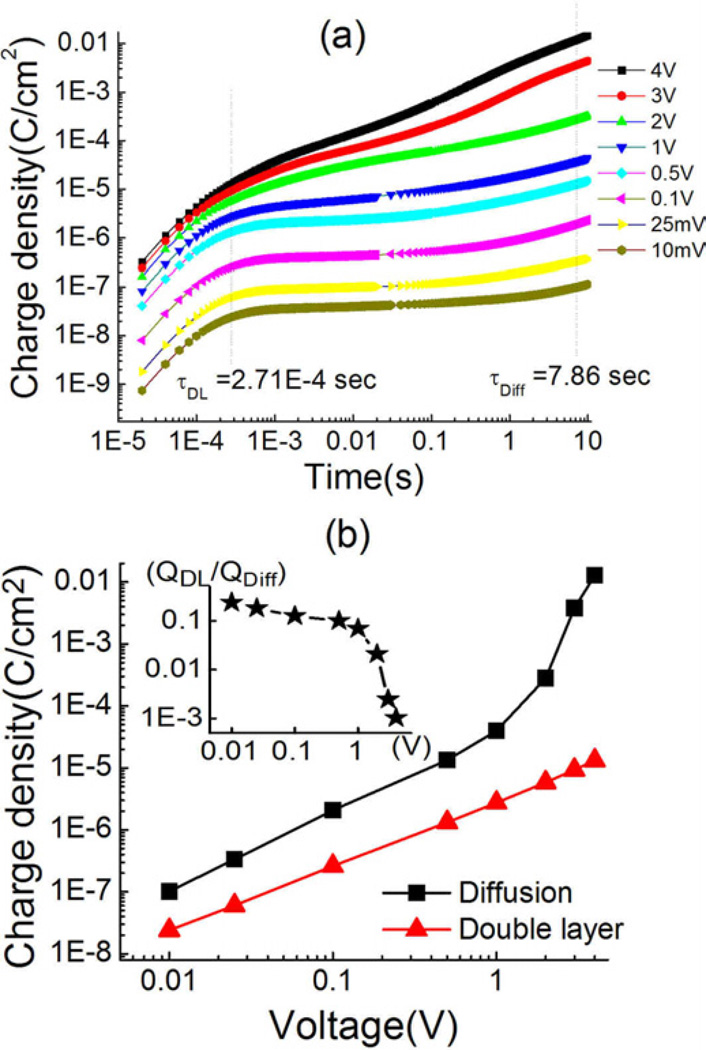
In figure 9(a), we present the charge stored vs. time in the Aquivion membrane which has 40 wt% of EMI-Tf uptake under different step voltages and shows a substantial bending actuation at > 3 volts (see figure 1(c)). From the data and using the τDL and τD determined at voltages below 1 V, we plot in figure 9(b) the change stored at the time τDL and τD as a function of applied voltage. The data shows that the charge stored at τDL increases linearly with applied voltage. In other words, the ratio between charge stored and V, which is the overall capacitance, does not change with applied step voltage, or the differential capacitance, defined as ΔQ/ΔV, for the electric double layer here does not change with applied voltage up to the highest voltage measured (4 volts). On the other hand, the charge stored at t = τD increases linearly with voltage up to 1 V. Beyond that, a much faster (non-linear) increases with applied voltage is observed, which causes a seemingly slowdown of the charge process in figure 9(a). This may be caused by the charge dissociation at high voltage, which leads to high leakage current.
Figure 9.
(a) charge storage with time (40wt% uptake) under different applied voltage step (10mV to 4V). (b) storage of double layer charge and diffusion charge under different applied voltage step. The inset graph is the charge ratio (QDL/QDiff) as a function of applied voltage step.
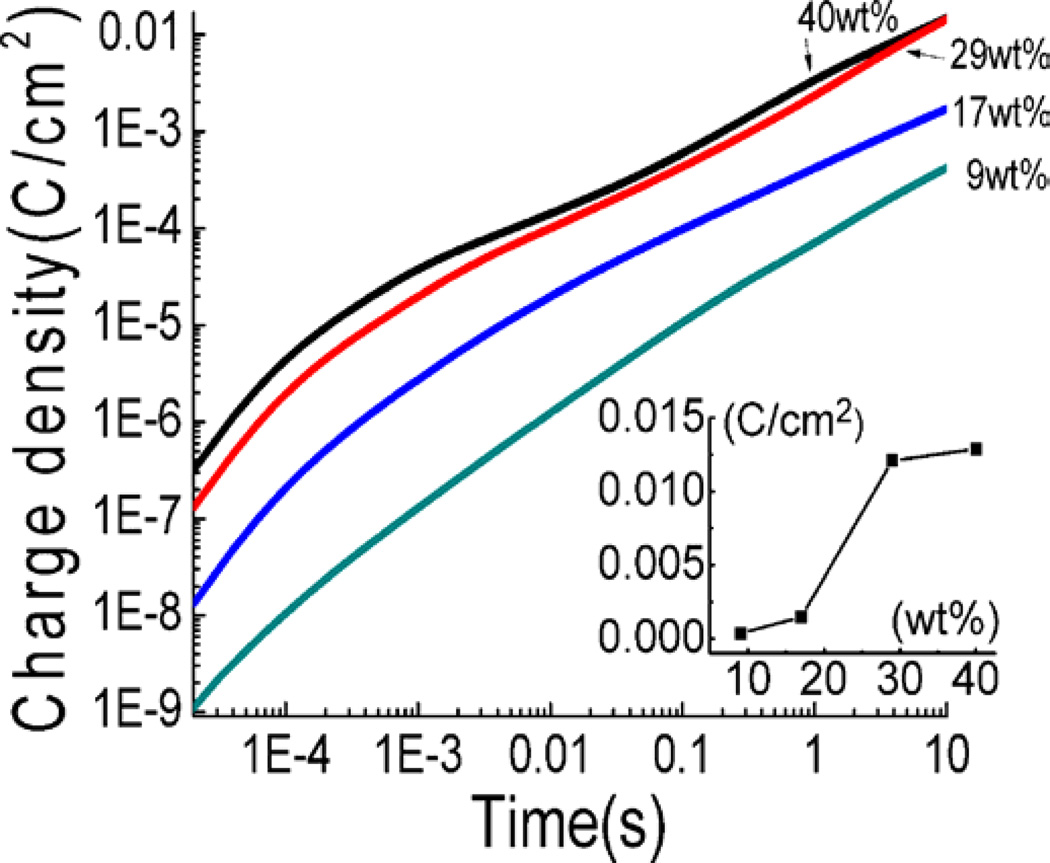
Figure 10 is the charge stored in the Aquivion membrane with different EMI-Tf uptake vs. time after the application of a 4 V step voltage (at t=0). The data shows that the stored charge increases with ILs uptake up to the critical uptake (29wt%). Above that, the rate of increase of the stored charge with ILs uptake becomes much smaller. This is also true for the diffusion time τD, which does not show much change with the ILs uptake above the critical uptake. Hence, above the critical uptake, further increase in the ILs uptake will not cause marked increase in the charging speed, charge storage, and, consequently, the bending actuation of the Aquivion membranes.
Figure 10.
charge storage as a function of time for Aquivion membranes with four different uptakes when a voltage step from 0 to 4V is applied. The inset shows the charge storage at 7.8s (diffusion time of 40wt% uptake) for different uptakes.
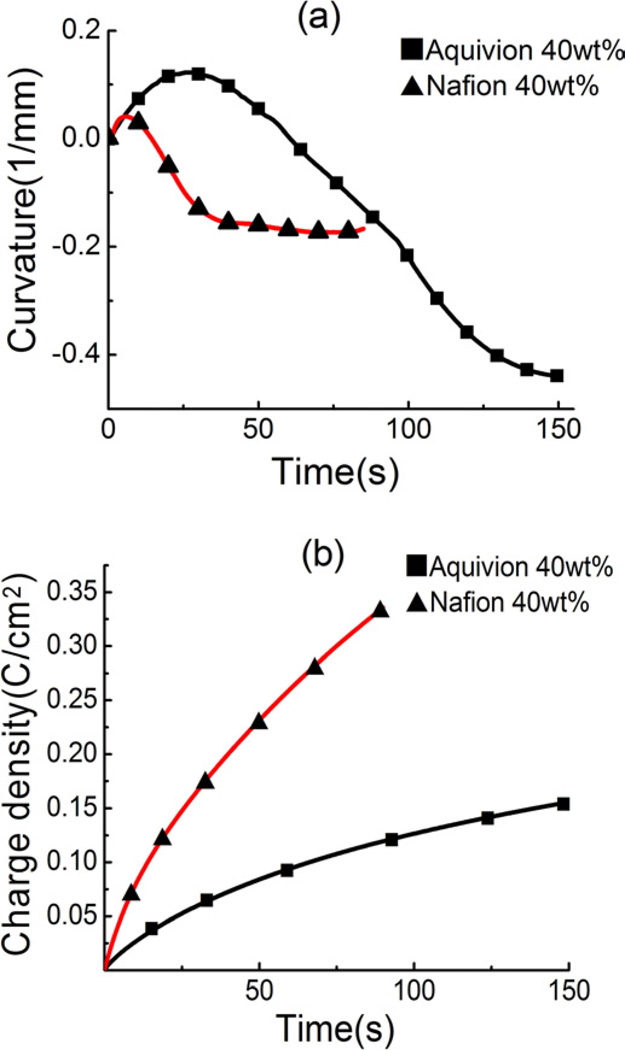
The electromechanical response of the Aquivion membrane was measured (see figure 2(c)) and compared with that of the Nafion membrane with the same 40 wt% of EMI-Tf uptake, far above the critical uptake in both ionomers. The measured conductivities of these two membranes are similar (Aquivion 0.11 mS/cm, Naifon 0.21 mS/cm). The slightly larger σ in Nafion membrane indicates an easier ion transport path resulting from less coupling between ions and polymer matrix. Presented in figure 11(a) is the curvature (1/R where R is the radius) of the bending membrane actuators vs. time after the application of a step voltage of 4 volts. The strain near the two electrodes (anode and cathode) is proportional to the curvature (1/R). [14] The data reveals several interesting features: (i) the initial slope of the curvatures of the two ionomers is nearly the same, indicating similar actuation speed of the two membranes; (ii) the maximum positive curvature of the Aquivion membrane is higher than that of the Nafion, indicating higher strain generated by the positive charges; (iii) the maximum negative curvature of the Aquivion is also much larger than that of Nafion (higher negative strain generated by negative charges in Aquivion). As shown in earlier publications, the presence of both cations and anions in the membrane may cause cancellation in bending actuation. [14] For example, in figure 2(b), if positive charges at the cathode and negative charges at the anode generate same value of strain at the same time, there will be no bending actuation. Due to different effective sizes of the positive charges and negative charges (cations and anions may form clusters rather than bare ions in the processes of ion transport and storage), the strains generated by the positive and negative charges are different, causing bending actuation as we observed here. The results in figure 11(a) indicate that the ions in Aquivion can generate much more bending strain, compared with that of Nafion membrane. Moreover, the transient strain response data also reveals that the transport time for positive charges and negative charges in the Aquivion is different (negative charges are slower), causing observed time dependent bending actuation. [14]
Figure 11.
(a) the curvature change with time (b) the accumulated charge/area of a 62um thick of Aquivion and Nafion membrane when a voltage step from 0V to 4V is applied.
Figure 11(b) shows the charge stored in the two membranes under the same electric conditions as in figure 11(a). Combining the data in the two figures indicates that the bending strain generated per charge is much large in Aquivion than that in Nafion. The difference in the strain generation is likely caused by the weaker elastic coupling of the excess ions to the membrane backbones in Nafion, due to longer flexible side chains, compared with that of Aquivion. As shown in Kreuer’s study [25], from the SAXS, the average width of hydrophilic channels of Aquivion is smaller and did not increase as much as that of Nafion with the increasing of water uptake. This implies that by reducing these soft side chain lengths, the excess ions in the ionomers will couple more effectively with the backbones to generate strain of the membranes.
4. Conclusion
In conclusion, a time domain approach is applied to study the charge dynamics in an ionomer membrane (Aquivion) swelled with ILs which, when combined with recently developed theoretical works, allows quantitative analysis of the membrane performance under real device working voltages (> 1 volts). A critical uptake (29wt%) of EMI-Tf in Aquivion membrane is observed, above which the charge mobility and mobile charge concentration increase markedly. It is also observed that the dissociation ratio of the swollen EMI-Tf remains at 0.5% for all IL uptakes. The experimental results reveal that the charge transport behavior does not change with applied voltage. Furthermore, it was found that the actuation of the ionic polymer membrane actuator is dominated by slow diffusion charges, which time constant scales with square of the membrane thickness. Therefore, by reducing the membrane thickness, the actuation speed can be increased. A comparison of the actuation strain shows that the short side chain Aquivion exhibits a better electromechanical coupling with ions than that of the long side chain Nafion, while the actuation speeds of the two membranes under same electrical stimulus are the same. Therefore, short side chain ionomers are preferred for ionic polymer actuator applications.
Acknowledgments
This material is based upon work supported in part by the U.S. Army Research Office under Grant No. W911NF-07-1-0452 Ionic Liquids in Electro-Active Devices (ILEAD) MURI, by NSF under Grant No. CMMI 0709333, and by NIH under Grant No. R01-EY018387-02. The authors thank Ralph Colby and Sheng Liu for many stimulating discussions.
Footnotes
Publisher's Disclaimer: This is a PDF file of an unedited manuscript that has been accepted for publication. As a service to our customers we are providing this early version of the manuscript. The manuscript will undergo copyediting, typesetting, and review of the resulting proof before it is published in its final citable form. Please note that during the production process errors may be discovered which could affect the content, and all legal disclaimers that apply to the journal pertain.
References
- 1.Lu W, Fadeev AG, Qi BH, Smela E, Mattes BR, Ding J, Spinks GM, Mazurkiewicz J, Zhou DZ, Wallace GG, MacFarlane DR, Forsyth SA, Forsyth M. Science. 2002;297(5583):983–987. doi: 10.1126/science.1072651. [DOI] [PubMed] [Google Scholar]
- 2.McEwen AB, Ngo HL, LeCompte K, Goldman JL. Journal of the Electrochemical Society. 1999;146(5):1687–1695. [Google Scholar]
- 3.Ue M, Takeda M, Toriumi A, Kominato A, Hagiwara R, Ito Y. Journal of the Electrochemical Society. 2003;150(4):A499–A502. [Google Scholar]
- 4.Fukumoto K, Yoshizawa M, Ohno H. Journal of the American Chemical Society. 2005;127(8):2398–2399. doi: 10.1021/ja043451i. [DOI] [PubMed] [Google Scholar]
- 5.Huddleston JG, Visser AE, Reichert WM, Willauer HD, Broker GA, Rogers RD. Green Chemistry. 2001;3(4):156–164. [Google Scholar]
- 6.Tokuda H, Hayamizu K, Ishii K, Abu Bin Hasan Susan M, Watanabe M. Journal of Physical Chemistry B. 2004;108(42):16593–16600. [Google Scholar]
- 7.Tokuda H, Hayamizu K, Ishii K, Susan MABH, Watanabe M. Journal of Physical Chemistry B. 2005;109(13):6103–6110. doi: 10.1021/jp044626d. [DOI] [PubMed] [Google Scholar]
- 8.Tokuda H, Ishii K, Susan MABH, Tsuzuki S, Hayamizu K, Watanabe M. Journal of Physical Chemistry B. 2006;110(6):2833–2839. doi: 10.1021/jp053396f. [DOI] [PubMed] [Google Scholar]
- 9.Galinski M, Lewandowski A, Stepniak I. Electrochimica Acta. 2006;51(26):5567–5580. [Google Scholar]
- 10.Ono S, Seki S, Hirahara R, Tominari Y, Takeya J. Applied Physics Letters. 2008;92(10) [Google Scholar]
- 11.Bar-Cohen Y, Zhang QM. Mrs Bulletin. 2008;33(3):173–181. [Google Scholar]
- 12.Kim D, Kim KJ, Tak Y. Applied Physics Letters. 2007;90(18) [Google Scholar]
- 13.Bennett MD, Leo DJ. Sensors and Actuators a-Physical. 2004;115(1):79–90. [Google Scholar]
- 14.Liu Y, Liu S, Lin JH, Wang D, Jain V, Montazami R, Heflin JR, Li J, Madsen L, Zhang QM. Applied Physics Letters. 2010;96(22) [Google Scholar]
- 15.Liu S, Liu WJ, Liu Y, Lin JH, Zhou X, Janik MJ, Colby RH, Zhang QM. Polymer International. 2010;59(3):321–328. [Google Scholar]
- 16.Akle BJ, Leo DJ, Hickner MA, McGrath JE. Journal of Materials Science. 2005;40(14):3715–3724. [Google Scholar]
- 17.Bennett MD, Leo DJ, Wilkes GL, Beyer FL, Pechar TW. Polymer. 2006;47(19):6782–6796. [Google Scholar]
- 18.Watanabe M, Shirai H, Hirai T. Journal of Applied Physics. 2001;90(12):6316–6320. [Google Scholar]
- 19.Watanabe M, Shirai H, Hirai T. Journal of Applied Physics. 2002;92(8):4631–4637. [Google Scholar]
- 20.Mauritz KA, Moore RB. Chemical Reviews. 2004;104(10):4535–4585. doi: 10.1021/cr0207123. [DOI] [PubMed] [Google Scholar]
- 21.Hsu WY, Gierke TD. Journal of Membrane Science. 1983;13(3):307–326. [Google Scholar]
- 22.Ghielmi A, Vaccarono P, Troglia C, Arcella V. Journal of Power Sources. 2005;145(2):108–115. [Google Scholar]
- 23.Jalani NH, Datta R. Journal of Membrane Science. 2005;264(1–2):167–175. [Google Scholar]
- 24.Halim J, Buchi FN, Haas O, Stamm M, Scherer GG. Electrochimica Acta. 1994;39(8–9):1303–1307. [Google Scholar]
- 25.Kreuer KD, Schuster M, Obliers B, Diat O, Traub U, Fuchs A, Klock U, Paddison SJ, Maier J. Journal of Power Sources. 2008;178(2):499–509. [Google Scholar]
- 26.Bazant MZ, Thornton K, Ajdari A. Physical Review E. 2004;70(2) doi: 10.1103/PhysRevE.70.021506. [DOI] [PubMed] [Google Scholar]
- 27.Kilic MS, Bazant MZ, Ajdari A. Physical Review E. 2007;75(2) doi: 10.1103/PhysRevE.75.021502. [DOI] [PubMed] [Google Scholar]
- 28.Beunis F, Strubbe F, Marescaux M, Beeckman J, Neyts K, Verschueren ARM. Physical Review E. 2008;78(1) doi: 10.1103/PhysRevE.78.011502. [DOI] [PubMed] [Google Scholar]
- 29.Strubbe F, Verschueren ARM, Schlangen LJM, Beunis F, Neyts K. Journal of Colloid and Interface Science. 2006;300(1):396–403. doi: 10.1016/j.jcis.2006.03.050. [DOI] [PubMed] [Google Scholar]
- 30.Beunis F, Strubbe F, Neyts K, Verschueren ARM. Applied Physics Letters. 2007;90(18) [Google Scholar]
- 31.Marescaux M, Beunis F, Strubbe F, Verboven B, Neyts K. Physical Review E. 2009;79(1) doi: 10.1103/PhysRevE.79.011502. [DOI] [PubMed] [Google Scholar]
- 32.Wakai C, Oleinikova A, Ott M, Weingartner H. Journal of Physical Chemistry B. 2005;109(36):17028–17030. doi: 10.1021/jp053946+. [DOI] [PubMed] [Google Scholar]
- 33.Serghei A, Tress M, Sangoro JR, Kremer F. Physical Review B. 2009;80(18) [Google Scholar]
- 34.Krause C, Sangoro JR, Iacob C, Kremer F. Journal of Physical Chemistry B. 2010;114(1):382–386. doi: 10.1021/jp908519u. [DOI] [PubMed] [Google Scholar]
- 35.Lockett V, Sedev R, Ralston J, Horne M, Rodopoulos T. Journal of Physical Chemistry C. 2008;112(19):7486–7495. [Google Scholar]
- 36.Klein RJ, Zhang SH, Dou S, Jones BH, Colby RH, Runt J. Journal of Chemical Physics. 2006;124(14) doi: 10.1063/1.2186638. [DOI] [PubMed] [Google Scholar]
- 37.Fragiadakis D, Dou S, Colby RH, Runt J. Journal of Chemical Physics. 2009;130(6) doi: 10.1063/1.3063659. [DOI] [PubMed] [Google Scholar]


