Abstract
Proton MR spectroscopy (1H-MRS) has been used for in vivo quantification of intracellular triglycerides within the sarcolemma. The purpose of this study was to assess whether breath-hold dual-echo in- and out-of-phase MRI at 3.0 T can quantify the fat content of the myocardium. Biases, including T1, , and noise, that confound the calculation of the fat fraction were carefully corrected. Thirty-four of 46 participants had both MRI and MRS data. The fat fractions from MRI showed a strong correlation with fat fractions from MRS (r = 0.78; P < 0.05). The mean myocardial fat fraction for all 34 subjects was 0.7 ± 0.5% (range: 0.11–3%) assessed with MRS and 1.04 ± 0.4% (range: 0.32–2.44%) assessed with in- and out-of-phase MRI (P < 0.05). Scanning times were less than 15 sec for Dixon imaging, plus an additional minute for the acquisition used for calculation, and 15-20 min for MRS. The average postprocessing time for MRS was 3 min and 5 min for MRI including measurement. We conclude that the dual echo method provides a rapid means to detect and quantifying myocardial fat content in vivo. Correction/adjustment for field inhomogeneity using three or more echoes seems crucial for the dual echo approach.
Keywords: cardiac steatosis, Dixon, spectroscopy, magnetic resonance imaging, water-fat separation
The concept of fatty myocardium has recently received attention because of its role in diabetic cardiomyopathy and obesity. Abundant storage of lipids, known as cardiac steatosis, produces lipotoxic substances that result in oxidative stress and apoptosis. Steatosis of the pancreas, liver, heart has been associated with end-organ dysfunction (insulin resistance/diabetes, nonalcoholic steatohepatitis, cleft ventricular dysfunction, respectively) (1–7). The storing of excess lipids in human cardiac myocytes is an early manifestation of type 2 diabetes.
Myocardial fat content has also been reported to be elevated within the myocardium of obese subjects. In the study conducted by Sharma et al. (8) on end-stage heart failure patients, increased triglyceride staining was coupled with increased free fatty acid delivery to myocytes of obese and type 2 diabetic subjects. Animal models have shown that cardiac abnormalities in diastolic and systolic function can be associated with excessive lipolysis and lipotoxic injury to myocytes. While some evidence from animal and human models links observations of cardiac lipotoxicity to diabetes mellitus, very little is known about the association between myocardial steatosis and its effect on cardiovascular disease end-points in high-risk persons, including diabetic and obese individuals.
Measurement of the ectopic fat deposition in the myocardium may provide a useful index of the degree of lipid overload. Several methods have been employed to quantify ectopic fat deposition in humans. Proton MR spectroscopy (1H-MRS) has proven to be reliable and reproducible in measuring myocardial triglyceride content in humans (9–12).
1H-MRS offers technological advantages because it can distinguish between the triglycerides stored in the adipose tissue cells (which contain very little water) and triglyceride droplets stored in the cytosol of parenchymal cells (13). However, 1H-MRS is relatively complex and time consuming. Acquisition during breath holding is difficult, and a sophisticated respiratory navigator gating is usually applied for motion correction. 1H-MRS also requires extensive postprocessing.
By exploiting the 3.5-ppm (parts per million) chemical shift difference between the main lipid peak and water, MRI may be very sensitive for fat detection. At 1.5 T, this relative chemical shift is −210 Hz (14,15) and is −420 Hz at 3.0 T. Most routine clinical MR water/fat imaging protocols exploit this difference in precession frequency to create “in-phase” (IP) and “out-of-phase” (OP) images by the Dixon method of varying echo times (TE) in consecutive echoes (16). At 3.0T, IP images are acquired at TEs that are multiples of 2.46 ms when the signals from water and fat add constructively. OP images are typically acquired at TE = 3.69 ms when the signals from water and fat destructively interfere (subtract). This method has been applied in the quantification of fatty infiltration of the liver (17,18). The sensitivity and specificity of IP- and OP imaging for the detection of steatosis is very high, approaching 100% (19,20).
Although MRI is sensitive to detect steatosis, no MR methods have been successful for its accurate quantification. Neither the work by Fishbein et al. (17) nor that by Hussain et al. (18) performed a rigorous correction method for relaxation (T1 and ) effects (21). The fat signal is amplified because of the shorter T1 value of fat compared to that of water. At 1.57, signal attenuation of the later echo due to decay leads to spurious negative values for the fat fraction when the IP image is acquired at a longer TE than the OP image. However, at 3.0T the resulting signal loss in the OP image will cause overestimation of the fat fraction. Moreover, in the situation of low fat content, noise is also a nonnegligible factor (22,23). Achieving accurate estimation of cardiac steatosis requires correction for confounding effects such as tissue biophysical properties (relaxation times) and imaging noise (24).
The purpose of this study was to investigate the accuracy of a two-point Dixon MR method for cardiac fat quantification after rigorous postprocessing to reduce weighting and noise bias. The two-point method in combination with spoiled gradient echo (SPGR) sequences and the magnitude-based postdata processing is commonly used in clinical applications due to its simplicity (18). The potential utility of the two-point Dixon technique was compared to results using 1H-MRS.
Theory
T1 Effects on the Quantification of Low-Fat Fraction
A commonly used MR method for fat detection and quantification is SPGR imaging using Dixon's two-point technique. This method assumes a simplified two-component system wherein the observed MR signal is the summation of two signal sources: fat protons and water protons. Images are acquired at two TEs, at which the signals from fat protons and water protons are presumed to be exactly IP and OP. When the TEs are short relative to the , the decay can be ignored. Under this assumption, all signal variation between the two TEs is due to the phase interference of the fat and water protons. The IP image is the sum of the water and fat signals, and the OP image is the difference between the water and fat signals. The water and fat amplitudes (Sw and Sf, respectively) can then be estimated by linear combinations of the IP and OP images:
| [1] |
Accordingly, the fat fraction is defined by Eq. 2 and can be estimated as:
| [2] |
| [3] |
Equation 4 characterizes the dependence of the SPGR signal on T1, , flip angle α, pulse repetition time (TR), TE, and the true density of water and/or fat (Mo).
| [4] |
Considering all of the factors that affect the SPGR signal intensity, naive calculation of the signal fraction measured with IP and OP will be confounded by the effects of T1 and and will not represent the true fat fraction η. For example, in hepatic fat quantification, the T1 of fat and water in the liver at 1.5 T is approximately 343 ms and 586 ms (25), respectively, so the fat magnetization will be less saturated than the water magnetization, leading to overestimation of the amount of fat fraction. If the T1 of both water and fat were known, the correct fat fraction could be calculated. However, the T1 of water and fat is usually not known and T1 mapping is not part of routine clinical assessment. Furthermore, the T1 mapping of cardiac triglycerides would be difficult to obtain due to its extremely low proton density.
One method for reducing the T1 dependence on the SPGR signal is to reduce the imaging flip angle (24). As the flip angle decreases, the T1 weighting of SPGR decreases. With reduced T1 weighting, the fat signal fraction approaches the true fat fraction. The degree of error depends on the T1 values of myocardial water and fat. The simulated fat fraction (ignoring effects) for a given TR = 10 ms, T1w = 1200 ms (26), and T1f = 800 ms at 3.0 T of various flip angles is demonstrated in Fig. 1. With greater difference between T1s of fat and water, more T1 bias is generated. T1f = 800 ms may be considered as worst-case scenario: for a true fat fraction of 1%, using 5° and 15° of flip angles would lead to 1.15% and 1.37% overestimation of the fat fractions, respectively. In practice, the cardiac experiments are electrocardiogram gated and the steady state pulses train is regularly interrupted. This provides an extra delay for signal recovery and thus further reduces the errors caused by differences in T1.
FIG. 1.
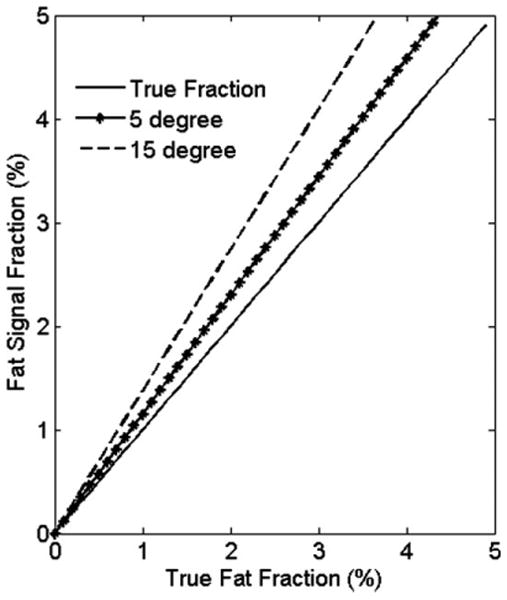
Simulated fat fractions of flip angles = 5° and 15° at true fat fraction <5% using T1f = 800 ms, and T1w = 1200 ms. Using lower flip angle reduces the T1 effects.
Effects on the Quantification of Low-Fat Fraction
In fast imaging techniques, TE is relatively short compared to the of the species (TE ∼2-4 ms and in the normal heart (27)). However, effects must be considered for low-fat fractions. At 3.0T, IP images are acquired at TEs that are multiples of 2.46 ms when signal from water and fat adds constructively. OP images are typically acquired at TE = 3.69 ms when signal from water and fat destructively interfere (subtract). At 3.0 T, the effect of relaxation (without considering T1 effects) on fat quantification is as follows, assuming a common for both fat and water and a TE difference between IP and OP of ΔTE,
| [5] |
Figure 2a plots the calculated fat signal fraction using Eq. 5, assuming for both water and fat versus true fat fraction. signal decay leads to 2.0% calculated fat fraction when the true value is zero.
FIG. 2.
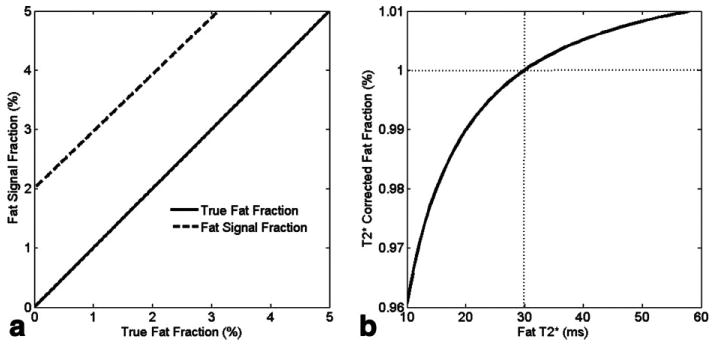
a: Fat signal fraction in the presence of effects with . The effects lead to 2% of bias at the true fat fraction = 0. b: Simulated fat fraction after correction (i.e., Eq. 5) with , and varies from 10 ms to 60 ms. The correction was performed using 30 ms to correct for both the water and fat signals. Assuming the true fat fraction is 1% (point as the dotted lines crossed, where corrected fat fraction is also 1%), the deviation from true value is less than 0.04% in the worst case.
To explore the effects on the fat fraction without the hypothesis of a single value, we performed a simulation with of water , and of fat , varying from 10 ms to 60 ms. Figure 2b plots the fat fraction after correction using Eq. 5, assuming and a true fat fraction of 1%. As shown, the calculated fat fraction is underestimated when and overestimated when . The error is less than 0.04% in the worst-case scenario . Hence, the single value was a reasonable assumption.
Field Inhomogeneity and Noise Bias on the Quantification of Low-Fat Fraction
Water-fat separation using the Dixon method relies on a phase difference that evolves as a result of chemical shift difference between water and fat. When the absolute signal intensities per pixel are used, the exact spectrometer frequency has no influence on the result, but a noise bias is created due the nonzero means of the magnitude of the noise signal. For an offset frequency Ψ the phases of the IP and OP signals are
| [6] |
| [7] |
where TEIP and TEOP are the TEs at IP and OP, respectively. The offset generated phase term is irrelevant if we use the absolute signals, which still have IP and OP fat signals that respectively add and subtract relative to the water signal. Assuming , , and , then
| [8] |
| [9] |
Hence, the IP and OP images are altered by the effect, not the field inhomogeneity. The fat and water images are reconstructed based on the magnitude images. The noise bias is introduced in the calculation of myocardial fat fraction because of the low fat signal in the fat images. We proposed to correct this bias by the “Magnitude discrimination” (24) method, in which the fat fraction is defined as η = 1 − [Sw/(Sf + Sw)], with the hypothesis that the water images have high signal to noise ratio (SNR).
Materials and Methods
Study Population
The institutional review board at our institution approved all experimental protocols, and participants provided written informed consent. Forty-six subjects were included in the study: 24 women, 22 men. Inclusion criteria included age ≥18 years, absence of acute or chronic disease, absence of personal history and symptoms of cardiac disease, normal physical examination and normal electrocardiogram.
Myocardial Imaging and Spectroscopy
All studies were performed on a 3.0-T MR scanner (Trio Tim; Siemens, Erlangen, Germany) with a six-channel anteriophased-array torso coil and corresponding posterior coil elements resulting in 12 channels of data. To measure left ventricular function, the heart was imaged in short-axis orientation, using a retrospectively gated fast gradient echo sequence. Imaging parameters were TR/TE: 7.3/3.4 ms, slice thickness: 8 mm, field of view: 360 mm, matrix: 256 × 192, temporal resolution: 78 ms. The short-axis view, along with the two- and four-chamber views, was used to position the spectroscopic volume (6- to 8-mL voxel) within the interventricular septum. Participants were instructed to hold their breath at end expiration during imaging and breathe normally during spectroscopy. Myocardial 1H-MRS spectra were obtained with electrocardiogram gating during diastole, with navigator gating using a single voxel point-resolved spectroscopy sequence, TR/TE = 1R-R/30 ms. The navigator was placed across the liver-lung interface. For reliable measurement of the low-fat signals with adequate receiver gain and also to prevent the distorted spectrum due to digitization noise, one spectrum (32 averages) was recorded with WET (water suppression enhanced through T1 effects) water suppression, with 1024 data points collected over a 1000-Hz spectral width. Another spectrum (four averages) was recorded with the water suppression RF pulse power set to zero. Outer volume suppression using saturation bands was applied to exclude the lipids from ventricular blood flow and epicardial triglycerides. Scan time was 15-20 min for 1H-MRS, including positioning, shimming, and acquisition (5-10 min).
The same four-chamber view used for 1H-MRS was used to acquire a dual-echo SPGR sequence with a bipolar gradient to achieve the desired TE times. Imaging parameters were TR/TE (In, Out) = 6.3/2.46, 3.69 ms, slice thickness: 8 mm, field of view: 360 mm, matrix: 192 × 144 with electrocardiogram-gated image acquisition in late diastole. The receiver bandwidth was set to 1130 Hz/pixel to reduce water-fat shifts in the readout direction to less than half a pixel. The flip angle was limited to 15° to reduce the effects of T1 weighting caused by the short TR and varying relaxation delays due to the electrocardiogram gating. The breath-hold acquisition time was less than 15 sec, depending on the heart rate. For estimation of , additional images were acquired at 10 different TEs (2.46-16 ms). Images of a water phantom were acquired using the same protocol with simulated heart rate of 60 beats per minute to test the pulse sequence, reconstruction, and correction algorithm of the two-point Dixon technique.
Analysis
Left ventricular volumes and mass were determined at end diastole from endocardial and epicardial contours traced on 12 adjacent short-axis slices using commercially available software (QMass, Medis, The Netherlands). Spectral analysis was done offline using Java-based MR user interface (jMRUI version 3.0 software; developed by A. van den Boogaart, Katholieke Universiteit Leuven, Leuven, Belgium) (28). After removal of residual water by subtraction of Hankel Lanczos singular values decomposition, estimated water signals were fitted by the advanced method for accurate robust and efficient spectral fitting (29), with the assumption of gaussian curves. Resonance frequency estimates of lipids at 0.9 and 1.3 ppm were summed to quantify myocardial triglycerides content and related to accurate robust and efficient spectral fitting estimated water in unsuppressed spectra (30). Myocardial fat fraction was calculated as the ratio of myocardial triglycerides to water content and reported as a percentage. Fat fraction was expressed as the mean ± standard deviation of multiple measurements.
Fat and water images were reconstructed from IP and OP magnitude images using Matlab (Mathworks, Natick, MA). Images were corrected for decay, assuming the same for both water and fat. Correction was based on a region of interest (ROI) in the septum, with one value estimated to account for the entire septum. estimation was based the best fit of the curve fitting. To reduce the noise bias, we applied a “magnitude discrimination” (24) method with fat fraction calculated as 1 − (Sw/IP), where Sw is the separated water signal and IP is the IP signal, after correction. Fat fraction was expressed as corrected values ± the variance from the bounds of estimation.
Baseline characteristics of the study population are reported by gender as means and standard deviation for continuous variables and frequencies and percentages for discrete variables. Unadjusted comparisons across gender were done by unpaired t tests assuming unequal variance (Welch correction) for continuous variables and with χ2-tests for dichotomous variables. The Pearson correlation coefficient (r) and linear regression analysis were used to examine the association between calculated fat fractions on the MR images and spectroscopy. Statistical significance was defined at the P < 0.05 level. Fat fractions for versus 1H-MRS methods were compared (paired t test) and expressed as mean ± standard deviation. Statistical analysis was performed using SPSS (Chicago, IL).
Results
Study subject characteristics by gender are summarized in Table 1. The mean age was 44 ± 16 years (20 to 78 years). No significant demographic differences were present between men and women. In seven subjects, 1H-MRS data could not be assessed because of technical problems, due to differences in myocardial position between the MR localization images and 1H-MRS acquisition resulting from irregular breathing. For IP and OP images, five of 46 studies were not analyzed because of data corruption due to motion, flow, and/or susceptibility artifacts. Both techniques were successfully completed in 34 subjects. The average postprocessing time for MRS was 3 min and 5 min for MRI, including measurement.
Table 1. Characteristics of the Study Population*.
| Women (n = 24) | Men (n = 22) | |
|---|---|---|
| Age (years) | 45 ± 17 | 44 ± 15 |
| Weight (kg) | 73 ± 19 | 84 ± 17 |
| BMI | 27 ± 7 | 28 ± 6 |
| Caucasian/African/Asian | 14/7/3 | 13/5/4 |
| Systolic BP (mmHg) | 125 ± 20 | 125 ± 16 |
| Diastolic BP (mmHg) | 71 ± 11 | 74 ± 11 |
| Heart rate (bpm) | 66 ± 6 | 64 ± 12 |
| Hypertension | 7 (29%) | 8 (36%) |
| Diabetes | 0 (0%) | 2 (9%) |
| Smoking | 1 (4%) | 4 (18%) |
| LVEDV (mL) | 123 ± 34 | 143 ± 31 |
| LVESV (mL) | 40 ± 19 | 51.7 ± 11 |
| LVEF (%) | 68 ± 5 | 63 ± 7 |
| LV mass (g) | 113 ± 32 | 151 ± 38 |
BMI, body mass index; BP, blood pressure; LV, left ventricle; EDV, end-diastolic volume; ESV, end-systolic volume; LVEF, left ventricular ejection fraction.
The water phantom exhibited a 0.9% and a 0.08% fat fraction before and after (measured 63 ms) and noise bias corrections, respectively. The fat fraction due to decay could be calculated using the simulation as demonstrated in Fig. 2a. Using , 0.97% fat fraction was estimated in the water phantom, which was similar to the measured 0.9% value. The residual amount after correction may be due to slight inaccuracies in and noise correction; however, the effectiveness of the correction was demonstrated. values estimated for 41 subjects revealed mean (range: 18–55 ms). Figure 3 shows a representative spectrum and the experimental setup for the measurement of myocardial triglyceride content. An example of water and fat fraction images, as well as the water and fat spectra with low fat content, is given in Fig. 4. The mean measured fat fractions for 1H-MRS and MRI were 0.49 ± 0.08% and 0.43 ± 0.1, respectively. Figure 5 shows a subject who exhibited high myocardial fat content. The measured fat fractions were 1.32 ± 0.1% versus 1.91 ± 0.12% for 1H-MRS and MRI, respectively.
FIG. 3.
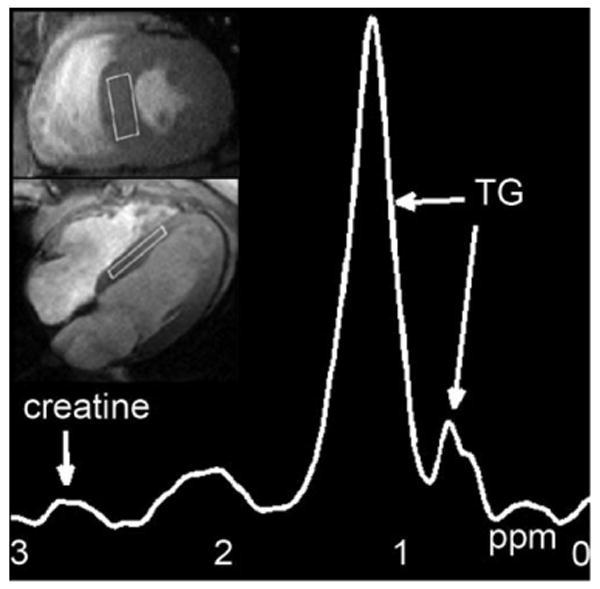
Representative 1H-MRS water-suppressed fat spectrum on a participant with the selected volume superimposed on four-chamber and short-axis cine MR images; TG: triglyceride peaks at 0.9 and 1.3 ppm.
FIG. 4.

Water and fat fraction images with low fat contents and the corresponding water and fat spectra (insets, y-axis in arbitrary unit). The mean fat fractions measured by 1H MRS and MRI are shown to the right (bar graphs).
FIG. 5.
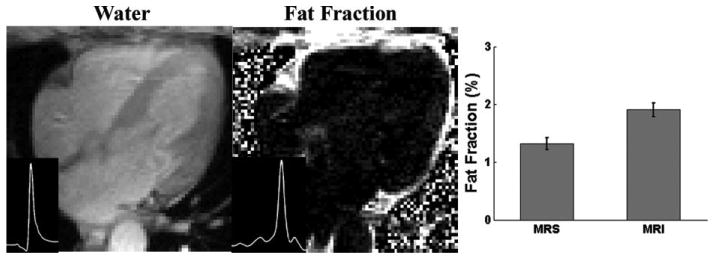
Water and fat fraction images and the corresponding water and fat spectra (insets, y-axis in arbitrary units) of two other participants with high fat contents. The bar graphs demonstrate the mean fat fractions measured by 1H MRS and MRI.
The myocardial fat fractions from MRI show a strong correlation (r = 0.68, P < 0.05) with 1H-MRS (Fig. 6a). The mean percentage of myocardial fat for subjects with both 1H-MRS and MRI was 0.7 ± 0.5% (range: 0.11-3%) and 1.04 ± 0.4% (range: 0.32-2.44%), respectively (P = 0.002, Fig. 6b).
FIG. 6.
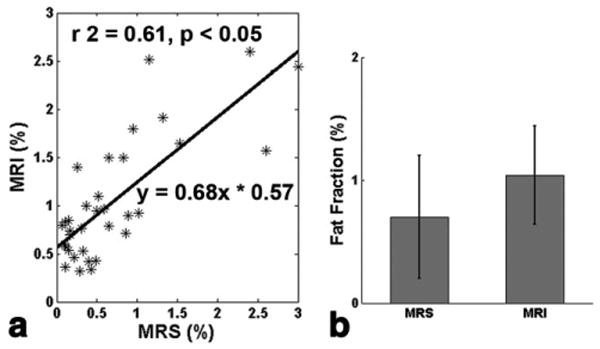
Correlation between 1H-MRS and two-point Dixon MR methods (a), and comparison of the averages (b) of myocardial fat fractions in the 34 participants with successful MRS and MRI data analyzed (r2 = 0.61, Pearson correlation r = 0.68, P = 0.002; error bar is the standard deviation).
Discussion
The results of this study demonstrate that IP- and OP MRI compares favorably to the 1H-MRS technique for measurement of myocardial fat content, particularly in terms of time efficiency. 1H-MRS is technically challenging to perform and is thus less likely to be applied than MRI for clinical patients due to long acquisition times for 1H-MRS. In this study, 85% and 89% of subjects had successful acquisitions using 1H-MRS and MRI, respectively. The success rate of 1H-MRS in this study was higher for our relatively healthy participants than in the study reported by McGavock et al. (9). In their study using 1H-MRS to evaluate patients with diabetes mellitus, 134 of 177 (76%) patients were included in the final analysis. The difficulties of analysis were mainly from the cardiac and respiratory motion, similar to what we have observed.
The dual echo technique showed higher estimates of fat fraction compared to the 1H-MRS technique. Some discrepancy is to be expected as the lipid peaks quantified by 1H-MRS (intracellular triglycerides at 0.9 and 1.3 ppm) differ from fat (both intra- and extracellular) included in the fat fractions with the Dixon method. Furthermore, the olefinic protons have a chemical shift of 5.35 ppm, which is close to that of water (4.65 ppm) and could contribute to water images in chemical shift imaging methods but would be excluded in 1H-MRS. Improved fat-water separation is achievable with a more accurate multipeak modeling of fat (32). However, those techniques would require a sophisticated reconstruction algorithm, and the effectiveness to quantify low fat fraction is still questionable. In skeletal muscle, the quantification of the lipid signal depends on the orientation of the muscle fibers in relation to the static magnetic field (33,34). Although fiber orientation in the myocardium is less uniform, it cannot be ruled out that these fiber orientation–related changes also occur in 1H-MRS of intracellular myocardial fat.
For accurate determination of fat fraction with MRI, four major issues should be addressed: the effect of tissue relaxation (T1, ), image noise, and off resonance effects. T1 bias is another source that leads to the higher fat fraction by MRI than 1H-MRS. However, the bias can only be eliminated if accurate T1 values are known or long TR values are used. In our initial experiments, Dixon images with flip angles of 5°, 10°, and 15° were compared. We have found that a flip angle of 15° provided the highest-quality images. Use of a lower flip angle might be possible in a more SNR-efficient sequence such as steady-state free precision or if multipoint fat-water separation technique is employed. Compared to T1, is a more important factor for the accurate estimation at low fat fractions. The average cardiac tissue value measured in our study was 27.6 ± 6.9 ms, which is shorter than that measured on the 20 healthy subjects at 1.5 T by Pepe et al. (27) but is closer to the results by Reeder et al. (35). If the of fat is shorter than the measured tissue , this will lead to a slight underestimation of the fat fraction.
Off-resonance effects necessitate the use of magnitude signals rather than complex signals, although phase foldover may occur when the off-resonance-induced phase shifts are large. In tissues with relatively low fat content such as the myocardium, the ambiguity of foldover effects is far less than in tissue with high fat content. Off-resonance effects can be corrected by a phase-correction algorithm (36).
Methods for separating the water and fat components in MRI based on the Dixon type acquisition have been under intensive investigation for a number of years. In a recent study by Kim et al. (37), the performance of the two-point method with conventional magnitude reconstruction and a three-point chemical shift–based method known as iterative decomposition of water and fat with echo asymmetry and least squares estimation (38–42) was compared for measurement of hepatic fat fraction. In that study, three-point iterative decomposition of water and fat with echo asymmetry and least squares estimation demonstrated higher correlation than the two-point method with fat fraction measured by 1H-MRS. Another method, based on a different computational requirement known as variable projection, was proposed by Hernando et al. (43). Variable projection accounts for both the field inhomogeneity and relaxation effects to decompose water and fat signal. This method is very robust and can be used in low-SNR conditions, which is crucial in the quantification of myocardial triglycerides. Kellman et al. (44) successfully generalized this method for the detection of fibrofatty infiltration in the myocardium at 1.5 T. With their four-echo approach, fatty infiltration was clearly shown in patients with a variety of heart diseases.
In the current study, the MRI and MRS data did not correlate with a slope of unity. Additional simulations (Appendix) demonstrate that discrepancies are primarily due to a limitation of the spectral model that is implicitly assumed for the fat signal. Other more elaborate spectroscopic models than can be employed in the variable projection or multipoint iterative decomposition of water and fat with echo asymmetry and least squares estimation may yield a correspondence between MRI and MRS closer to unity. For clinical applications, linearity is highly desirable.
In conclusion, we have shown high correlation for myocardial fat content measured by the two-point Dixon method compared to 1H-MRS. Unlike the 1H-MRS, MRI can be acquired in a breath hold, without the complexity of manual shimming, voxel positioning, and navigator echoes. A disadvantage of the two-point Dixon method is the requirement of an additional breath hold, with the potential for misregistration correction and discrepancy with 1H-MRS for very low fat values. If only higher fat values need to be determined, the limitations of the Dixon approach may be less clinically relevant. Further evaluation of myocardial fat content in comparison to myocardial function may help determine the level of accuracy required for determination of myocardial fat fraction.
Acknowledgments
The authors thank Steven M. Shea, Ph.D. (Siemens Corporate Research), for help with experiments on the Siemens scanner.
Appendix
Spectral Modeling of Fat-Water Spectra and Two-Point Dixon Methods
Spectroscopic modeling for fat-water spectra and two-point Dixon MRI was performed to compare the two methods. Table 2 displays the frequencies, relative fat and water peak amplitudes, and the line widths of the corresponding peaks. The simulated Lorentzian line spectrum with 30% of true fat fraction is demonstrated in Fig. 7a. The true fat fraction was defined as the ratio of fat signals from all fat peaks divided by the summation of total water and fat signals.
Table 2. Spectroscopic Model for Fat-Water Spectra.
| Frequencies | +94 | 0 | −46 | −233 | −317 | −420 | −472 |
|---|---|---|---|---|---|---|---|
| Amplitudes fat | 0.1 | 0 | 0.04 | 0.03 | 0.15 | 0.62 | 0.06 |
| Amplitudes water | – | 1 | – | – | – | – | – |
| Line widths | 23 | 18 | 50 | 23 | 50 | 23 | 23 |
FIG. 7.
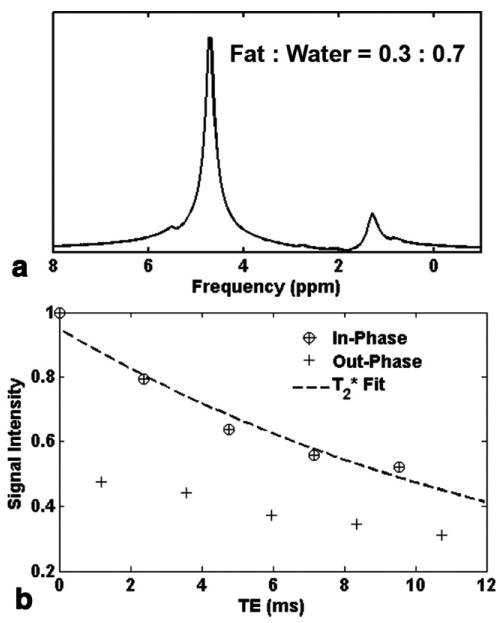
Simulated fat-water spectrum (a) and IP and OP MRI data for correction (1000 trials, SNR = 120) (b). Both simulations were generated using parameters as shown in Table 2, and 30% of true fat fraction.
Water and fat peak amplitudes were mixed at variable ratios to simulate different fat fractions and normal distribution random numbers were added to each data point to simulate noise in an imaging pixel at the appropriate SNR level. A free induction decay signal of 10 echoes was generated at 1194-μs intervals to provide simulated IP and OP MRI data and data for correction. Figure 7b shows the normalized signal intensity of 10 echoes and fitted from the noisy IP simulated data (SNR = 120 with 1000 trials). Applying this spectroscopic modeling (Fig. 7a) and using the second pair of IP and OP signals (Fig. 7b), we calculated the fat fraction with correction at three different SNR levels. Note that in the actual experiments, the input for data correction is derived from multiple points in an ROI, and here it was done before averaging the multiple noise instances. The MRS fat fraction was calculated from the (noise free) input amplitudes of water and the last two fat peaks (at frequencies −420 and −472). Figure 8a-c exhibits the simulated results at SNR = 120, 60, and 30 (1000 trials each) in comparison with those estimated with MRS. The overestimation of fat fraction at less than 1% level by the imaging method could be corrected by a “magnitude discrimination” algorithm, as shown in Fig. 8d.
FIG. 8.
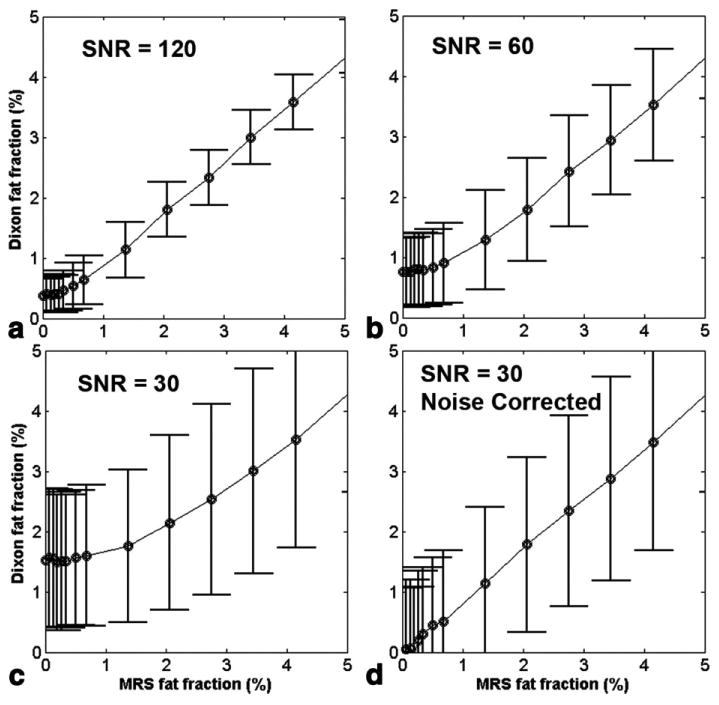
Simulated fat fractions using spectroscopic modeling (Table 2) and two-point Dixon methods (with correction) at three different SNR levels (a-c) in comparison with those estimated with MRS. (d) Noise bias could be corrected by “magnitude discrimination” methods.
Imaging using two-point Dixon fat-water separation underestimated fat fractions when fat fractions were greater than 1%, as shown in our in vivo experiments from Fig. 6a. This observation was consistent with the results from spectral modeling (Fig. 8), where fat fraction by Dixon method reached only 94% of the MRS estimated value. To explore the sources of this discrepancy, a simplified spectroscopic model with single peak for both water and fat of the same line width (23 Hz) was examined. Figure 9a depicts the spectrum and the corresponding IP and OP signal response of 10 echoes (Fig. 9b, SNR = 120, 1000 trials). Using the same simulation but different model, the fat fractions were much closer to those predicted by MRS, as shown in Fig. 9c. We have also calculated fat fractions based on estimated from OP signals (five points) or both IP and OP signals (10 points). For example, the estimated by OP signals in Fig. 9b (30% of MRS fat fraction) was 14.3 ms, which was slightly longer than that of IP (13.7 ms), and was 10.64 ms using all IP and OP signals. The fat fractions were 30.005%, 29.983%, and 29.430% using IP, OP, and both signals for the correction of , respectively. This represents a worst-case scenario since lower fat fractions (such as found in myocardial steatosis) have a smaller difference between the signal intensities between IP and OP echoes and thus less difference between the values determined from subsets of these echoes.
FIG. 9.
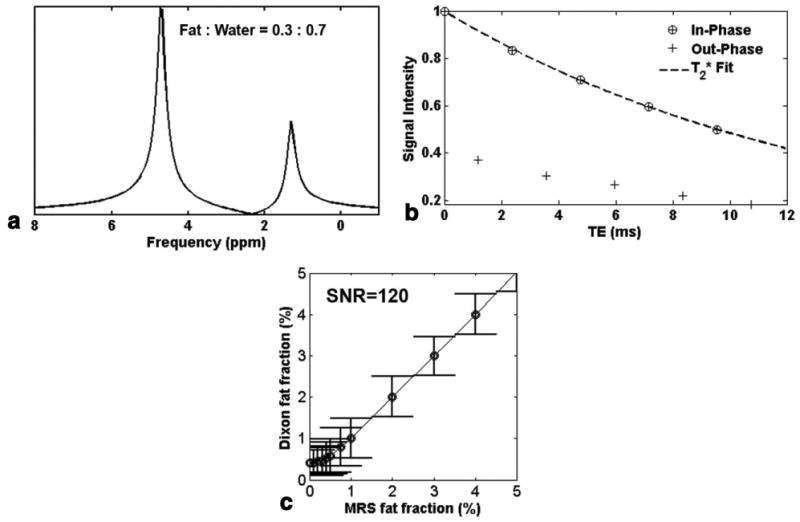
a: Simplified spectroscopic model with single peak for both water and fat with 30% of true fat fraction, and the corresponding IP and OP signal response (b) at SNR = 120, 1000 trials. c: Compared to Fig. 8a, fat fraction calculated by two-point Dixon methods (with correction) using the simplified model resulted in the same value as estimated by MRS (except at MRS fat fraction <1% due to the noise bias).
References
- 1.Adams LA, Lymp JF, St Sauver J, Sanderson SO, Lindor KD, Feldstein A, Angulo P. The natural history of nonalcoholic fatty liver disease: a population-based cohort study. Gastroenterology. 2005;129:113–121. doi: 10.1053/j.gastro.2005.04.014. [DOI] [PubMed] [Google Scholar]
- 2.Chiu HC, Kovacs A, Ford DA, Hsu FF, Garcia R, Herrero P, Saffitz JE, Schaffer JE. A novel mouse model of lipotoxic cardiomyopathy. J Clin Invest. 2001;107:813–822. doi: 10.1172/JCI10947. [DOI] [PMC free article] [PubMed] [Google Scholar]
- 3.Hirose H, Lee YH, Inman LR, Nagasawa Y, Johnson JH, Unger RH. Defective fatty acid-mediated beta-cell compensation in Zucker diabetic fatty rats: pathogenic implications for obesity-dependent diabetes. J Biol Chem. 1996;271:5633–5637. doi: 10.1074/jbc.271.10.5633. [DOI] [PubMed] [Google Scholar]
- 4.McCullough AJ. Pathophysiology of nonalcoholic steatohepatitis. J Clin Gastroenterol. 2006;40(suppl 1):S17–29. doi: 10.1097/01.mcg.0000168645.86658.22. [DOI] [PubMed] [Google Scholar]
- 5.McGavock JM, Victor RG, Unger RH, Szczepaniak LS. Adiposity of the heart, revisited. Ann Intern Med. 2006;144:517–524. doi: 10.7326/0003-4819-144-7-200604040-00011. [DOI] [PubMed] [Google Scholar]
- 6.Milburn JL, Jr, Hirose H, Lee YH, Nagasawa Y, Ogawa A, Ohneda M, BeltrandelRio H, Newgard CB, Johnson JH, Unger RH. Pancreatic beta-cells in obesity: evidence for induction of functional, morphologic, and metabolic abnormalities by increased long chain fatty acids. J Biol Chem. 1995;270:1295–1299. doi: 10.1074/jbc.270.3.1295. [DOI] [PubMed] [Google Scholar]
- 7.Rijzewijk LJ, van der Meer RW, Smit JW, Diamant M, Bax JJ, Hammer S, Romijn JA, de Roos A, Lamb HJ. Myocardial steatosis is an independent predictor of diastolic dysfunction in type 2 diabetes mellitus. J Am Coll Cardiol. 2008;52:1793–1799. doi: 10.1016/j.jacc.2008.07.062. [DOI] [PubMed] [Google Scholar]
- 8.Sharma S, Adrogue JV, Golfman L, Uray I, Lemm J, Youker K, Noon GP, Frazier OH, Taegtmeyer H. Intramyocardial lipid accumulation in the failing human heart resembles the lipotoxic rat heart. FASEB J. 2004;18:1692–1700. doi: 10.1096/fj.04-2263com. [DOI] [PubMed] [Google Scholar]
- 9.McGavock JM, Lingvay I, Zib I, Tillery T, Salas N, Unger R, Levine BD, Raskin P, Victor RG, Szczepaniak LS. Cardiac steatosis in diabetes mellitus: a 1H-magnetic resonance spectroscopy study. Circulation. 2007;116:1170–1175. doi: 10.1161/CIRCULATIONAHA.106.645614. [DOI] [PubMed] [Google Scholar]
- 10.Reingold JS, McGavock JM, Kaka S, Tillery T, Victor RG, Szczepaniak LS. Determination of triglyceride in the human myocardium by magnetic resonance spectroscopy: reproducibility and sensitivity of the method. Am J Physiol Endocrinol Metab. 2005;289:E935–939. doi: 10.1152/ajpendo.00095.2005. [DOI] [PubMed] [Google Scholar]
- 11.Szczepaniak LS, Dobbins RL, Metzger GJ, Sartoni-D'Ambrosia G, Arbique D, Vongpatanasin W, Unger R, Victor RG. Myocardial tri-glycerides and systolic function in humans: in vivo evaluation by localized proton spectroscopy and cardiac imaging. Magn Reson Med. 2003;49:417–423. doi: 10.1002/mrm.10372. [DOI] [PubMed] [Google Scholar]
- 12.van der Meer RW, Rijzewijk LJ, Diamant M, Hammer S, Schar M, Bax JJ, Smit JW, Romijn JA, de Roos A, Lamb HJ. The ageing male heart: myocardial triglyceride content as independent predictor of diastolic function. Eur Heart J. 2008;29:1516–1522. doi: 10.1093/eurheartj/ehn207. [DOI] [PubMed] [Google Scholar]
- 13.Szczepaniak LS, Babcock EE, Schick F, Dobbins RL, Garg A, Burns DK, McGarry JD, Stein DT. Measurement of intracellular triglyceride stores by H spectroscopy: validation in vivo. Am J Physiol. 1999;276(5 pt 1):E977–989. doi: 10.1152/ajpendo.1999.276.5.E977. [DOI] [PubMed] [Google Scholar]
- 14.Dixon WT. Simple proton spectroscopic imaging. Radiology. 1984;153:189–194. doi: 10.1148/radiology.153.1.6089263. [DOI] [PubMed] [Google Scholar]
- 15.Edelman RR, Hahn PF, Buxton R, Wittenberg J, Ferrucci JT, Saini S, Brady TJ. Rapid MR imaging with suspended respiration: clinical application in the liver. Radiology. 1986;161:125–131. doi: 10.1148/radiology.161.1.3763854. [DOI] [PubMed] [Google Scholar]
- 16.Mitchell DG, Kim I, Chang TS, Vinitski S, Consigny PM, Saponaro SA, Ehrlich SM, Rifkin MD, Rubin R. Fatty liver. Chemical shift phase-difference and suppression magnetic resonance imaging techniques in animals, phantoms, and humans. Invest Radiol. 1991;26:1041–1052. [PubMed] [Google Scholar]
- 17.Fishbein MH, Gardner KG, Potter CJ, Schmalbrock P, Smith MA. Introduction of fast MR imaging in the assessment of hepatic steatosis. Magn Reson Imaging. 1997;15:287–293. doi: 10.1016/s0730-725x(96)00224-x. [DOI] [PubMed] [Google Scholar]
- 18.Hussain HK, Chenevert TL, Londy FJ, Gulani V, Swanson SD, McKenna BJ, Appelman HD, Adusumilli S, Greenson JK, Conjeevaram HS. Hepatic fat fraction: MR imaging for quantitative measurement and display—early experience. Radiology. 2005;237:1048–1055. doi: 10.1148/radiol.2373041639. [DOI] [PubMed] [Google Scholar]
- 19.Martin J, Sentis M, Puig J, Rue M, Falco J, Donoso L, Zidan A. Comparison of in-phase and opposed-phase GRE and conventional SE MR pulse sequences in T1-weighted imaging of liver lesions. J Comput Assist Tomogr. 1996;20:890–897. doi: 10.1097/00004728-199611000-00005. [DOI] [PubMed] [Google Scholar]
- 20.Siegelman ES, Rosen MA. Imaging of hepatic steatosis. Seminin Liver Dis. 2001;21:71–80. doi: 10.1055/s-2001-12930. [DOI] [PubMed] [Google Scholar]
- 21.Bydder M, Yokoo T, Hamilton G, Middleton MS, Chavez AD, Schwimmer JB, Lavine JE, Sirlin CB. Relaxation effects in the quantification of fat using gradient echo imaging. Magn Reson Imaging. 2008;26:347–359. doi: 10.1016/j.mri.2007.08.012. [DOI] [PMC free article] [PubMed] [Google Scholar]
- 22.Bydder M, Du J. Noise reduction in multiple-echo data sets using singular value decomposition. Magn Reson Imaging. 2006;24:849–856. doi: 10.1016/j.mri.2006.03.006. [DOI] [PubMed] [Google Scholar]
- 23.Kellman P, McVeigh ER. Image reconstruction in SNR units: a general method for SNR measurement. Magn Reson Med. 2005;54:1439–1447. doi: 10.1002/mrm.20713. [DOI] [PMC free article] [PubMed] [Google Scholar]
- 24.Liu CY, McKenzie CA, Yu H, Brittain JH, Reeder SB. Fat quantification with IDEAL gradient echo imaging: correction of bias from T(1) and noise. Magn Reson Med. 2007;58:354–364. doi: 10.1002/mrm.21301. [DOI] [PubMed] [Google Scholar]
- 25.de Bazelaire CM, Duhamel GD, Rofsky NM, Alsop DC. MR imaging relaxation times of abdominal and pelvic tissues measured in vivo at 3.0 T: preliminary results. Radiology. 2004;230:652–659. doi: 10.1148/radiol.2303021331. [DOI] [PubMed] [Google Scholar]
- 26.Sharma P, Socolow J, Patel S, Pettigrew RI, Oshinski JN. Effect of Gd-DTPA-BMA on blood and myocardial T1 at 1.5T and 3T in humans. J Magn Reson Imaging. 2006;23:323–330. doi: 10.1002/jmri.20504. [DOI] [PMC free article] [PubMed] [Google Scholar]
- 27.Pepe A, Positano V, Santarelli MF, Sorrentino F, Cracolici E, De Marchi D, Maggio A, Midiri M, Landini L, Lombardi M. Multislice multiecho cardiovascular magnetic resonance for detection of the heterogeneous distribution of myocardial iron overload. J Magn Reson Imaging. 2006;23:662–668. doi: 10.1002/jmri.20566. [DOI] [PubMed] [Google Scholar]
- 28.Naressi A, Couturier C, Devos JM, Janssen M, Mangeat C, de Beer R, Graveron-Demilly D. Java-based graphical user interface for the MRUI quantitation package. MAGMA. 2001;12:141–152. doi: 10.1007/BF02668096. [DOI] [PubMed] [Google Scholar]
- 29.Vanhamme L, van den Boogaart A, Van Huffel S. Improved method for accurate and efficient quantification of MRS data with use of prior knowledge. J Magn Reson. 1997;129:35–43. doi: 10.1006/jmre.1997.1244. [DOI] [PubMed] [Google Scholar]
- 30.van der Meer RW, Hammer S, Smit JW, Frolich M, Bax JJ, Diamant M, Rijzewijk LJ, de Roos A, Romijn JA, Lamb HJ. Short-term caloric restriction induces accumulation of myocardial triglycerides and decreases left ventricular diastolic function in healthy subjects. Diabetes. 2007;56:2849–2853. doi: 10.2337/db07-0768. [DOI] [PubMed] [Google Scholar]
- 31.Machann J, Thamer C, Schnoedt B, Stefan N, Haring HU, Claussen CD, Fritsche A, Schick F. Hepatic lipid accumulation in healthy subjects: a comparative study using spectral fat-selective MRI and volume-localized 1H-MR spectroscopy. Magn Reson Med. 2006;55:913–917. doi: 10.1002/mrm.20825. [DOI] [PubMed] [Google Scholar]
- 32.Yu H, Shimakawa A, McKenzie CA, Brodsky E, Brittain JH, Reeder SB. Multiecho water-fat separation and simultaneous R2* estimation with multifrequency fat spectrum modeling. Magn Reson Med. 2008;60:1122–1134. doi: 10.1002/mrm.21737. [DOI] [PMC free article] [PubMed] [Google Scholar]
- 33.Boesch C, Slotboom J, Hoppeler H, Kreis R. In vivo determination of intra-myocellular lipids in human muscle by means of localized 1H-MR-spectroscopy. Magn Reson Med. 1997;37:484–493. doi: 10.1002/mrm.1910370403. [DOI] [PubMed] [Google Scholar]
- 34.Schick F, Eismann B, Jung WI, Bongers H, Bunse M, Lutz O. Comparison of localized proton NMR signals of skeletal muscle and fat tissue in vivo: two lipid compartments in muscle tissue. Magn Reson Med. 1993;29:158–167. doi: 10.1002/mrm.1910290203. [DOI] [PubMed] [Google Scholar]
- 35.Reeder SB, Faranesh AZ, Boxerman JL, McVeigh ER. In vivo measurement of T*2 and field inhomogeneity maps in the human heart at 1.5 T. Magn Reson Med. 1998;39:988–998. doi: 10.1002/mrm.1910390617. [DOI] [PMC free article] [PubMed] [Google Scholar]
- 36.Ma J. Breath-hold water and fat imaging using a dual-echo two-point Dixon technique with an efficient and robust phase-correction algorithm. Magn Reson Med. 2004;52:415–419. doi: 10.1002/mrm.20146. [DOI] [PubMed] [Google Scholar]
- 37.Kim H, Taksali SE, Dufour S, Befroy D, Goodman TR, Petersen KF, Shulman GI, Caprio S, Constable RT. Comparative MR study of hepatic fat quantification using single-voxel proton spectroscopy, two-point Dixon and three-point IDEAL. Magn Reson Med. 2008;59:521–527. doi: 10.1002/mrm.21561. [DOI] [PMC free article] [PubMed] [Google Scholar]
- 38.Reeder SB, Hargreaves BA, Yu H, Brittain JH. Homodyne reconstruction and IDEAL water-fat decomposition. Magn Reson Med. 2005;54:586–593. doi: 10.1002/mrm.20586. [DOI] [PubMed] [Google Scholar]
- 39.Reeder SB, Markl M, Yu H, Hellinger JC, Herfkens RJ, Pelc NJ. Cardiac CINE imaging with IDEAL water-fat separation and steady-state free precession. J Magn Reson Imaging. 2005;22:44–52. doi: 10.1002/jmri.20327. [DOI] [PubMed] [Google Scholar]
- 40.Reeder SB, Pineda AR, Wen Z, Shimakawa A, Yu H, Brittain JH, Gold GE, Beaulieu CH, Pelc NJ. Iterative decomposition of water and fat with echo asymmetry and least-squares estimation (IDEAL): application with fast spin-echo imaging. Magn Reson Med. 2005;54:636–644. doi: 10.1002/mrm.20624. [DOI] [PubMed] [Google Scholar]
- 41.Reeder SB, Wen Z, Yu H, Pineda AR, Gold GE, Markl M, Pelc NJ. Multicoil Dixon chemical species separation with an iterative least-squares estimation method. Magn Reson Med. 2004;51:35–45. doi: 10.1002/mrm.10675. [DOI] [PubMed] [Google Scholar]
- 42.Reeder SB, Yu H, Johnson JW, Shimakawa A, Brittain JH, Pelc NJ, Beaulieu CF, Gold GE. T1- and T2-weighted fast spin-echo imaging of the brachial plexus and cervical spine with IDEAL water-fat separation. J Magn Reson Imaging. 2006;24:825–832. doi: 10.1002/jmri.20721. [DOI] [PubMed] [Google Scholar]
- 43.Hernando D, Haldar JP, Sutton BP, Ma J, Kellman P, Liang ZP. Joint estimation of water/fat images and field inhomogeneity map. Magn Reson Med. 2008;59:571–580. doi: 10.1002/mrm.21522. [DOI] [PMC free article] [PubMed] [Google Scholar]
- 44.Kellman P, Hernando D, Shah S, Zuehlsdorff S, Jerecic R, Mancini C, Liang ZP, Arai AE. Multiecho Dixon fat and water separation method for detecting fibrofatty infiltration in the myocardium. Magn Reson Med. 2009;61:215–221. doi: 10.1002/mrm.21657. [DOI] [PMC free article] [PubMed] [Google Scholar]


