

Abstract
Objective
We conducted an economic evaluation of mammography promotion interventions in a population-based, nationally representative sample of 5,500 women veterans.
Methods
Women 52 years and older were randomly selected from the National Registry of Women Veterans and randomly assigned to a survey-only control group and two intervention groups that varied in the extent of personalization (tailored vs. targeted). Effectiveness measures were the prevalence of at least one self-reported post-intervention mammogram and two post-intervention mammograms 6-15 months apart. Incremental cost effectiveness ratios (ICERs) were the incremental cost per additional person screened. Uncertainty was examined with sensitivity analysis and bootstrap simulation.
Results
The targeted intervention cost $25 per person compared to $52 per person for the tailored intervention. About 27 percent of the cost was incurred in identifying and recruiting the eligible population. The percent of women reporting at least one mammogram were .447 in the control group, .469 in the targeted group, and .460 in the tailored group. The ICER was $1,116 comparing the targeted group to the control group (95% confidence interval (CI) = $493 to dominated). The tailored intervention was dominated (more costly and less effective) by the targeted intervention.
Conclusion
Decision-makers should consider effectiveness evidence and the full recruitment and patient time costs associated with the implementation of screening interventions when making investments in mammography screening promotion programs. Identification and recruitment of eligible participants add substantial costs to out-reach screening promotion interventions. Tailoring adds substantial cost to the targeted mammography promotion strategy without a commensurate increase in effectiveness. Although cost-effectiveness has been reported to be higher for some in-reach screening promotion interventions, a recent meta-analysis revealed significant heterogeneity in the effect sizes of published health-plan based intervention studies for repeat mammography (ie, some studies reported null effects compared with control groups).
Keywords: Screening Promotion, Mammography, Cost-Effectiveness, Tailoring, Veterans
Introduction
Breast cancer was the second leading cause of cancer-related death among American women in 2008. During 2008, approximately 182,460 new cases of breast cancer were diagnosed, and an estimated 40,480 women died of breast cancer (Ries LAG, Melbert D, Krapcho M, Stinchcomb DG, Howlader N, Horner MJ, Mariotto A, Miller BA, Feuer EJ, Altekruse SF, Lewis DR, Clegg L, Eisner MP, Reichman M, and Edwards BK (eds)., 2008). Breast cancer incidence and death rate increase with age. Seventy-five percent of breast cancer cases are among women age 50 years or older. In addition to age, other risk factors for breast cancer include race, socioeconomic factors, and genetic markers (Berg, Allan, Frame, Homer, Johnson, Klein, Lieu, Mulrow, Orleans, Peipert, Pender, Siu, Teutsch, Westhoff, and Woolf, 2002). The breast cancer mortality rate has declined since 1990, and the percentage of decline was higher among women aged 50 and younger than women aged 50 and older (American Cancer Society, 2007).
Although there is debate about the optimum age at which to initiate mammography screening as a result of the revised U.S.Preventive Services Taskforce guidelines in 2009,(Javitt and Hendrick, 2010) regular mammography screening in women 50 and older has been shown to reduce breast cancer mortality (Harris, 2005;Kerlikowske, Grady, Rubin, Sandrock, and Ernster, 1995). The evidence that mammography screening reduces breast cancer mortality is stronger for women aged 50-69 years than for women aged 40-49. A major study re-confirmed that increases in mammography screening and improved treatment of breast cancer reduced breast cancer mortality. While the study (Berry, Cronin, Plevritis, Fryback, Clarke, Zelen, Mandelblatt, Yakovlev, Habbema, and Feuer, 2005) reinforced earlier findings that mammography screening for average-risk women was cost-effective (de Koning, 2000;Kerlikowske, Salzmann, Phillips, Cauley, and Cummings, 1999;Lindfors and Rosenquist, 1995;Stout, Rosenberg, Trentham-Dietz, Smith, Robinson, and Fryback, 2006;van der Maas, de Koning, van Ineveld, van Oortmarssen, Habbema, Lubbe, Geerts, Collette, Verbeek, and Hendriks, 1989), the findings are tempered by the realization that we still do not know which screen-detected tumors will benefit from treatment (Berry, 2008).
Relative to the large number of trials, there are few studies of the cost-effectiveness of community based outreach interventions to increase compliance with screening guidelines (Andersen, Hager, Su, and Urban, 2002;Costanza, Stoddard, Luckmannl, White, Spitz Avrunin, and Clemow, 2000;Crane, Leakey, Ehrsam, Rimer, and Warnecke, 2000;Stockdale, Keeler, Duan, Derose, and Fox, 2000). What was striking was the relatively modest effect of the programs on screening rates, given a baseline rate of between 38 and 65% in the target groups (Andersen et al., 2002;Costanza et al., 2000;Crane et al., 2000;Stockdale et al., 2000). For example, Andersen et al. (2002) found the interventions increased the mammography screening rate relative to the control group from 2.1 to 2.8 percent. The societal cost per extra woman screened compared to baseline ranges from about $1,000 to $6,500. In the three studies with both payer and societal results, the payer incremental cost-effectiveness ratio (ICER) was one-half to one-fifth the societal value and nearly the same in one study(Costanza et al., 2000). Previous studies, except Stockdale et al. had interventions that varied intensity of effort. Three out of the four studies that varied intensity found point estimates that suggest the more costly interventions yield less effect than lower intensity interventions. The simpler approaches may not only be more effective but also more efficient than the more complex and costly interventions. For example, when Andersen et al. combined the individual counseling with community activities, the effect was lower than with community activities alone (Andersen et al., 2002). Similarly, when Constanza et al. utilized the more expensive physician based education intervention, it was more costly and less effective than the telephone counseling intervention (Costanza et al., 2000).
The primary aim of this paper was to examine the cost-effectiveness of both targeted and tailored interventions compared to a survey-only control group, to increase mammography screening among women veterans in the United States. Our study is particularly relevant to decision-makers interested in programs of national scope that comprise a comprehensive assessment of the costs of recruitment and implementation of the interventions, including the time costs of the participants. The occupational cohort of US women veterans was chosen as the target population for the intervention trial because of its universal access to health-care services and the fact that it is otherwise representative of the US female population recommended to receive regular mammography screening in terms of demographic profile, geographic dispersion, past mammography screening rates, and complex, real-world patterns of use of private- and government-sponsored health-care services(Boyle and Louis Harris and Associates, 1985;Department of Veterans Affairs, 2004). The sampling frame used to access the target population was the National Registry of Women Veterans (NRWV), an electronic database developed by one of the authors (DDJ) to promote health-related research of potential benefit to the entire population of US women veterans[dl1], and described in greater detail in del Junco et al. (2008) along with the study’s tracing and recruitment methods. Briefly, the NRWV extracted military identifiers from records determined to relate to female veterans based on cross-linkages of 14 different VA and Department of Defense (DoD) data sources. The NRWV identified 1.4 million of the 1.6 million estimated women veterans separated from active military duty between January 1, 1942, and December 31, 1997, and is considered a virtually exhaustive sampling frame for surviving older women veterans who have ever applied for VA benefits and a large sampling frame with no known selection bias for all other surviving older women veterans.
There is a large and growing population of women veterans in the United States. The National Survey of Veterans showed approximately 1.48 million women veterans are living in the United States (Department of Veterans Affairs, 2004). Thirty-one percent were over the age of 50 and 30% were aged 40-49. By the year 2011, more than 50% of women veterans will be over 50 years old. Among women veterans, 76.1% were White and 15.7% were African Americans (Department of Veterans Affairs, 2004). With the increasing number of aging women veterans and limitation of financial resources, it is important to assess the cost-effectiveness of disease prevention interventions for this population. Given the similarities between women veterans and the female population, the study has wide applicability for mammography screening promotion policy.
We briefly describe the screening promotion intervention and how effectiveness in increasing the screening rate was assessed. We then describe how costs of the intervention were determined. Following that we describe our approach to analyzing uncertainty in the results of the cost-effectiveness analysis. Incremental cost-effectiveness ratios, sensitivity analyses, and cost-effectiveness confidence intervals are presented in the results. Finally, we discuss the limitations of the study, the implications for health policy and further study, and lessons learned.
Methods
Project HOME Interventions
The economic evaluation was done from a payer and participant perspective in 2008 U.S. dollars, based on the results of Project HOME (Healthy Outlook on the Mammography Experience), a 5-year prospective randomized trial of interventions created to increase compliance with breast cancer screening guidelines among women veterans, 50 years and older. Project HOME was funded by the National Cancer Institute (R01CA76330) and was conducted through the University of Texas Health Science Center at Houston School of Public Health and the Veterans Administration Medical Center in Durham, North Carolina. The study protocol was approved by the institutional review boards of both institutions. Previous reports describe the study design and behavioral outcomes (Vernon, del Junco, Tiro, Coan, Perz, Bastian, Rakowski, Chan, Lairson, McQueen, Fernandez, Warrick, Halder, and DiClemente, 2008) and the extensive internal and external validity assessments (del Junco, Vernon, Coan, Tiro, Bastian, Savas, Perz, Lairson, Chan, Warrick, McQueen, and Rakowski, 2008) for the national community based trial. Inclusion criteria for Project HOME were female, veterans, 52 years of age or older on June 1, 2000, included in the US National Registry of Women Veterans (NRWV). Of 8444 study candidates randomly drawn from the NRWV, 2944 were determined to be ineligible before the first intervention mailing, leaving 5500 for the intention to treat analysis. They were randomized into two interventions and one control group and were determined to be statistically equivalent on all factors measured at randomization, time of baseline surveys, and at the end of the study (del Junco et al., 2008).
Women were randomized into a group that received a tailored intervention (n = 1803); a group that received a targeted intervention (n = 1857) and a group that served as a no intervention, survey-only control (n = 1840). The tailored messages were created based on participant’s individual responses to questions about their knowledge, attitudes and beliefs about mammography screening. All intervention materials were distributed through the United States Postal Service (Vernon et al., 2008).
The intervention materials were developed based on focus groups with women veterans and were designed to target the study population’s veteran status by including graphics depicting women veterans and testimonials and quotes about mammography screening from women veterans along with a pamphlet describing how to access mammography through the VA (Veterans Affairs). Table 1 shows the elements of the interventions by group. The difference between the interventions designed for the groups was the content of the letter that accompanied the booklets and the surveys required to write the letters. Women in the targeted group received a generic letter that conveyed messages about breast cancer and breast cancer screening and encouraged them to be screened. Although the targeted group filled out a baseline survey for research purposes, the targeted intervention does not require a detailed survey about women’s knowledge, attitudes and beliefs toward screening. Therefore, the baseline survey cost was omitted from the economic evaluation for the targeted group. Women in the tailored group received a tailored cover letter using information from the baseline knowledge, attitudes and beliefs survey to address specific concerns that women have about screening. Also included with the booklets and cover letter was a pamphlet about VA mammography services, and a letter about mammography for a woman to discuss with her health care provider. Women in the tailored group who did not return the survey received the booklets with the generic cover letter and a pamphlet containing information about VA mammography services. Both intervention groups received a second booklet and either a tailored or a generic cover letter approximately two months after the mailing of the year 1 survey. Thus, there were two waves of intervention material over a two-year period. A third group of women were randomized to a no intervention control group. They received eligibility material and follow-up surveys to measure screening behavior. Status with regard to eligibility for the trial was established for 93% of the 23,000 records randomly selected from the age-eligible subset of the NRWV. A slight decrease in mammography screening was observed for study participants between the years 2001 and 2004 regardless of the source of mammography information. As described in del Junco et al. (2008), the observed mammography coverage and compliance rates and pattern of decline between the years 2001 and 2004 mirrored the reported mammography experience for the US female population over the same time, which further support the trial’s generalizability.
Table 1.
Intervention Elements
| Intervention | Randomization |
|
|---|---|---|
| Tailored c |
Targeted |
|
| Eligibility letter | Yes | Yes |
| Baseline, Year 1 and Year 2 survey | Yes | Nod |
| Intervention Packagea | ||
| Self-assessment form (stage of readiness) | Yes | Yes |
| Educational booklets (one for each of 4 stages of readiness) | Yes | Yes |
| Letter (to discuss mammography with provider) | Yes | Yes |
| Tailored newsletterb | Yes | No |
| Generic letter | No | Yes |
| Pamphlet (mammography available from VA) | Yes | Yes |
| Bookmark (addressing identified 1 to 3 barriers) | Yes | No |
An intervention package was sent after the baseline/year 1 survey was returned.
A 4-page stage tailored cover letter based on survey responses.
Women who did not return the baseline or year 1 surveys were sent the generic letter.
While a baseline survey was done for research purposes, it would not be done in a “real world” application.
Cost Estimation
Cost by major activity was determined based on the personnel and subject time required for each step of implementation plus the materials and mailing cost. Since the tailored intervention required the completion of a questionnaire, all six steps (tables 3), including multiple mailings and follow-up phone calls were required to fully implement the tailored strategy. In contrast, the intervention packet could simply be mailed to the group receiving the targeted intervention. Participants would not require a baseline survey in an actual non research based implementation of the targeted intervention.
Table 3.
Total Implementation Costs for Coverage and Compliance by Intervention Step
| Project Cost | ||||||
|---|---|---|---|---|---|---|
| Baseline Year |
Year 1 |
|||||
| Coverage |
Compliance |
|||||
| Targeted ($) |
Tailored ($) |
Targeted ($) |
Tailored ($) |
Targeted ($) |
Tailored ($) |
|
| Step 1: Eligibility survey mailing | ||||||
| Survey mailing time cost - Personnel | 14,547.9 | 14,651.7 | 0.0 | 0.0 | 0.0 | 0.0 |
| Survey mailing supply cost | 3,780.4 | 3,807.4 | 0.0 | 0.0 | 0.0 | 0.0 |
| Total Step 1 | 18,328.3 | 18,459.1 | 0.0 | 0.0 | 0.0 | 0.0 |
| Step 2: 1st baseline survey mailing | ||||||
| Baseline survey mailing time cost - Personnel | 0.0 | 8,244.8 | 0.0 | 2,693.6 | 0.0 | 2,303.7 |
| Baseline survey mailing supply cost | 0.0 | 2,883.5 | 0.0 | 934.5 | 0.0 | 800.3 |
| Survey time cost - Patient | 0.0 | 1,188.9 | 0.0 | 141.4 | 0.0 | 462.2 |
| Total Step 2 | 0.0 | 12,317.2 | 0.0 | 3,769.5 | 0.0 | 3,566.2 |
| Step 3: Reminder mailing | ||||||
| Reminder mailing time cost - Personnel | 0.0 | 444.5 | 0.0 | 184.7 | 0.0 | 129.0 |
| Reminder mailing supply cost | 0.0 | 1,549.6 | 0.0 | 645.6 | 0.0 | 327.4 |
| Survey time cost - Patient | 0.0 | 318.9 | 0.0 | 55.6 | 0.0 | 162.7 |
| Total Step 3 | 0.0 | 2,313.0 | 0.0 | 885.9 | 0.0 | 619.1 |
| Step 4 : 2nd baseline survey mailing & phone call | ||||||
| Survey mailing time cost - Personnel | 0.0 | 3,941.6 | 0.0 | 1,772.7 | 0.0 | 645.5 |
| Survey mailing supply cost | 0.0 | 1,295.9 | 0.0 | 582.9 | 0.0 | 212.2 |
| Survey time cost - Patient | 0.0 | 741.5 | 0.0 | 221.0 | 0.0 | 191.5 |
| Phone call time cost - Staff | 0.0 | 359.2 | 0.0 | 37.1 | 0.0 | 32.4 |
| Phone call time cost - Patient | 0.0 | 132.7 | 0.0 | 10.4 | 0.0 | 9.1 |
| Total Step 4 | 0.0 | 6,470.9 | 0.0 | 2,624.1 | 0.0 | 1,090.7 |
| Step 5: 3rd baseline survey mailing & phone call | ||||||
| Survey mailing time cost - Personnel | 0.0 | 88.0 | 0.0 | 36.7 | 0.0 | 12.2 |
| Survey mailing supply cost | 0.0 | 28.9 | 0.0 | 12.1 | 0.0 | 4.0 |
| Survey time cost - Patient | 0.0 | 39.8 | 0.0 | 15.4 | 0.0 | 6.4 |
| Phone call time cost - Staff | 0.0 | 952.4 | 0.0 | 376.8 | 0.0 | 236.3 |
| Phone call time cost - Patient | 0.0 | 350.4 | 0.0 | 135.9 | 0.0 | 82.4 |
| Total Step 5 | 0.0 | 1,459.5 | 0.0 | 576.9 | 0.0 | 341.3 |
| Step 6: Package mailing | ||||||
| Tailored letter package mailing time cost- Personnel | 0.0 | 8,324.0 | 0.0 | 594.6 | 0.0 | 1,871.0 |
| Generic letter package mailing time cost- Personnel | 4,978.0 | 1,488.8 | 1,338.5 | 904.1 | 1,843.3 | 180.8 |
| Tailored letter package mailing supply cost | 0.0 | 5,732.1 | 0.0 | 1,092.6 | 0.0 | 3,438.2 |
| Generic letter package mailing supply cost | 7,897.5 | 2,801.9 | 2,519.1 | 1,701.5 | 3,469.2 | 340.3 |
| Total Step 6 | 12,875.5 | 18,346.8 | 3,857.6 | 4,292.7 | 5,312.5 | 5,830.3 |
| Total Direct Cost | 31,203.8 | 59,366.5 | 3,857.6 | 12,149.1 | 5,312.5 | 11,447.6 |
| Overhead Cost | 9,361.1 | 17,809.9 | 1,157.3 | 3,644.7 | 1,593.8 | 3,434.3 |
| Total Implementation Costs | 40,564.9 | 77,176.4 | 5,014.8 | 15,793.8 | 6,906.3 | 14,881.9 |
There were 1857 participants in the targeted group and 1803 participants in the tailored group.
Activity costing was used to estimate the cost of the interventions. This entailed identifying, enumerating, and valuing all resources required for each activity by arm of the intervention. Materials were valued with market prices and wage rates and benefit levels were obtained from the VA. The data were baseline data collected in 2001 - 2002; and adjusted to 2008 U.S. dollars by the CPI (Bureau of Labor Statistics, 2007).
Cost data were collected using four methods: staff time logs, where staff were asked to approximate the amount of time required for specific tasks, purchase orders and invoices, study subject time cost, which were calculated from the Project HOME pilot study data and phone call data, and estimation of overhead and miscellaneous costs.
Personnel Cost
All personnel costs were calculated by multiplying the minutes spent on each activity by the adjusted salary per minute of the personnel. The base salary used to calculate the adjusted salary per minute for the project staff was the mean base salary for the listed positions at the Veterans Affairs Medical Center for the fiscal year 2002, from October 2001 to September 2002. Table 2, which was derived from (Andersen et al., 2002) and based on methods from (Urban, Self, Kessler, Prentice, Henderson, Iverson, Thompson, Byar, Insull, and Gorbach, 1990), displays the method for calculating the project staff’s salaries used in the cost estimates. The mean national VA employee salary data were used in this analysis (Smith, 2003).
Table 2.
Veterans Affairs Personnel Salary Table
| Base Salary ($) | Fringe Rate | Salary & Fringe ($) | Salary per Min. ($) | Non-intervention related training hours | Non-intervention related meeting hours | Vacation & Holiday hours | Annual hours at work | Annual hours available for tasks* | Proportion of Paid hoursavailable for tasks(%) | Adjusted salary per Minute ($) | |
|---|---|---|---|---|---|---|---|---|---|---|---|
| Clinical Psychologist | 97,463.57 | 0.206 | 117541.07 | 0.94 | 10 | 32 | 188 | 1850 | 1572.5 | 76.0 | 1.25 |
| Administrative Personnel | 50,252.85 | 0.256 | 63117.58 | 0.51 | 10 | 32 | 188 | 1850 | 1572.5 | 76.0 | 0.67 |
| Computer Operator | 60,282.14 | 0.256 | 75714.37 | 0.61 | 10 | 32 | 188 | 1850 | 1572.5 | 76.0 | 0.80 |
| Clerical Personnel | 38,219.35 | 0.206 | 46092.54 | 0.37 | 10 | 32 | 188 | 1850 | 1572.5 | 76.0 | 0.49 |
NOTE: Median base salary for VA employees Fiscal Year 2002, Total paid hours per year=2,080;
productivity rate = 0.85.
The number of minutes spent performing the specific tasks were recorded in a monthly time log by each project staff member. If staff members did not record their times adequately on the logs, they were asked to estimate their average time spent retrospectively. Compliance for completion of the task time logs was 100% however, approximately 20% of the completed time logs were estimated retrospectively. The overall time spent on each activity was used to create a unit time cost per task.
Supply Cost
The costs of the materials were extracted from project accounting records. Computer usage and computer software were not included in the supply cost; they were considered part of the overhead or indirect cost. The unit cost of the supplies was obtained from invoices. Supplies include questionnaires, printing costs, envelopes, paper, postage, and all other resources used to create and distribute the surveys and intervention materials.
Study Subject Cost
The mean subject time spent completing the mailed surveys was 15.4 minutes, estimated from data on 156 women veterans who completed a telephone interview baseline survey. The time cost was calculated using the mean length of time to complete the survey multiplied by the mean self-reported wage rate estimated from the pilot study. If the individual was not working, they were assigned a time value equal to the 2005 federal minimum wage of $5.15 per hour. If a subject was employed, but did not provide a wage rate, the weighted wage rate of working subjects was assigned.
Indirect Costs
Indirect costs, such as administrative services, utilities, and office space were calculated by multiplying the direct cost per subject by an indirect rate of 30%. This indirect cost rate was the same one used by the VA for administrative support costs and was reported in The Cost Distribution Report (CDR), which documents the use of the VA Medical Care appropriation (Health Economics Resource Center, 2002). The indirect cost was the summed personnel time cost and supply cost multiplied by 30%.
Effect and ICER Estimation
We examined two measures of screening outcome for the same patient groups, coverage (at least one post-intervention mammogram during the study period) and compliance (two post-intervention mammograms 6-15 months apart) (Vernon et al., 2008). The ICERs were computed by dividing the added cost (i.e., incremental cost) by the added percentage of women being screened (i.e., incremental effect), first comparing the targeted group to the control group and then comparing the tailored group to the targeted group. Point estimates of average cost and screening rates by group, and patient level cost and outcome data were obtained from the randomized trial described above (del Junco et al., 2008;Vernon et al., 2008). Uncertainty in the ICER estimates was examined by bootstrap simulation of the 95% confidence intervals. One thousand random draws with replacement of 250 cases from the approximately 1,800 cases in each group were used to non-parametrically determine the confidence intervals. One-way sensitivity analysis was used to examine alternative assumptions on the overhead rate (25, 30, 35 percent).
Results
Intervention Costs
Table 3 presents the cost of conducting the tailored and the targeted Project HOME interventions for the coverage and compliance outcomes. For the coverage cost estimate, it was assumed that the intervention material was sent out once for those who receive a mammogram within one year of receiving the first mailing and twice for those who do not. Targeted intervention costs were associated with locating the target population and determining eligibility for screening and assembling and mailing the targeted material to the subjects. Overall, about 27% of total cost was consumed by locating subjects and determining eligibility for screening. Eligibility cost was a higher proportion of total cost (40%) for the targeted group compared to the tailored group (20%). Tailored intervention was more resource intensive than the targeted intervention due to the cost of repeated attempts to obtain completed questionnaires for the tailored feedback. At societal cost of $52 per subject for the tailored intervention was about 2 times as costly as the targeted intervention. About 46% of the cost of the targeted intervention was for personnel. In contrast, about 49% of the cost was personnel time for the tailored intervention.
For the compliance cost estimate, it was assumed that subjects who did not report obtaining a mammogram within one year of the intervention, would not receive a second intervention mailing and therefore no cost was assigned for a second mailing for that subgroup of women.
Table 4 presents the base case estimates of the ICERs for coverage, i.e., at least one mammogram during the two-year study period. The denominator for both intervention groups was based on intention-to-treat, equaling 1,803 individuals in the tailored group and 1,857 in the targeted group. While the randomized trial did not yield results that were statistically significant at the conventional α = .05 level, we used the point estimate as the “best” available estimate of program effect. The tailored intervention was dominated by the targeted intervention, i.e., the former was both more costly and less effective than the targeted strategy. 44.7% of subjects in the control group received a mammogram within 2 years of the intervention compared to 46.9% of those in the targeted group and 46% of those in the tailored group. The ICER (cost per additional woman screened) was $1116 comparing no intervention to the targeted intervention. The ICER was not computed between the targeted and the tailored strategies because the targeted strategy was dominant. Table 4 presents the base case estimates of the ICERs for the question of compliance, i.e., two mammograms 6-15 months apart following the baseline intervention. The ICER for the targeted intervention compared to the control group was $926, based on an average incremental cost of $26 per woman in the target population and a gain in compliance from 22.01% in the control group to 24.77% in the targeted group. The point estimate of incremental effect for compliance in the tailored group was only marginally better than the targeted intervention. This along with the higher incremental cost of the tailored promotion resulted in an ICER for the tailored promotion versus the targeted promotion of $121,986.
Table 4.
Cost-Effectiveness Results
| Intervention | Average Cost Of Intervention ($) | IncrementalCost (Difference in Cost of Interventions) ($) | Effect (E) (Screening Rate) | Incremental Effect (ΔE) (Difference in Screening Rates) | Incremental Cost-effectiveness Ratio (ΔC/ΔE) ($) |
|---|---|---|---|---|---|
| Coverage Mammogram | |||||
| Usual Care | 0 | 0.447 | |||
| Targeted | 24.5 | 24.5 | 0.469 | 0.022 | 1115.7 |
| Tailored & Targeted | 51.6 | 27.0 | 0.46 | -0.009 | Dominated |
| Compliance Mammogram | |||||
| Usual Care | 0 | 0.2201 | |||
| Targeted | 25.6 | 25.6 | 0.247711 | 0.027611 | 925.8 |
| Tailored & Targeted | 51.1 | 25.5 | 0.247920 | 0.000209 | 121985.7 |
Analysis of Uncertainty
Statistical uncertainty in the cost-effectiveness ratios (ICERs) comparing the targeted and control groups was assessed with 1,000 bootstrap samples. The bootstrap replicates appear as a scatter plot of incremental costs and effects (percent of women screened) generated from the bootstrap samples (fig.1). The 95% confidence limits around the cost-effectiveness ratios for coverage are empirically determined by drawing rays from the origin to obtain 2.5% of the results outside of the lower and upper bounds of the scatter plots. The upper bound yields an ICER of $493 when comparing the control group to the targeted intervention and the lower bound yields an ICER of -$2696. Note that our point estimate ICER ($1116) falls into one of the clustered points that has slope 1116 when connecting with the origin. Cluster points near the vertical axis in the positive half of the figure have very high ICERs but ICERs become negative when a cluster point contains a negative effect (Briggs, 2001). Costs were not sensitive to changes in the overhead rate assumption since the range was only 10% and the rate affects both strategies in a similar way. Cost per participant for the coverage mammogram varied from $23.6 with an overhead rate of 25% to $25.5 with an overhead rate of 35% for the targeted intervention. The results of the economic evaluation were therefore not influenced by this range of overhead rates.
Figure 1.
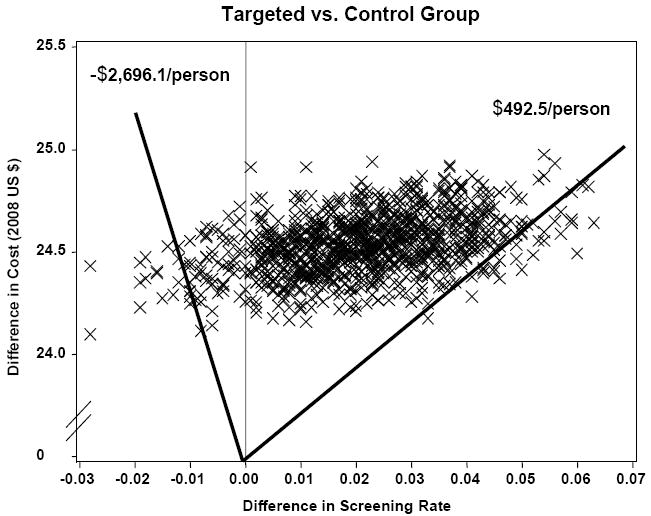
Bootstrap Replicates
Discussion
Using cost data collected alongside a community based randomized trial of women Veterans, we estimated the incremental cost-effectiveness of tailored versus targeted interventions to increase mammography screening. Extensive outcomes analysis using Cox Proportional Hazard and Logistic analysis and alternative scenarios based on intention-to-treat, modified intention to treat, and per protocol analysis had failed to provide evidence of effect for the tailored intervention, according to standard statistical criteria (Vernon et al., 2008). The economic evaluation was based on the point estimates of cost and effects from the trial, using an intention-to-treat analysis. We found that the tailored intervention was more costly and less effective than the targeted intervention and the cost per additional person screened was $1116 comparing the targeted intervention to the survey only control group. Fixed cost was about 6 percent of total cost and was mainly for design of a website, and the development of the tailored and targeted letters. Given this level of fixed cost, doubling the size of the intervention target population would reduce the average cost by only about $0.33 for the targeted intervention and about $2.26 for the tailored intervention.
Mammography screening promotion intervention studies often show relatively modest effects on screening rates(Sohl and Moyer, 2007) and therefore information on cost-effectiveness analysis (CEA) may go unpublished due to conventional wisdom that if there are no statistically significant differences in effect, we assume the least costly alternative was preferred, including no intervention. However, this was not a preferred approach to decision analysis, which is about informing decision-makers with estimation of cost-effectiveness and not about hypothesis testing (Briggs and O’Brien B.J., 2001). Point estimates of effect size and costs, whether statistically significant at conventional levels or not, represent the “best” estimates of the likely program impact. The point estimates along with an analysis of uncertainty then informs the decision-makers about the likely chance of achieving their desired outcomes and the associated costs. Analysis of uncertainty in economic evaluations goes beyond statistical analysis of confidence intervals, to include sensitivity analysis of the assumptions applied due to lack of data or because of methods such as discounting of costs and effects.
One of the few studies of the cost-effectiveness of tailored interventions for mammography screening concluded that tailoring interventions within a health plan or physicians’ office is an effective and economical way to increase screening adherence (Saywell, Jr., Champion, Skinner, Menon, and Daggy, 2004). The mean estimated costs were less than $10, but excluded all patient costs, fixed costs and made no adjustment in unit personnel costs for down time and less than 100 percent productivity of the staff. It is unclear to what extent identification and recruitment costs were included. Comparing the interventions to the no cost control group, yields a cost per additional woman screened of between $39 and $56. Another HMO in-reach study found that compared to usual care, a tailored intervention increased mammography screening rates by 20 percent at a cost of $818 per additional woman screened (Lynch, Whitlock, Valanis, and Smith, 2004). While these “in-reach” interventions were very effective, a recent meta analysis reported significant heterogeneity in the effect sizes of published health-plan based intervention studies for repeat mammography (ie, some studies reported null effects compared with control groups) (Vernon, McQueen, Tiro, and del Junco DJ, 2010).
One reason that in-reach screening promotion interventions may be found cost-effective is the extent to which all costs are measured. Patient time is needed to fully assess an in-reach intervention, but those costs are often omitted from studies. This paper has measured the patient costs of an outreach intervention. Results from our study and prior studies of outreach breast cancer screening promotion (Andersen et al., 2002;Costanza et al., 2000;Stockdale et al., 2000) suggest that tailoring adds substantial cost to mammography promotion strategies and may not have a commensurate increase in effectiveness, raising questions about the efficiency of tailored mammography promotion interventions in community interventions. For example, a community based intervention that employed barrier specific individual counseling to increase screening did not produce a statistically significant increase in screening rate relative to the control group and the point estimate of the cost per additional mammogram was $1,984 (Andersen et al., 2002).
There were some limitations that should be considered when interpreting these economic results. Personnel comprised the largest part of intervention costs and estimates for each arm of the study were based on self- reported monthly logs of time required for individual intervention activities. About 80% of the reports were filed on time and the remainder were filed late following prompts from the research staff. Fully allocated overhead costs were not available and overhead cost was estimated based on a standard percent of direct cost obtained from VA administration. As with the overhead rate, personnel cost was based on VA wages and benefits and may not be generalizable to other healthcare providers. Subject time cost was estimated from telephone survey data. The cost of determining eligibility for the intervention could be lower, depending on the availability of up-to-date information on subjects’ age, screening status, and cancer history. However, this would not influence the comparison between the targeted and tailored interventions. Better response rates to baseline questionnaires could also lower the cost of implementing the tailored intervention. Screening behavior was based on self reports, although we were able to support the validity of self reports for a subset of women who used the VA for mammography screening (del Junco et al., 2008). We did not estimate the effect of the interventions on final health outcomes such as quality adjusted life years (QALYs) that would allow an assessment of the interventions in terms of cost per QALY norms. QALY analysis could be accomplished by organizations such as CISNET(Cancer Intervention and Surveillance Modeling Network (CISNET) Breast Cancer Collaborators, 2006), by applying their complex breast cancer models along with assumptions about quality of life associated with screening, treatment, and disease states, taking us well beyond the data available in the trial.
Our randomized trial had a number of strengths. It examined a print-based mammography promotion carried out on a randomly selected national sample of women veterans. Costs were comprehensive, including the resources required to determine eligibility for screening and to deliver the screening promotion intervention, including time costs incurred by the participants. Similar to previous studies (Ritzwoller, Sukhanova, Gaglio, and Glasgow, 2009), we found that identifying and marketing the interventions to the target populations represents as much as 40% of the cost of behavioral interventions. Finally, effectiveness was determined based on intention-totreat, thereby minimizing bias resulting from differences in participant characteristics.
Decision-makers need to carefully consider the available evidence on the costs and effectiveness of tailored interventions to increase mammography screening. The answers may differ depending on whether they are reaching into an existing health plan or group practice patient population versus reaching out to the larger community who may or may not have a usual source of healthcare. In the interim, researchers and providers need to develop and assess cost-effective methods to increase screening compliance among average-risk women.
Lessons Learned
Track the cost of identifying and recruiting the eligible target group as part of the overall program cost. This cost was frequently omitted from economic evaluations, but may comprise up to 40 percent of the cost of achieving the program objectives and is a necessary part of any application of the intervention in practice. Recruitment cost needs to be disaggregated from the total cost to allow decision-makers to consider whether it represents a realistic estimate of recruitment cost in their situation. Activities associated with the research process may result in a high estimate compared to practice even though we aimed to exclude research costs from our estimates. For example, additional information was collected for describing the study groups, including a control group; and planning meetings were likely more numerous and more time consuming due to the complexity of implementing a program in the context of a research project. The availability and accuracy of an organization’s records makes recruitment of eligible subjects more or less costly.
Personnel time is typically a major component of the cost of behavioral interventions and tracking time is inherently difficult. Time and motion engineering studies represent a gold standard that is not feasible for many cost-effectiveness research projects. A second best approach is to utilize staff time logs and ask staff to allocate their time among program activities on a periodic basis. It is important to provide simplified forms and use intervals of one or two weeks for collecting the data due to the difficulty of getting staff to routinely concentrate on this task and the necessity to recall the information when logs go unfilled for a period of time.
For determining the level of statistical uncertainty in the cost-effectiveness ratios, including 95% confidence intervals for the ratios, it is important to collect and manage variable cost data by individual subject as opposed to simply estimating the average cost of alternative program activities. For example, individuals may need to be contacted a variable number of times and require more or less time to complete the intervention and each contact requires personnel time and materials. While this approach requires more data collection and data management effort, it is consistent with the effort that is typically applied to collection of clinical and behavioral outcome data and therefore reinforces the idea that the economic data is important and should be pursued with the same rigor as the outcome information.
Acknowledgments
This study was supported by the National Cancer Institute, grant no. 1R01 CA 76330-01A2. The authors appreciate the assistance of the project HOME research staff.
Biography
Vitae David Lairson, PhD is a health economist and co-director of the Center for Health Services Research at the University Of Texas School Of Public Health in Houston, Texas. The major focus of his research is the economic evaluation of preventive services and programs. He is currently directing the economic evaluation components of National Cancer Institute and CDC funded randomized trials of behavioral interventions to increase compliance with mammography, colorectal cancer, and cervical cancer screening guidelines. He is co-writing the 4th edition of a text, Evaluating the Healthcare System: Effectiveness, Efficiency, and Equity, Health Administration Press.
Wenyaw Chan, PhD is currently Professor of Biostatistics at the School of Public Health, University of Texas-Health Science Center at Houston. His research includes design and analysis of longitudinal studies, stochastic models and the development of biostatistical methods. In addition to biostatistical methodology, Dr. Chan’s research has addressed several other areas of public health. He has authored or coauthored more than 100 peer-reviewed articles in statistics, medical sciences or public health. He also co-authored one textbook in mathematical statistics and one book in parent-adolescent relationship education.
Yu-Chia Chang, MPH. is a Dr. PH candidate in the Division of Management, Policy and Community Health at the University of Texas School of Public Health at Houston, Texas. His research interests are economic evaluation of preventive services and programs, health disparities, and medical decision making. He has been involved in the economic evaluation of randomized trials of behavioral interventions to increase compliance with mammography, colorectal cancer, and cervical cancer screening guidelines.
Deborah J. del Junco, PhD., is the director of outcomes research at the Center for Translational Injury Research and senior epidemiologist at the Center for Clinical and Translational Sciences at the University of Texas Health Science Center at Houston. She is an associate professor in the Departments of Surgery and Pediatrics at the UTHSCH School of Medicine and in the Division of Epidemiology and Disease Control at the UTHSCH School of Public Health. Her research and teaching have focused on epidemiologic and statistical methods, chronic disease epidemiology, and reproductive health.
Sally W. Vernon, MA, PhD is Professor of Behavioral Sciences and Epidemiology and Director of the Division of Behavioral Sciences and Health Promotion at the University of Texas School of Public Health in Houston, Texas. Her major focus of research is cancer prevention and control with emphasis on the primary and secondary prevention of breast, cervical, and colorectal cancers. She has worked in the area of informed consent and decision making about testing with the prostate specific antigen. In recent work she has applied findings from epidemiologic studies to develop interventions to increase regular cancer screening behaviors.
Footnotes
Publisher's Disclaimer: This is a PDF file of an unedited manuscript that has been accepted for publication. As a service to our customers we are providing this early version of the manuscript. The manuscript will undergo copyediting, typesetting, and review of the resulting proof before it is published in its final citable form. Please note that during the production process errors may be discovered which could affect the content, and all legal disclaimers that apply to the journal pertain.
Contributor Information
David R. Lairson, Email: david.r.lairson@uth.tmc.edu.
Wen Chan, Email: wenyaw.chan@uth.tmc.edu.
Yu-Chia Chang, Email: yu-chia.chang.1@uth.tmc.edu.
Deborah J. del Junco, Email: Deborah.J.DelJunco@uth.tmc.edu.
Sally W. Vernon, Email: sally.w.vernon@uth.tmc.edu.
References
- 1.American Cancer Society. Breast Cancer Facts & Figures 2007-2008. Atlanta, GA: American Cancer Society, Inc.; 2007. Ref Type: Report. [Google Scholar]
- 2.Andersen MR, Hager M, Su C, Urban N. Analysis of the cost-effectiveness of mammography promotion by volunteers in rural communities. Health Education & Behavior. 2002;29:755–770. doi: 10.1177/109019802237942. [DOI] [PubMed] [Google Scholar]
- 3.Berg AO, Allan JD, Frame PS, Homer CJ, Johnson MS, Klein JD, Lieu TA, Mulrow CD, Orleans CT, Peipert JF, Pender NJ, Siu AL, Teutsch SM, Westhoff C, Woolf SH. Screening for breast cancer: Recommendations and rationale. Annals of Internal Medicine. 2002;137:344–346. doi: 10.7326/0003-4819-137-5_part_1-200209030-00011. [DOI] [PubMed] [Google Scholar]
- 4.Berry DA. The screening mammography paradox: better when found, perhaps better not to find. British Journal of Cancer. 2008;98:1729–1730. doi: 10.1038/sj.bjc.6604349. [DOI] [PMC free article] [PubMed] [Google Scholar]
- 5.Berry DA, Cronin KA, Plevritis SK, Fryback DG, Clarke L, Zelen M, Mandelblatt JS, Yakovlev AY, Habbema JDF, Feuer EJ. Effect of screening and adjuvant therapy on mortality from breast cancer. New England Journal of Medicine. 2005;353:1784–1792. doi: 10.1056/NEJMoa050518. [DOI] [PubMed] [Google Scholar]
- 6.Boyle JM Louis Harris and Associates. Study conducted for the Veterans Administration. Vol. 843002. New York, NY: Harris (Louis) and Associates, Inc.; 1985. Survey of female veterans: A study of the needs, attitudes and experiences of women veterans; pp. 1–299. Ref Type: Report. [Google Scholar]
- 7.Briggs AH. In: Handling Uncertainty in Economic Evaluation and Presenting the Results. Drummond M, Maguire A, editors. Economic Evaluation in Healthcare Oxford University Press; Oxford: 2001. pp. 172–214. [Google Scholar]
- 8.Briggs AH, O’Brien BJ. The Death of Cost-Minimization Analysis? Health Economics. 2001;10:179–184. doi: 10.1002/hec.584. [DOI] [PubMed] [Google Scholar]
- 9.Bureau of Labor Statistics. The Consumer Price Index (CPI) U.S.Department of Labor; 2007. Nov 19, Ref Type: Electronic Citation. [Google Scholar]
- 10.Cancer Intervention and Surveillance Modeling Network (CISNET) Breast Cancer Collaborators. Executive summary. J Natl Cancer Inst Monographs. 2006;36:1–2. [Google Scholar]
- 11.Costanza M, Stoddard A, Luckmannl R, White M, Spitz Avrunin J, Clemow L. Promoting mammography: results of a randomized trial of telephone counseling and a medical practice intervention. Am J Prev Med. 2000;19:39–46. doi: 10.1016/s0749-3797(00)00150-1. [DOI] [PubMed] [Google Scholar]
- 12.Crane LA, Leakey TA, Ehrsam G, Rimer BK, Warnecke RB. Effectiveness and Cost-Effectiveness of Multiple Outcalls to Promote Mammography among Low-Income Women. Cancer Epidemiology, Biomarkers & Prevention. 2000;9:923–931. [PubMed] [Google Scholar]
- 13.de Koning HJ. Breast cancer screening; cost-effective in practice? European Journal of Radiology. 2000;33:32–37. doi: 10.1016/s0720-048x(99)00105-9. [DOI] [PubMed] [Google Scholar]
- 14.del Junco D, Vernon S, Coan S, Tiro J, Bastian L, Savas L, Perz C, Lairson D, Chan W, Warrick C, McQueen A, Rakowski W. Promoting regular mammography screening I. A systematic assessment of validity in a randomized trial. Journal of the National Cancer Institute. 2008;100:333–346. doi: 10.1093/jnci/djn027. [DOI] [PMC free article] [PubMed] [Google Scholar]
- 15.Department of Veterans Affairs. Department of Veterans Affairs; Jul 15, 2008. 2001 National Survey of Veterans (NSV): Final Report. http://www.va.gov/vetdata/SurveyResults/index.htm, 1-139. 2004. Ref Type: Electronic Citation. [Google Scholar]
- 16.Harris R. Effectiveness: The next question for breast cancer screening. Journal of the National Cancer Institute. 2005;97:1021–1023. doi: 10.1093/jnci/dji221. [DOI] [PubMed] [Google Scholar]
- 17.Health Economics Resource Center. Department of Veterans Affairs; Oct 22, 2002. Overview of the VA cost distribution report. http://www.herc.research.va.gov/data/cdr.asp. 2002. Ref Type: Electronic Citation. [Google Scholar]
- 18.Javitt M, Hendrick R. Revealing the Oz behind the curtain: USPSTF screening mammography guidelines and the hot air balloon. Americn Journal of Roentgenology. 2010;194:289–290. doi: 10.2214/AJR.09.4065. [DOI] [PubMed] [Google Scholar]
- 19.Kerlikowske K, Grady D, Rubin S, Sandrock C, Ernster V. Efficacy of screening mammography: A meta analysis. JAMA. 1995;273:149–154. [PubMed] [Google Scholar]
- 20.Kerlikowske K, Salzmann P, Phillips KA, Cauley JA, Cummings SR. Continuing screening mammography in women aged 70 to 79 years: impact on life expectancy and cost-effectiveness. JAMA. 1999;282:2156–2163. doi: 10.1001/jama.282.22.2156. [DOI] [PubMed] [Google Scholar]
- 21.Lindfors KK, Rosenquist CJ. The cost-effectiveness of mammographic screening strategies. JAMA. 1995;274:881–884. [PubMed] [Google Scholar]
- 22.Lynch FL, Whitlock EP, Valanis BG, Smith SK. Cost-effectiveness of a tailored intervention to increase screening in HMO women overdue for Pap test and mammography services. Preventive Medicine. 2004;38:403–411. doi: 10.1016/j.ypmed.2003.11.024. [DOI] [PubMed] [Google Scholar]
- 23.Ries LAG, Melbert D, Krapcho M, Stinchcomb DG, Howlader N, Horner MJ, Mariotto A, Miller BA, Feuer EJ, Altekruse SF, Lewis DR, Clegg L, Eisner MP, Reichman M, Edwards BK, editors. SEER Cancer Statistics Review, 1975-2005. Bethesda, MD: National Cancer Institute; 2008. Ref Type: Report. [Google Scholar]
- 24.Ritzwoller DP, Sukhanova A, Gaglio B, Glasgow RE. Costing behavioral interventions: A practical guide to enhance translation. Annals of Behavioral Medicine. 2009;37:218–227. doi: 10.1007/s12160-009-9088-5. [DOI] [PubMed] [Google Scholar]
- 25.Saywell RM, Jr, Champion VL, Skinner CS, Menon U, Daggy J. A cost-effectiveness comparison of three tailored interventions to increase mammography screening. J Womens Health. 2004;13:909–918. doi: 10.1089/jwh.2004.13.909. [DOI] [PubMed] [Google Scholar]
- 26.Smith M. VA employee salary data. 2003 Ref Type: Personal Communication. [Google Scholar]
- 27.Sohl SJ, Moyer A. Tailored interventions to promote mammography screening: A meta-analytic review. Preventive Medicine. 2007;45:252–261. doi: 10.1016/j.ypmed.2007.06.009. [DOI] [PMC free article] [PubMed] [Google Scholar]
- 28.Stockdale SE, Keeler E, Duan N, Derose KP, Fox SA. Costs and cost-effectiveness of a church-based intervention to promote mammography screening. Health Services Research. 2000;35:1037–1057. [PMC free article] [PubMed] [Google Scholar]
- 29.Stout NK, Rosenberg MA, Trentham-Dietz A, Smith MA, Robinson SM, Fryback DG. Retrospective cost-effectiveness analysis of screening mammography. Journal of the National Cancer Institute. 2006;98:774–782. doi: 10.1093/jnci/djj210. [DOI] [PubMed] [Google Scholar]
- 30.Urban N, Self S, Kessler L, Prentice R, Henderson M, Iverson D, Thompson D, Byar D, Insull W, Gorbach SL. Analysis of the costs of a large prevention trial. Controlled Clinical Trials. 1990;11(2):129–46. 11, 129–146. doi: 10.1016/0197-2456(90)90006-n. [DOI] [PubMed] [Google Scholar]
- 31.van der Maas PJ, de Koning HJ, van Ineveld BM, van Oortmarssen GJ, Habbema JD, Lubbe KT, Geerts AT, Collette HJ, Verbeek AL, Hendriks JH. The cost-effectiveness of breast cancer screening. International Journal of Cancer. 1989;43:1055–1060. doi: 10.1002/ijc.2910430617. [DOI] [PubMed] [Google Scholar]
- 32.Vernon S, McQueen A, Tiro J, del Junco DJ. Interventions to promote repeat breast cancer screening with mammography: a systematic review and meta-analysis. JNCI. 2010;102:1–17. doi: 10.1093/jnci/djq223. [DOI] [PMC free article] [PubMed] [Google Scholar]
- 33.Vernon SW, del Junco DJ, Tiro JA, Coan SP, Perz CA, Bastian LA, Rakowski W, Chan W, Lairson DR, McQueen A, Fernandez ME, Warrick C, Halder A, DiClemente C. Promoting regular mammography screening II. Results from a Randomized controlled trial in US women veterans. Journal of the National Cancer Institute. 2008;100:347–358. doi: 10.1093/jnci/djn026. [DOI] [PMC free article] [PubMed] [Google Scholar]