

Abstract
To study the effect of disturbed flow patterns on endothelial cells, the channels found within a modular tissue engineering construct were reproduced in a microfluidic chip and lined with endothelial cells whose resulting phenotype under flow was assessed using confocal microscopy. Modular tissue engineered constructs formed by the random packing of sub-millimetre, cylindrically shaped, endothelial cell-covered modules into a larger container creates interconnected channels that permit the flow of fluids such as blood. Due to the random packing, the flow path is tortuous and has the potential to create disturbed flow, resulting in an activated endothelium. At an average shear stress of 2.8 dyn cm−2, endothelial cells within channels of varying geometries showed higher amounts of activation, as evidenced by an increase in ICAM-1 and VCAM-1 levels with respect to static controls. VE-cadherin expression also increased, however, it appeared discontinuous around the perimeter of the cells. An increase in flow (15.6 dyn cm−2) was sufficient to reduce ICAM-1 and VCAM-1 expression to a level below that of static controls for many disturbed flow-prone channels that contained branches, curves, expansions and contractions. VE-cadherin expression was also reduced and became discontinuous in all channels, possibly due to paracrine signaling. Other than showing a mild correlation to VE-cadherin, which may be linked through a cAMP-initiated pathway, KLF2 was found to be largely independent of shear stress for this system. To gauge the adhesiveness of the endothelium to leukocytes, THP-1 cells were introduced into flow-conditioned channels and their attachment measured. Relative to static controls, THP-1 adhesion was reduced in straight and bifurcating channels. However, even in the presence of flow, areas where multiple channels converged were found to be the most prone to THP-1 attachment. The microfluidic system enabled a full analysis of the effect of the tortuous flow expected in a modular construct on endothelial cell phenotype.
Keywords: Endothelial cell; Tissue engineering; Modular construct; Microfluidic; Perfusion; shear stress and disturbed flow; Activation, ICAM-1, VCAM-1, KLF2, VE-cadherin and THP-1
1 Introduction
Transplantation makes use of organs and tissues from living or cadaveric donors. Though the first successful live kidney transplant was in 1954 (Fung 2004), the general practice of transplantation is still marred by two fundamental issues: scarcity and rejection. Advances in medical technology and techniques have given more patients the option of receiving transplanted organs, however there are not enough organs available to meet the need. Hence, new sources of organs must be found.
We have been exploring a modular tissue engineering approach (McGuigan and Sefton 2006), in which it is proposed to assemble an artificial, vascularized organ from modular, submillimetre-sized cell-containing cylinders that are packed into a larger container. Modules, made from collagen, contain functional cells while the outside surface is seeded with endothelial cells. The outer confluent endothelial cell layer creates a non-thrombogenic blood-contacting surface, provided the cells maintain a non-activated phenotype (McGuigan and Sefton 2008). Random packing of modules in a container creates interconnected endothelial cell-lined channels that allow for blood perfusion.
The non-thrombogenic, quiescent phenotype of endothelial cells is critical to the success of this approach. Many conditions, including fluid shear stress, basement membrane composition and the presence of smooth muscle cells have been implicated in the maintenance of desired endothelial cell phenotype (Imberti et al. 2002). Due to the random packing of modules within the construct, there is tortuous flow through a variety of irregular geometries leading to channels that contain curves, branches, contractions and expansions, which may lead to disturbed flow (Fig. 1): i.e. the transient response of laminar flow to a source of instability which causes the flow to deviate from its streamlined motion (Chang 1970; Yellin 1966). Similar geometries produce disturbed flow in large-diameter blood vessels in vivo (such as bifurcations, curves and changes in cross-sectional area) and cause endothelial cell activation.
Fig. 1.
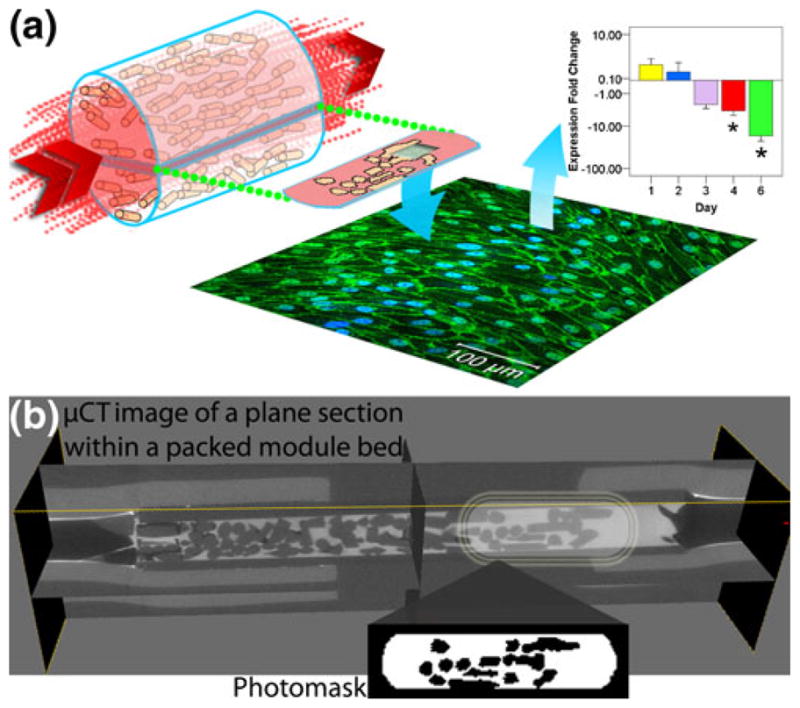
(a) The tortuous, endothelial cell-lined blood perfusion channels within a modular tissue-engineered construct were reproduced in a microfluidic device in order to quantify the effect of the resulting flow patterns on endothelium activation and integrity, as well as to provide insight into further design optimization (b) A packed module bed was scanned to produce a 3-D image using μCT. The dark grey objects are the sub-millimeter sized poloxamine modules and the lighter area around them is where fluid flows. These scans were used as the basis to create a 2-D microfluidic chamber. A section of the μCT image was converted into a photomask (inset) which was used to reproduce these channels in microfluidic chambers
Disturbed, non-laminar flow can cause the loss of the desired quiescent endothelial cell phenotype and result in a pro-inflammatory endothelium. These conditions influence atherosclerotic plaque formation, vessel wall remodeling, plaque vulnerability, endothelial cell gene expression, cytoskeletal arrangement, wound repair, leukocyte adhesion as well as the vasoreactive, oxidative and inflammatory states of the endothelium, which have been highlighted in a previous review (Cunningham and Gotlieb 2005). Nonetheless, we have hypothesized that the endothelium maintains a quiescent nature despite the irregular flow through the tortuous vessel network created by the modular tissue engineering approach. Microfluidic devices that reproduce in “two-dimensions” the vascular channels created by the modular tissue engineering approach and that are also lined with endothelial cells were used to characterize the system and test this hypothesis (Fig. 1(a)). We chose to mimic the irregular geometry of the modular construct and assess directly the consequences of the irregular flow and identify regions (or classes of regions) where undesirable phenotypes were exhibited. An alternative approach would have been to create simpler devices with well defined configurations of say bends or branches studied in isolation. To our mind this would then have necessitated an additional step of having to relate the well defined, isolated configurations to the actual construct. It was thought that the well defined configuration system would warrant further investigation, once it was known which types of configurations were of greater interest.
To assess the behaviour of endothelial cells within the channels, we examined both a low (2.8 dyn cm−2) and high (15.6 dyn cm−2) average shear stress (estimated from an Ergun equation calculation, see below). VE-cadherin was tracked as an indicator of vascular integrity and normal endothelial cell function (Corada et al. 1999). The cell adhesion molecules ICAM-1 and VCAM-1 were quantified as markers of activation; they aid in the recruitment of circulating leukocytes in the blood and can be sensitive to altered shear stress (Ley 1996; Walpola et al. 1995). The transcription factor KLF2 was examined since it is known to be shear sensitive (Dekker et al. 2002; Fledderus et al. 2007; Wang et al. 2006). Its expression increased clotting times by inducing thrombomodulin, endothelial nitric oxide synthase and reducing plasminogen activator inhibitor-1 expression as well as inhibiting the induction of VCAM-1 and E-selectin (Dekker et al. 2006; Parmar et al. 2006; SenBanerjee et al. 2004). Additionally, the THP-1 monocyte cell line was used to gauge endothelial cell adhesiveness and their recruitment was quantified as an indicator of endothelium quiescence (Reinhardt and Kubes 1998; Tsao et al. 1995; Tsao et al. 1996). Because laminar shear stress can cause a transient increase of pro-inflammatory and proliferative pathways, which become downregulated when such directed shearing is sustained (Chien 2008), cells were examined over a 6 day time course.
2 Materials and methods
2.1 Microfluidic chambers
Microfluidic chambers were fabricated following the general rapid prototyping, molding and sealing steps outlined previously (Duffy et al. 1998). Briefly, Goldline plain glass microscope slides (3″×1″, VWR International, Mississauga, ON) were cleaned and dehydrated. A seeding layer of SU-8 25 photoresist (MicroChem Corp, Newton, MA) was spin coated, soft baked, UV-exposed and cured. A second photoresist layer of SU-8 2150 was spin coated and soft baked. A photomask containing channel patterns was used in the UV exposure step, followed by a post-exposure bake. The photomask was produced in ImageJ using microcomputed tomography (μCT) scans of a modular construct (McGuigan and Sefton 2006): cylindrical poloxamine modules were packed into a 1 cm diameter cylindrical glass tube, the void space between the packed modules was filled with Microfil fluid and μCT was performed to produce a 3-dimensional image of the packed modules. From this, an image of a single plane was extracted and was converted (ImageJ version 1.42) into to a black and white image suitable for use as a 1:1 scale photomask: the image was converted to 8-bit and the threshold adjusted to reduce background (Fig. 1(b)).
Masters were developed in SU-8 Developer Solution (MicroChem Corp) with agitation from a Heidolph Rota-max 120 orbital shaker (Heidolph Instruments GmbH & Co.KG, Schwabach, Germany) and hard baked. Average height of the channels (feature thickness) was 375 μm± 88 μm. Masters were covered with Sylgard® 184 silicone elastomer (PDMS, Dow Corning Corporation, Midland, MI), degassed under vacuum and cured at 75°C for 2 h. Inlet and outlet port holes were punched into the PDMS using a blunt 18 gauge needle (Becton Dickinson and Company, Franklin Lakes, NJ) and was bonded to a 24 mm×60 mm coverglass (Corning Life Sciences, Wilkes Barre, PA) after a 90 s plasma treatment (PDC-32G Plasma Cleaner, Harrick Scientific, Ossining, NY). After 30 min at rest, the bonded units were steam autoclaved for 30 min followed by 15 min of drying time to improve the PDMS-coverglass bond (McDonald and Whitesides 2002). PE60 Intramedic Clay Adams brand polyethylene tubing (Becton Dickinson) was connected to the inlet and outlet ports and bonded using 5 Minute Epoxy (Devcon, Danvers, MA). Assembled devices (Fig. 2(a)) were ethylene oxide gas sterilized before usage.
Fig. 2.

Experimental setup. (a) Microfluidic chamber replicating the channels found within a modular tissue-engineered construct. Red fluid fills the channels where endothelial cells were to be seeded. The image was taken prior to epoxy application and only shows the inlet tube. Scale bar=1 cm. (b) Eight flow circuits were set up in parallel using a multichannel peristaltic pump. Twelve mL of endothelial cell medium was circulated from separate reservoirs and was changed every 2 days. Flow dampeners were used to reduce the pulsation, eliminate backflow and also served to remove air bubbles. The entire system was placed in an incubator set at 37°C and 5% CO2
2.2 Flow circuits
Cell seeded (see Section 2.4) microfluidic chambers were connected to a multichannel peristaltic pump and cell culture medium was circulated through the chamber in a closed loop (Fig. 2(b)). Each flow chamber had a corresponding static control where microfluidic chamber channels were filled with culture medium but not subjected to flow. In both cases, a full medium exchange was performed every 2 days. At the desired time point (1, 2, 3, 4 or 6 days), devices were removed from their flow circuits and, along with their corresponding static controls, analyzed as described below.
A 15 mL BD Falcon™ polystyrene conical tube (Becton Dickinson) was used as a reservoir for cell culture medium. Medium was pumped using a Masterflex L/S Digital standard drive with an 8-channel L/S multichannel pump head (Cole-Parmer, Vernon Hills, Il). Tubing was a combination of L/S 13 Tygon® lab tubing and L/S 13 Tygon® 2-stop tubing with connections made via luer lock connectors (Cole-Parmer). Flow dampeners were used to reduce pulsation and remove air bubbles from the system. They were constructed from Nalgene Cryogenic Vials (Nalge Company, Rochester, NY). Inlet and outlet holes were drilled into the vial and 2 cm lengths of L/S 13 tubing (Cole-Parmer) were affixed to each hole using 5-minute epoxy (Devcon).
2.3 Flow characterization
COMSOL Multiphysics 3.4 was used to model the flow within microfluidic chambers. Using the MEMS module and an incompressible Navier–Stokes single-phase flow model, the streamlines and fluid speeds within the microfluidic chamber channels were plotted. The fluid was assumed to be water at a constant temperature of 37°C.
Model outputs were verified by particle-image velocimetry (PIV) using a FlowMaster Micro PIV system (LaVision Inc., Ypsilanti, MI). FluoSpheres fluorescent microspheres (Molecular Probes, Eugene, OR) were diluted 1:1000 in PBS (Invitrogen) and pumped through the microfluidic chambers. A double-pulse Nd:YAG laser and CCD camera were used to image the flowing microspheres which was analyzed with the DaVis software package (LaVision Inc.).
The average shear stress within the microfluidic chambers was estimated through the use of Eq. 1, a modified Ergun equation (McGuigan and Sefton 2006; McGuigan and Sefton 2007).
| (1) |
where τ* is the average shear stress for the entire micro-fluidic chamber, ε is the porosity of the packed module bed (estimated to be 0.64 based on image analysis using ImageJ), μ is the fluid viscosity (assumed equal to water at 37°C), ϕ is the sphericity factor of the modules (0.492, based on image analysis of a μCT scan) and dm is the diameter of a sphere with the same volume as a module (an average value 1.623 mm, based on image analysis). Us, the superficial velocity, was calculated to be 0.00370, 0.00988 and 0.05431 m s−1 for the 0.75, 2 and 11 mL min−1 volumetric flow rates. The three shear stresses for each volumetric flow rate were thus calculated to be 1, 2.8 and 15.6 dyn cm−2.
To determine the Reynolds number for the microfluidic chamber, the equation for packed bed reactors, Eq. 2, was employed.
| (2) |
Here, ρf is the fluid density (assumed equal to water at 37°C). Flow is considered laminar when Re*<10 and turbulent when Re*>2000 (Rhodes 2008). For the 0.75, 2 and 11 mL min−1 total volumetric flow rates, Re* were calculated as 24, 64, and 351, respectively, indicating that the overall flow in the chamber was within the transition region between laminar and turbulent flow.
To determine the maximum local shear stress experienced by endothelial cells within each region of interest (as opposed to the overall average for the entire chamber calculated from Eq. 1), Eq. 3 was employed.
| (3) |
In Eq. 3, Q is the volumetric flow rate through the region of interest (calculated from CFD analysis and confirmed with PIV), b is the width of the region of interest and h is the distance between the top and bottom surface of the channel. Regions of interest were treated as infinitely wide parallel plates and not channels with rectangular cross sections because the width of the channels was much greater than their height
Knowing Q, the local Reynolds number (Re) within each region of interest was calculated from Eq. 4 using the aforementioned parallel plate assumptions.
| (4) |
Re is distinct from Re*, which was the Reynolds number for the entire chamber. For infinitely wide parallel plates, a Re>1400 is considered turbulent flow (Fox and McDonald 1992).
2.4 Endothelial cell culture
Chamber channels were coated with fibronectin (Young et al. 2007). Though endothelial cells attached without the fibronectin coat, adhesion was not robust under flow and cells detached. Chambers were filled with a 500 μg mL−1 solution of human plasma fibronectin (Gibco, Invitrogen, Paisley, PA) and incubated at 37°C and 5% CO2 for 1 h. After incubation, chambers were flushed with fresh EGM-2 medium (Lonza, Basel, Switzerland). Chambers were seeded with human umbilical vein endothelial cells (HUVEC; Cambrex, East Rutherford, NJ) between passage 2 and 6 at a density of 106 cell mL−1 and statically incubated at 37°C and 5% CO2. Channels were flushed with fresh EGM-2 medium the next day. Devices were only used if all regions were coated with a confluent layer of endothelial cells, which was assessed by light microscopy; the seeding and static incubation protocol was optimized in preliminary experiments to achieve this goal. Medium was exchanged every 2 days thereafter. On the 6th day, chambers were connected to flow circuits and flow continued for up to 6 days at 0.75, 2 or 11 mL min−1. Devices were constantly monitored for channel clogging. Clogged devices were not used in this study. Devices were fixed and probed with Table 1 antibodies.
Table 1.
Primary and secondary antibodies. For VE-cadherin and KLF2, cells were permeabilized with 0.1% Triton-X 100 (Sigma) for 4 min. All cells were blocked with 10% horse serum (Vector, Burlington, ON) for 30 min and probed with antibodies diluted in 2% BSA (Sigma) for 30 min
| Primary antibody, 1:50 dilution | Secondary antibody, 1:100 dilution |
|---|---|
| Anti-human VCAM-1, goat serum IgG (R&D Systems, Minneapolis, MN) | Alexa Fluor™ 488 donkey anti-goat IgG (Iinvitrogen, Burlington, ON) |
| Anti-human ICAM-1, mouse monoclonal IgG (Santa Cruz Biotechnology, Santa Cruz, CA) | Alexa Fluor™ 568 rabbit anti-mouse IgG (Invitrogen) |
| Anti-human VE-cadherin, rabbit IgG (Sigma, Oakville, ON) | Alexa Fluor™ 488 donkey anti-rabbit (Invitrogen) |
| Anti-human KLF2 (lung KLF), goat polyclonal IgG (Santa Cruz Biotechnology). | Alexa Fluor™ 546 donkey anti-goat (Invitrogen) |
2.5 THP-1 adhesion
THP-1 cells (human monocyte cell-line, ATCC) were cultured in RPMI medium 1640 (Gibco) supplemented with 10% FBS (Sigma), 100 U mL−1 penicillin and 100 μg mL−1 streptomycin (Gibco). Vybrant® CFDA SE (Molecular Probes) was used to label and track cells during adhesion experiments: THP-1 cells were suspended in THP-1 culture medium containing 25 μM of CFDA SE and incubated at 37°C and 5% CO2 for 15 min. After washing in fresh medium, viability was checked using trypan blue (Gibco).
Endothelial cell-containing microfluidic chambers were subjected to flow for 1 day. Along with a static control, chambers were washed with PBS (Invitrogen). Following published protocols (Akeson and Woods 1993; Krakauer 1995), labelled THP-1 cells at a concentration of 6×10⁵ cell mL−1 were statically incubated in chambers for 40 min at 37°C and 5% CO2. Non-adherent THP-1 cells were removed by washing with PBS 3 times (5 min washes). Cells were fixed in 4% paraformaldehyde (EMS, Fort Washington, PA) for 30 min at 37°C and 5% CO2, nuclei were stained with Hoecsht (bisBenzimide H 33342 trihy-drochloride, Sigma-Aldrich, Oakville, ON) and imaged.
2.6 Image and statistical analysis
Using the same confocal microscope settings (objective, gain and offset), each flow circuit device and its corresponding static control were imaged. ImageJ macros were written to count the number of cells (nuclei) found in each image and to quantify marker expression (integrated density value, IDV). To normalize data, IDV was averaged over the total number of cells (dividing IDV by number of nuclei). To allow for inter-circuit comparison, average IDV values (n=3 or 4) from flow circuits were scaled using average static controls as the baseline reference value; for each region of interest, the average IDV from the flow case was divided by the corresponding average IDV value from the static case. This quantity is referred to as the normalized IDV and was used in all statistical analysis.
To visualize the changes in marker expression, the fold change was calculated and graphed. For cases where marker expression was upregulated with flow, as compared to static controls, the fold increase was determined by dividing the averaged IDV from the flow case by that of the corresponding static case (flow/static). When the marker expression was downregulated with flow, the fold decrease was calculated as 1-(flow/static); this transformation results in a downregulation being as visually apparent as an upregulation.
Q-Q plots were used to determine if data were normally distributed. Normally distributed data was analyzed using ANOVA in conjunction with the Tukey HSD multiple-comparison correction. Independent samples means were compared using the student t-test. Differences were considered statistically significant if p<0.05.
Correlations between pairs of markers were determined by the Pearson coefficient (r) and considered statistically significant if p<0.05.
3 Results
3.1 Region selection
To study the flow through the irregular channels of a modular construct (Fig. 1) and to gauge its effect on the endothelial cells that line them, a model modular construct was reproduced in a microfluidic circuit (Fig. 2). Nine regions in the flow chamber, each 460 μm×460 μm (although some regions had small portions with no cells attached due to the presence of the PDMS walls), were chosen for detailed analysis (Fig. 3(a)) based on their predominant streamlines (Fig. 3(b)) as well as fluid speed (Fig. 3(c)). Two branching regions were selected. For the “obstruction” region, flow was split into the upper (orientation based on image in Fig. 3(a)), faster section and the slower lower section. Similarly, the “branch” region split flow into a slower upper channel and a faster, wider lower channel. The two curving channels (“narrow bend” and “wide bend”) were characterized by an increase in fluid speed. The two constrictions (“small contraction” and “large contraction”) had an even greater increase in fluid speed. The “expansion” region was characterized by a narrow, fast inlet followed by a large, slow outlet. A “node” region was also selected where three channels combined to lead into a fourth outlet channel. Finally, a “straight” region with straight streamlines was selected.
Fig. 3.

The network of channels found in the modular construct (Fig. 1) was reproduced in a microfluidic chamber. (a) Randomly packed modules appear black and act as obstructions to flow. The white region is open and lined with a monolayer of endothelial cells. White scale bar=1000 μm (b) Nine regions of interest, 460 μm×460 μm (boxes not to scale), were selected based on their shape and flow characteristics, the latter determined by their streamlines via computational modeling. Black scale bar= 1000 μm (c) PIV-based arrow plot of flow through the branch region of the microfluidic chamber operating at a flow rate of 11 mL min−1 (τ*, the average shear stress, was 15.6 dyn cm−2). Scale bar=0.1 m s−1
Table 2 shows the local (regional) shear stresses and Reynolds numbers for the microfluidic chamber. For both the low (2.8 dyn cm−2) and high (15.6 dyn cm−2) average shear stress operating conditions, the fluid flow is in a transitional state between laminar and turbulent flow, as defined for packed bed systems (10 < Re* < 2000) (Rhodes 2008). Within individual channels, the local shear stress experienced by the endothelial cells, τcell, was calculated using a parallel plate model. Not surprisingly, regions with wider channels had the lowest shear stresses and regions with narrower channels had the highest. The physiological shear stress in arterial vessels can range between 1.3 and 15 dyn cm−2 (Cheng et al. 2007) and flow chambers operated at the lower flow rate had regions that fell below this range (e.g. the node, obstruction and branch). However, all regions were within this range at the higher flow rate.
Table 2.
Local Reynolds numbers and shear stresses for each region of interest. τ* and Re* denote the average shear stress and Reynolds number of the entire microfluidic chamber, based on Ergun and packed bed calculations. τcell denotes the shear stress in each region (as would be experienced by the seeded endothelial cells) and Re is the corresponding regional Reynolds number
| Location |
QTotal =2 mL min−1 |
QTotal =11 mL min−1 |
||
|---|---|---|---|---|
|
τ*=2.8 dyn cm−2 |
τ*=15.6 dyn cm−2 |
|||
|
Re*=31 |
Re*=173 |
|||
| Re | τcell, dyn cm−2 | Re | τcell, dyn cm−2 | |
| Wide Bend | 7.05 | 1.45 | 35.69 | 7.34 |
| Narrow Bend | 6.36 | 1.31 | 34.49 | 7.10 |
| Large Contraction | 22.21 | 4.57 | 126.20 | 25.96 |
| Small Contraction | 17.76 | 3.65 | 98.54 | 20.27 |
| Branch | 3.47 | 0.71 | 17.86 | 3.67 |
| Expansion | 12.85 | 2.64 | 76.98 | 15.83 |
| Obstruction | 1.70 | 0.35 | 9.84 | 2.02 |
| Node | 4.68 | 0.96 | 23.06 | 4.74 |
| Straight | 5.22 | 1.07 | 28.74 | 5.91 |
3.2 VE-cadherin expression
The primary results of these studies were fluorescent images of the attached endothelial cells (four different markers) in different regions at two average shear stresses (and static conditions) and exposure times ranging from 1 to 6 days. A great deal of data was generated and only illustrative images from some sets of conditions are shown. Instead, the fluorescent intensities (integrated density values, IDV) have been normalized, typically relative to the corresponding static control, and these values are presented to “summarize” the images.
To illustrate the effect of shear on four selected regions, Fig. 4 shows the changes in VE-cadherin expression in response to different flow rates (reported as average shear stress, τ*) in different regions of the microfluidic chamber at one timepoint (2 days). VE-cadherin was continuous around the cell periphery for static controls but any amount of shear resulted in discontinuous expression within the entire chamber, even in regions characterized by straight streamlines. In addition to showing morphology, VE-cadherin also, in part, mediates endothelial cell response to shear stress. VE-cadherin with PECAM-1 and VEGFR2 form a mechanosensory complex that can activate inflammatory genes during disturbed flow (Tzima et al. 2005). Normally, VE-cadherin is expressed around the perimeter of the endothelial cell, but in the presence of disturbed flow, its distribution becomes discontinuous (Miao et al. 2005).
Fig. 4.

The effect of flow on VE-cadherin expression (green) after 2 days of flow in four selected regions of interest. Nuclei are counter-stained in blue. Early in the experimental time course, the effect of increasing flow rates can be seen on the morphology of the endothelial cells. With no flow, VE-cadherin is continuous and well defined. As shear stress increases, expression becomes discontinuous. At the highest shear stress, the amount of VE-cadherin expression also decreased, as compared to static controls. This may be indicative of a transition into disturbed flow as the system is subject to increasingly higher average shear stresses. Scale bars are 100 μm in length
In all nine regions (illustrated in Fig. 5 and in Fig. 6 at different experimental conditions), VE-cadherin was also seen around the perimeter of the cells, although its distribution was discontinuous. Cells were expected to align with the predominant streamlines in each region, but this was not seen for the majority of replicates. For cases where cells did align, it was mainly in the large contraction, the highest speed flow region of the chamber. Although the HUVEC were aligned in this region, the quality of VE-cadherin expression was poor; cells were much more elongated and thin with little or no VE-cadherin around their perimeter.
Fig. 5.

VE-cadherin (green, panel (a)) and KLF2 (red, panel (b)) expression at an average shear stress (τ*) of 2.8 dyn cm−2 after 6 days of flow, with nuclei counter-stained blue. Devices were co-stained for both markers and are presented as split images. Each region’s callout shows a confocal image (460 μm×460 μm in size) of the HUVEC lining the bottom surface. The dotted white lines define the PDMS walls that encroached into several regions of interest, beyond which cells were not present. Occasional bare patches and discontinuous VE-cadherin can be seen in the node, large contraction, obstruction and branch regions. KLF2 expression did not appear higher in any particular region. Scale bars within callout images=100 μm while white bars in the bottom right corner of central device images=3000 μm
Fig. 6.
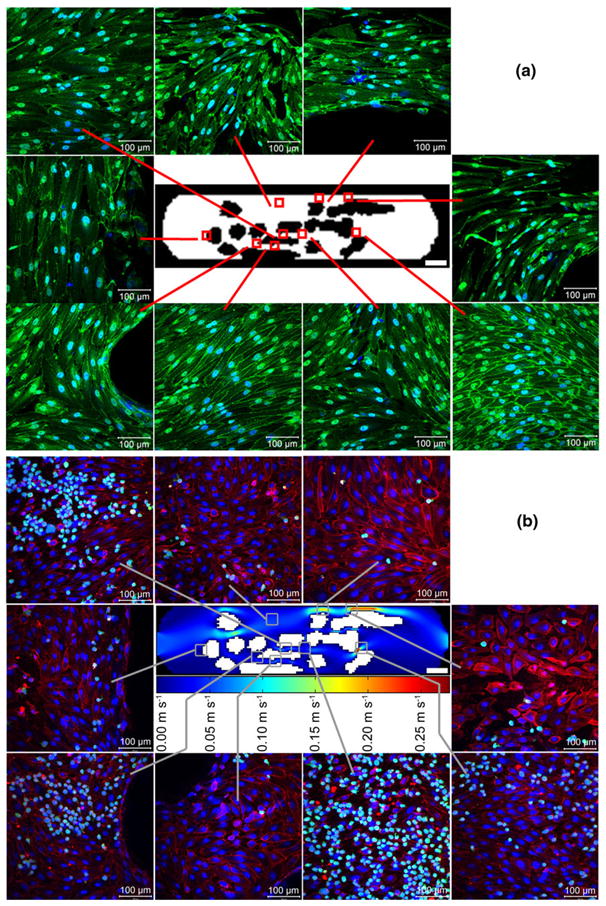
(a) VE-cadherin (green) expression at an average shear stress (τ*) of 15.6 dyn cm−2 after 1 day of flow, with nuclei counter-stained blue. For the majority of replicates, cells did not appear well aligned, even in the straight and large contraction regions where streamlines were relatively straight. VE-cadherin expression did not appear higher in any particular region and VE-cadherin appeared discontinuous throughout the entire chamber. Scale bars are 100 μm in length (b) CFDA SE labeled THP-1 adhesion to HUVEC after 1 day at τ*= 15.6 dyn cm−2. THP-1 cells appear green, nuclei appear blue and VCAM-1 appears red; the regional variation in THP-1 attachment (e.g., the high coverage in the node region) is described in the context of Fig. 7. The velocity field at the centre of the panel (by computational modeling) is for a total flow rate of 11 mL min−1 through the circuit corresponding to the 15.6 dyn cm−2 average shear stress. White scale bars within callouts are 100 μm and within the central device image are 3000 μm
3.3 THP-1 adhesion to endothelial cell-lined channels
Figure 6(a) shows the morphology of HUVEC with VE-cadherin staining (green) after 1 day at τ*=15.6 dyn cm−2 and prior to THP-1 cell addition. The tortuous nature of the channels formed within a modular construct resulted in regional changes in THP-1 cell (a monocyte cell line) attachment to the underlying endothelial cells (Fig. 6(b)). Chambers were subject to medium at a flow rate of 11 mL min−1 for 1 day (as in Fig. 6(a)), followed by a 40 min static incubation with a CFDA SE labeled THP-1 cell suspension; this is a typical incubation time for such studies (Akeson and Woods 1993; Krakauer 1995) and there is a uniform THP-1 cell density for all regions. The number of adherent cells was quantified and presented in Fig. 7. THP-1 cell adhesion is reported as coverage, the percentage of cells within the region that were stained with CFDA SE, the THP-1 marker. For static control chambers, while there were some regions that had more adherent cells than others, none of these differences were statistically significant, as expected. For chambers experiencing flow, the greatest amount of THP-1 coverage was found in the node region where several channels converged. This region showed significantly more (p<0.05) THP-1 cells than the narrow bend, large contraction, small contraction, straight and obstruction regions. Flow reduced the number of adherent THP-1 cells in the wider, more open regions of the chamber, as compared to static controls. Comparing the amount of adhesion in the static and flow cases, flow reduced THP-1 attachment to the straight and obstruction regions (p<0.05). This effect was not seen in smaller and narrower channels. For regions with similar flow characteristics (e.g., the wide and narrow bends in which the Re and τ values are nearly the same), no statistically significant differences in THP-1 adhesion were observed.
Fig. 7.

THP-1 adhesion to circuits experiencing an average shear stress of 15.6 dyn cm−2 and corresponding static controls. The total number of cells (HUVEC and THP-1) in each location was determined by nuclear staining and the percentage of those cells that were THP-1 was determined by their CFDA-SE label; this was termed THP-1 coverage. For static controls, there were no statistically significant differences in mean coverage among any of the nine regions of interest. For flow cases, the node region, where several channels combined, showed the greatest amount of THP-1 coverage. Error bars are 1 s.e.m., n=3 or 4 and * denotes p<0.05
3.4 Marker expression within the channel network
Figure 5(b) shows KLF2 expression in the same cells assessed for VE-cadherin expression in Fig. 5(a). KLF2 appeared co-localized with HUVEC nuclei and was found within cells of all nine regions of interest. All regions appeared to have similar levels of KLF2 expression. Elongated cells (such as those present in the contraction regions) also showed elongated patches of KLF2 expression. Randomly oriented cells, such as those in the node and expansion regions, showed KLF2 diffusely scattered around the nuclei.
The fold change in marker expression for each region and marker are summarized in Figs. 8 and 9. The fold change in marker expression is the expression at a particular region of interest, as compared to the same region of interest in the corresponding static control (Fig. 9). Results are also reported as the averaged fold change in the entire microfluidic circuit, ignoring the regional differences in expression; for this the fold changes of the nine regions of interest were averaged for all replicates (Fig. 8). The large error bars associated with the fold change data were likely caused by the variability in cell numbers within some channels at later time points (Table 3), presumably associated with the disturbed flow in those channels. Endothelial cells in regions experiencing flow separation and reattachment (such as bifurcations and expansions) have a higher rate of cell turnover (cell loss through death and repopulation through proliferation) and increased amounts of cell migration into areas which lack cells (such as those left empty by cell death, similar to a monolayer scratch wound assay) (Chien 2008; Chiu et al. 1998; Hsu et al. 2001).
Fig. 8.

Total (over microfluidic chamber) fold change in marker expression over time for flow cases with average shear stresses of 2.8 and 15.6 dyn cm−2. Marker expression in flow cases (region by region) was divided by that of static controls and then averaged over all replicates and regions. The connecting lines represent a significant difference in marker expression between days for a given shear stress; † represents a significant difference in marker expression between shear stresses for a given day; and * represents a significant difference in expression between flow cases and static controls. Differences were statistically significant when p<0.05. A negative fold change represents a downregulation in marker expression while a positive change signals an upregulation. Error bars are 1 s.e.m. and n between 27 and 36 based on 9 regions for three or four sets of replicates
Fig. 9.

The fold change in marker expression (normalized to that observed with a static control in the same region, time and shear stress and displayed on a logarithmic scale for different regions and times) at low and high average shear stresses. The solid connecting lines represent a significant difference in marker expression between days for a given shear stress; † represents a significant difference in marker expression between shear stresses for a given day; and * represents a significant difference in expression between flow cases and static controls (a positive value indicates expression is higher with flow). At the lower 2.8 dyn cm−2 shear stress, virtually no statistically significant differences between flow and static marker expressions were seen in any region (p>0.05). When the average shear stress was at the higher value (15.6 dyn cm−2), flow reduced the ICAM-1, VCAM-1 and VE-Cadherin expression in many regions throughout the time course, as compared to static controls. With the exception of the narrow bend region, KLF2 appeared to be unaffected by the increase in average shear stress. Error bars are 1 s.e.m., n=3 or 4 and p<0.05 for statistical significance
Table 3.
The average number of cells found within the field of view of each region of interest throughout the experimental time course. All regions initially contained a confluent layer of endothelial cells. As time progressed, the cell numbers fluctuated and bare patches were created. This was likely caused by exposure to flow separation and reattachment during disturbed flow which has been shown to affect cell death, proliferation and migration (Chien 2008; Chiu et al. 1998; Hsu et al. 2001). All values are mean ± s.e.m. and n was between 12 and 18
| τ*, dyn cm−2 | Day | Wide bend | Narrow bend | Large contraction | Small contraction | Branch | Expansion | Obstruction | Node | Straight |
|---|---|---|---|---|---|---|---|---|---|---|
| 2.8 | 2 | 96±8 | 81±7 | 56±5 | 69±8 | 91±8 | 97±14 | 75±6 | 96±7 | 110±10 |
| 4 | 61±6 | 49±7 | 35±8 | 33±6 | 51±6 | 62±10 | 55±8 | 67±6 | 51±8 | |
| 6 | 85±8 | 87±9 | 45±10 | 67±15 | 78±14 | 73±12 | 79±13 | 87±9 | 81±15 | |
| 15.6 | 1 | 102±5 | 97±7 | 60±7 | 67±9 | 89±6 | 81±8 | 72±7 | 88±6 | 94±7 |
| 2 | 101±9 | 130±8 | 56±7 | 72±12 | 135±4 | 89±9 | 92±5 | 98±11 | 92±11 | |
| 3 | 103±14 | 140±18 | 106±12 | 48±8 | 148±14 | 103±9 | 79±8 | 126±17 | 61±10 | |
| 4 | 61±11 | 96±8 | 47±4 | 19±3 | 115±16 | 54±12 | 134±13 | 73±16 | 18±5 | |
| 6 | 103±21 | 123±11 | 80±17 | 25±2 | 158±13 | 77±9 | 119±10 | 196±21 | 22±3 |
Figure 8 illustrates the total fold change in ICAM-1, VCAM-1, KLF2 and VE-cadherin expression, combining all regional data together, within a microfluidic chamber at the low and high flow rates/average shear stresses (2.8 or 15.6 dyn cm−2) over time. At 2.8 dyn cm−2, no data were collected at days 1 and 3 since there appeared to be fewer significant changes at earlier times. At this shear, ICAM-1 showed no increase over time, though VCAM-1 did. Both VE-cadherin and KLF2 peaked at day 4 at this shear stress. At 15.6 dyn cm−2, there was a decrease in ICAM-1 expression after 6 days while VCAM-1 peaked at day 4. KFL2 again peaked at day 4 and VE-cadherin expression deteriorated through to day 6. The low shear stress often displayed increased marker expression with respect to static controls while the higher shear stress resulted in a reduction. An increase in shear stress was found to reduce the expression of ICAM-1, VCAM-1 and VE-cadherin (p<0.05 for all but VCAM-1 on day 2), but no such effect was seen for KLF2.
A closer examination of the nine regions of varying geometries revealed additional details (Fig. 9). Consistent with the total chamber results, the higher 15.6 dyn cm−2 average shear stress reduced (p<0.05) the level of activation within many of the regions, as compared to both the static and low shear stress conditions. For example, as compared to static controls, ICAM-1 and VCAM-1 expression was significantly reduced in the activation-prone narrow bends, branches and contractions. Moreover, the downregulated ICAM-1 and VCAM-1 expression in the branch region was significantly lower than the same region at 2.8 dyn cm−2, which showed an upregulation in activation (p<0.05, comparing high and low shear stress conditions). While the higher shear stress resulted in many statistically significant downregulations in activation, it also resulted in poorer (downregulated) VE-cadherin expression in nearly all regions. For example, at day 6, all regions showed a significant dowregulation as compared to static controls (p<0.05). This was even the case for the straight region. Prior to day 6, the straight region showed no statistically significant differences in VE-cadherin expression between static and flow cases, as was expected for a region with straight streamlines. However, on the 6th day, there was a significant and unexpected downregulation. Regarding KLF2 expression, the vast majority of cases showed no statistically significant differences in marker expression, as compared to static controls.
The differences in marker expression among the 9 regions were also examined. At 2.8 dyn cm−2, there were no statistically significant differences in ICAM-1 expression among regions, nor were there any statistically significant differences within each region over time. This was also the case for KLF2 and VE-cadherin and mostly true for VCAM-1 (with the exception of an increase in expression between days 2 and 6 in the narrow bend, [p=0.043]).
At 15.6 dyn cm−2, there were no statistically significant differences in day 1 marker expression among different regions, with the exception of KLF2 (higher in the small contraction than in the branch [p=0.036]). ICAM-1 and VCAM-1 expression also did not vary across regions, which did not correlate with THP-1 adhesion results (Fig. 7). As time progressed, a greater number of statistically significant differences were observed with, for example, ICAM-1 expression higher in some regions than in others. At days 4 and 6, expression was often highest in the straight region, particularly for VCAM-1, KLF2 and VE-cadherin, as compared to the narrower, more irregular channels. For example, day 4 VE-cadherin expression in the straight channel was significantly higher (p<0.05) than the narrow bend, large contraction, small contraction, branch, expansion and obstruction regions.
At the higher shear stress, there were several cases (e.g., VE-cadherin expression in the node region and ICAM-1 expression in the narrow bend region between days 1 and 6) where expression within a region significantly decreased over time (p<0.05), although the majority of regions showed similar levels of expression (i.e. p≫0.05). In the straight region, KLF2 and VE-cadherin expression peaked at day 4 and was higher than at other times (p<0.05).
Regions that experienced similar flow conditions and forces (i.e. Re and τcell with less than 5% difference) were also compared. On a simplified level, this tested the hypothesis that Re and τcell (i.e., flow) alone were sufficient to predict marker behavior. Within the device (the same shear value), comparing only different regions, the wide and narrow bends experienced similar flow conditions and, as expected, no statistically significant differences in marker expression were observed.
Between devices (Re and τcell the same but different flow rate), the large contraction at τ*=2.8 dyn cm−2 had a similar flow condition to the node at τ*=15.6 dyn cm−2. With the exception of the day 6 ICAM-1 being upregulated in the large contraction as compared to the downregulation in the node region (p=0.31), no statistically significant differences in expression were found. Similarly, the small contraction at τ*=2.8 dyn cm−2 was comparable to the branch at τ*= 15.6 dyn cm−2. KLF2 and VE-cadherin showed no significant differences in expression. In contrast, VCAM-1 was upregulated in the small contraction and downregulated in the branch for all time points (p<0.05) and ICAM-1 was upregulated at day 6 in the small contraction while being downregulated in the branch. These differences may be caused by additional paracrine signaling that is only present in the higher flow rate and τ* cases (see Section 4).
3.5 Correlating marker expression
Since each microfluidic chamber was simultaneously stained for two markers (ICAM-1 and VCAM-1 or KLF2 and VE-cadherin), it was possible to look at the correlation between paired markers (Fig. 10). This method of staining precluded correlation plots between unpaired markers. As expected from the endothelial cell activation literature, ICAM-1 and VCAM-1 were well correlated with each other. The KLF2 transcription factor and VE-cadherin also displayed a statistically significant correlation, though weaker than that between the cell adhesion molecules. This too was expected as laminar shear stress upregulates the expression of the KLF2 gene (Dekker et al. 2002; SenBanerjee et al. 2004) and VE-cadherin is expressed under laminar shear stress (after an initial loss of VE-cadherin junctions following the transition from static to flow conditions) (Noria et al. 1999).
Fig. 10.

Correlation between co-stained markers. Microfluidic chambers were either stained for ICAM-1 and VCAM-1 or for KLF2 and VE-cadherin, enabling the expression levels (normalized fluorescent intensities) of each pair to be compared. The strength of the relationship was measured by the Pearson coefficient, r. The statistical significance of the correlation is determined by the corresponding p value and n is the size of the dataset. ICAM-1 and VCAM-1 both show very strong, significant correlations, confirming that activated cells express both cell adhesion molecules. A weaker, yet significant, correlation was found between the expression of the KLF2 transcription factor and VE-cadherin, suggesting a possible link between KLF2 expression and well-formed VE-cadherin junctions
4 Discussion
4.1 Endothelial cell and microfluidics
The effect of flow on endothelial cell phenotype (e.g., shape and orientation) and activation state has been studied for decades (Fry 1968) and much about endothelial cell biology has been learned (Berk 2008). Some essential work was done in a variety of laminar flow chambers built from microscope slides and coverslips (Sakariassen et al. 1983). More recently microfluidic systems have been adapted to explore aspects of endothelial cell biology that were hitherto not amenable to study (Young and Simmons 2010). For example, using a similar methodology to this study, microvascular networks were reproduced in a PDMS microfluidic chip in order to study the processes of particle adhesion in the microvasculature (Prabhakarpandian et al. 2008). In this study, it was found that anti-p-selectin-coated particle adhesion to endothelial cells was significantly localized near bifurcations in the capillary network, as compared to the straight sections over the entire network, agreeing well with in vivo observations (Yuan et al. 2005). Moreover, increased adhesion was observed within capillary loops, an observation that would have been missed in a simpler, well defined channel or parallel plate flow chamber. Collectively, the study served to validate the choice to use an in vitro system that mimics the complexity of in vivo vasculature over simpler designs and isolated configurations.
Another group of investigators (Barkefors et al. 2008) used a microfluidic system to generate stable, spatially and temporally controlled gradients of the chemotactic factors VEGFA and FGF2 to study cell migration in the context of angiogenesis. They found that VEGFA can induce chemotaxis in endothelial cells of different vascular origin, FGF2 was able to attract venous but not arterial endothelial cells and that chemotaxis was reduced when cells reached the chemotactic source. In other systems, flow effects on parameters such as alignment, migration after wounding, matrix protein-dependent adhesion, permeability and secretion have been elucidated (Chau et al. 2009; Fiddes et al. 2010; Schaff et al. 2007; Song et al. 2005; Tkachenko et al. 2009; Van Der Meer et al. 2010; Young et al. 2007). More relevant here is the use of vertical-step flow chambers which showed that endothelial cells in disturbed flow fields have unaligned stress fibers, higher leukocyte adhesion, higher cell turnover, greater LDL permeability and upregulated inflammatory genes (Chen et al. 2006; Chiu et al. 1998; Miao et al. 2005).
We too were concerned with the effects of disturbed flow on endothelial cell phenotype but in a three dimensional tissue construct created by the random assembly of modules. We chose to make use of microfluidics to create a “two-dimensional” mimic of the three dimensional flow in a construct, since the microfluidic chamber offers the advantage of direct visualization and microscopic analysis of the endothelial cells that line the channels. However the micro-fluidic chamber only mimics the modular construct. In the construct (Fig. 1), the module surfaces were covered with endothelial cells and when randomly packed, the irregular channels formed from the void spaces between the modules were lined with endothelial cells (Fig. 11) and the modules acted as obstructions resulting in flow past them through the interconnected (in 3-D) void space. In the single-plane microfluidic device (Fig. 11), obstructions representing modules still blocked flow, but endothelial cells (at least those that were analyzed) were only on the bottom fibronectin-covered glass slide of the microfluidic chamber.
Fig. 11.
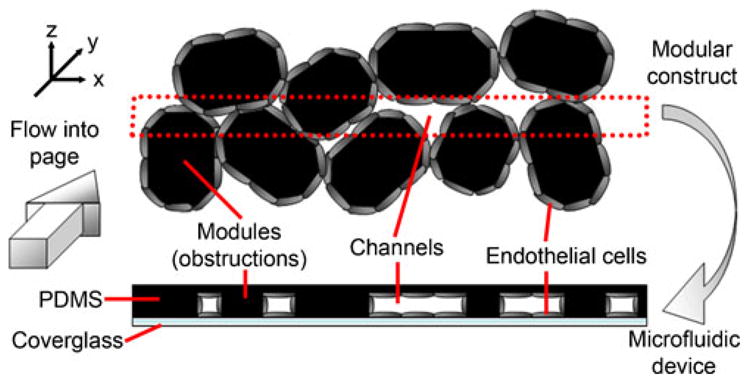
Comparison of channels formed in a modular construct and those reproduced in a microfluidic chamber. A cross-section of the construct is depicted with flow going into the page (y-axis). In the modular construct, endothelial cells line the entire surface of the channels and the topography (z-direction) or “thickness” of the channels along their length (y-direction) is uneven. In the microfluidic chamber, silicone analogues for the modules also block flow and force the fluid through channels; however, the channels have the same thickness throughout the length of the chamber and we examined only the cells attached to the fibronectin coated coverglass
Moreover, the endothelial cells in the modular construct were attached to a type I collagen module, creating differences in the underlying matrix. Others have shown that when exposed to high levels of shear (220 dyn cm−2), porcine aortic endothelial cells showed poorer adhesion strength to type I collagen and high adhesion strength to fibronectin; however, at shear stresses similar to our system (11 dyn cm−2), differences in cell adhesion were not as significant (Young et al. 2007). Moreover, fibronectin reduced apoptosis more than type I collagen (Fukai et al. 1998), which may mask the full effect of disturbed flow-induced cell death. Similarly, differences in matrix stiffness (fibronectin coated coverglass vs. collagen) can also alter the phenotype of the endothelial cells. Shape and cytoskeletal differences arise in single endothelial cells cultured on soft compared to hard substrates and these differences are eliminated when cells make cell-cell contact (Yeung et al. 2005). Initially, when endothelial cells are confluent monolayers within the flow chambers, differences should be minimal, however, when cell contact is lost during the process of cell turnover, differences may arise. Despite these differences, the microfluidic chamber was useful to address our questions about the effects of disturbed flow in a construct mimic and endothelial cell phenotype, as we were primarily interested in the tortuous flow patterns which emerged within the device.
The shear stress calculated by the Ergun equation, τ*, represented the average over the entire microfluidic chamber but did not describe the variation in local or regional shear stress. The endothelial cells in each of the nine regions within the chamber experienced different shear stresses (τcell) which were calculated from the COMSOL modeling and particle image velocimetry data. These τcell values were based on the average flow rate through each region and so was an average value for the region. The shear stress experienced by individual cells differs from this value due to spatial variation in fluid speed. However, due to the small size of these regions of interest, these variations were assumed to be small so that τcell remained a good estimate of regional shear stress.
4.2 Disturbed flow
When the boundary configuration permits, laminar flow is stable such that pressure and shear vary smoothly in space and time. Disturbed flow can arise if the configuration of the container (such as with the appearance of obstruction, branches, bends and expansions) becomes unsuitable for stable flow, resulting in boundary layer flow separation (Chang 1970; Yellin 1966). As a result, vortex systems develop near these regions of separation and, depending on the local geometry, may remain relatively stationary (stationary vortex) or may be convected along by the fluid stream (vortex shedding). The shed vortices are ultimately damped out by the viscous properties of the fluid (Fry 1968; Yellin 1966). When these disturbances occur in steady laminar flow, they can either subside or increase over time. If the disturbances decay with time, the main flow is considered stable. If they increase, the flow is considered unstable and there exists the possibility of transition to a turbulent pattern (Schlichting 1979). The many “modules” within our flow chamber and the resulting tortuous channels created conditions that were amenable to flow disturbances. Evidence of such disturbed flow was seen in several observations: e.g., disorganized VE-cadherin (Miao et al. 2005) in Fig. 4. In steady laminar flow, cells should align with fluid streamlines (Chiu et al. 1998), but this was not seen, as illustrated also in Fig. 5.
Following this evidence, the level of endothelial cell activation was expected to be higher. This would, in part, be manifested as an upregulation of ICAM-1 and VCAM-1, since both have been shown to be upregulated in disturbed flow (Brooks et al. 2002). However, a downregulation was observed in this system at the higher flow rate (Fig. 9). Though disturbed flow is associated with upregulated ICAM-1 and VCAM-1, unaligned cells, and disorganized VE-cadherin, our results suggest that the nature of VE-cadherin quality and cell alignment seen here are insufficient for the prediction of endothelium activation. Indeed, poor VE-cadherin quality can be caused by other events such as endothelial cell realignment and migration (Lampugnani et al. 1995; Noria et al. 1999).
Moreover, while higher laminar shear stress causes an upregulation of KLF2 and disturbed flow causes its down-regulation (Dekker et al. 2005; Wang et al. 2006), neither outcome was observed. Instead, KLF2 was found to be largely independent of flow conditions, as shown in Fig. 9. Clearly the flow in this system is complex and it was this complexity that was the initial impetus for this study.
4.3 Marker quantification
In addition to the morphological images (e.g. Figs. 4 and 5), the fluorescent intensity of each marker over the whole region or the whole chamber was quantified: this is IDV. Since all regions were analyzed by confocal microscopy at the same time it was possible to make quantitative comparisons of the fluorescent intensity at least in some restricted conditions. The gain, offset and magnification setting were constant for replicates and their controls. Moreover, images were always taken in the linear range of the fluorescent signal to ensure differential changes in expression could be seen, which would otherwise be lost in, for example, an oversaturated image. The fluorescent intensity of each marker in flow-conditioned chambers was normalized as a ratio to the corresponding static control. Hence, normalized IDV above one meant flow upregulated the marker while values below one indicated that flow downregulated the expression. With this normalization, marker expression changes over a longer time course were apparent as quantities that were comparable. With a common baseline and scale, values could also be averaged together for statistical analysis
In one mode of presentation, the fold change in IDV (averaged over replicate experiments) for each region was compared to that obtained in the other regions (Fig. 9), indicating which regions had the highest or lowest changes in marker expression and the difference between the high and low shear conditions. The total chamber values (Fig. 8) obscure regional differences but the effects of shear stress on the different markers are apparent. Flow chambers experiencing the lower 2.8 dyn cm−2 average shear stress showed, for the most part, no statistically significant expression changes as compared to static controls. In contrast, the larger average shear stress of 15.6 dyn cm−2 caused a downregulation in activation markers, as well as an undesired downregulation of VE-cadherin.
CFDA labeled THP-1 adhesion was also estimated by fluorescence imaging. The total number of nuclei was counted and the number of those cells that were CFDA positive was also counted to calculate “THP-1 coverage”: the percentage of endothelial cells in each region that had recruited and firmly attached THP-1 cells on their surface.
4.4 Marker expression
VE-cadherin expression appeared to correlate with KLF2 expression (p<0.01, Fig. 10), suggesting a possible link. Because VE-cadherin is part of a shear stress sensory complex (Tzima et al. 2005), downregulated and disorganized VE-cadherin may reduce the efficacy of the complex to sense shear stress. With this diminished ability to detect shear stress, KLF2 may not be upregulated as expected with higher shear stress (looking at the difference between the high and low shear conditions or at the regional differences). This may be caused by an insufficient amount of intracellular cAMP, a second messenger. Increases in cAMP can enhance VE-cadherin-mediated cell-cell adhesion (Fukuhara et al. 2005) and activate the cAMP-response element binding protein (Montminy and Bilezikjian 1987), which is a component of KLF2’s shear stress regulatory complex (Huddleson et al. 2005). In contrast, ICAM-1 expression is independent of cAMP while VCAM-1 expression is variable (Morandini et al. 1996), possibly explaining their continued sensitivity to shear.
The downregulation and disorganization of VE-cadherin was seen in all regions of the microfluidic chamber and was not limited to regions prone to disturbed flow. This blanket VE-cadherin response may have been caused by paracrine signaling within the chamber. For example, increased amounts of VEGF is produced by endothelial cells in disturbed flow-prone atherosclerotic lesions (Inoue et al. 1998). VEGF can act on adjacent endothelial cells through paracrine mechanisms (Bausero et al. 1998; Jackson et al. 2002) and increase endothelium permeability which is, in part, achieved by the disruption and endocytosis of VE-cadherin (Gavard and Gutkind 2006).
As expected, there was a strong correlation between ICAM-1 and VCAM-1 (Fig. 10). With respect to tuning the level of activation within the construct via the use of flow rates, we found that increasing the flow rate (and thus the average shear stress, τ*) within the flow chamber caused a downregulation in ICAM-1 and VCAM-1 expression, as compared to low flow and static controls (Fig. 9). Attempts were made to correlate regional marker expression with regional shear stresses (τcell), but no correlations emerged. On the other hand when expression was compared within devices (same flow) or among devices (different flows), regions that had the same local Re and τcell generally gave rise to the same marker expression level. Where it didn’t (e.g., VCAM-1 upregulated at the small contraction in devices at 2.8 dyn cm−2 but downregulated at the branch in devices at 15.6 dyn cm−2), it was thought that this reflected paracrine effects. When soluble paracrine signals are secreted by the endothelial cells, their transport and distribution may be affected by upstream or downstream regions. For the aforementioned branch and small contraction example, the branch experiences a small area of stagnation at the immediate point of bifurcation. This area may act to collect or concentrate soluble factors produced within the stagnation area. It would also prevent the convective transport of factors into and out of this area, resulting in diffusion dominated transport. Moreover, the nearest measured upstream region was the obstruction, which also showed a downregulation in VCAM-1 at day 6 and ICAM-1 at days 4 and 6, possibly indicating that quiescence may be propagated downstream. In contrast, the small contraction would experience full convective transport and the free dissemination of paracrine factors. The straight region, immediately upstream of the small contraction, also showed significantly more VCAM-1 expression at day 6 and ICAM-1 expression at day 2, which may be linked via paracrine signaling to the upregulation in the small contraction. Unique combinations like this highlight the importance of coupling upstream and downstream regions and the need to consider the entire system as a complex whole.
In addition to ICAM-1 and VCAM-1 marker expression, endothelial cell activation was also quantified by THP-1 coverage. This assesses the propensity of circulating leukocytes to roll and firmly attach to the endothelium which could ultimately result in transendothelial migration into the tissue and an undesired foreign body reaction. Flow reduced THP-1 coverage in the straight and obstruction regions, both of which were regions that showed no flow-induced reduction in ICAM-1 or VCAM-1 activation. The remaining regions showed no statistically significant differences in THP-1 coverage between static and flow cases. In the narrow bend and expansion regions there was a downregulation of VCAM-1 expression with flow, but this did not translate into a reduction in THP-1 coverage in these regions. Flow resulted in the node region having the greatest amount of THP-1 coverage. However, ICAM-1 and VCAM-1 expression showed no statistically significant differences in expression in the node region as compared to the other eight regions (Fig. 9). These discrepancies in cell adhesion molecule expression and THP-1 adhesion may be attributed to the many other molecules (such as E-selectin, P-selectin and PNAd (Carlos and Harlan 1994; Ulbrich et al. 2003)) that are involved in leukocyte attachment to the endothelium. Co-localization of these molecules with ICAM-1 and VCAM-1 could enhance the amount of THP-1 adhesion. For example, disturbed flow has been shown to greatly upregulate E-selectin (Brooks et al. 2002) and clustered monocyte cell adhesion was shown to correlate with endothelial cells coexpressing ICAM-1 and E-selectin in flow experiments (Burns and DePaola 2005).
4.5 Lessons for modular tissue engineering
The microfluidic chambers were intended as a diagnostic tool to ultimately aid in the development of a modularly assembled tissue-engineered construct. These experiments have revealed several operating conditions required for successful construct perfusion and the maintenance of a quiescent and functional endothelium. With higher construct-average shear stresses (τ*), leukocyte adhesion to the endothelium is low in straight and bifurcating channels while areas where multiple channels converge are likely to be the most prone to leukocyte recruitment, as observed in the THP-1 attachment experiment (Fig. 7). Using the mitigation of leukocyte attachment as a key design parameter, it follows that cell adhesion molecule expression should also be reduced. Though the THP-1 attachment and cell adhesion molecule expressions did not correlate, these molecules remain an integral component of leukocyte attachment and so any additional effort to prevent attachment would be desirable. Higher average shear stresses will achieve this downregulation, but will also result in poor quality VE-cadherin organization (as shown in Fig. 4) and its downregulation (Fig. 9). Lower average shear stresses gives superior VE-cadherin quality (as seen in Fig. 4) and an expression similar to static controls but does not benefit this system with respect to the downregulation of activation markers and the upregulation of KLF2 (Fig. 9). While the higher shear stress operating condition will downregulate activation in most areas, straight, small contraction and expansion regions may become upregulated, as suggested by our results (Fig. 9). Whether this will always occur or whether it is a result of upstream/downstream paracrine coupling is a question that needs further study. Similarly, it is necessary to determine if the differences in THP-1 attachment and marker expression in each region are influenced by upstream regions and paracrine coupling.
The fabrication of simpler devices where distinct configurations of interest (e.g., node, straight, small contraction and expansion regions, chosen for their high activation or THP-1 recruitment) are isolated or serially arranged may also be used to elucidate whether or not these are independent effects. It is also possible to further mine the data collected, for example by looking within smaller subregions for the relationship between local shear stress and direction, and marker expression. Additionally, it is necessary to determine how the disorganized and diminished VE-cadherin affects construct performance. Furthermore, instead of random self-assembly, directed assembly through the use of shape-controlled modules (Du et al. 2008) may also be fruitful in that they may help form channels that experience less disturbed flow. Finally, in order to validate the results from this work, we have begun perfusion studies of actual endothelial cell-containing modular constructs (Khan and Sefton 2010).
5 Conclusions
A microfluidic mimic of the tortuous channels in a modular tissue engineering construct enabled a detailed analysis of the effect of shear stress and flow obstructions on endothelial cell phenotype. VE-cadherin expression and distribution was adversely affected by the resulting flow disturbances and KLF2 changes were surprisingly modest while higher average shear stresses/flow rates appeared to attenuate ICAM-1 and VCAM-1 expression. On the other hand regions where several channels converged into a single outlet are likely to be the most prone to leukocyte attachment, as evidenced by THP-1 adhesion studies. The microfluidic chamber allowed us to begin to understand the effect of flow on endothelial cells in a complex system. The experimental advantages of this approach are to be exploited in yet more complex co-culture systems.
Acknowledgments
The authors acknowledge the financial support of the Natural Sciences and Engineering Research Council, the Canadian Institutes of Health Research and the US National Institutes of Health (EB 001013). O.F. Khan acknowledges scholarship support from the Ontario Graduate Scholarship Program. The authors thank Alison P. McGuigan for the μCT images used in this study.
Contributor Information
Omar F. Khan, Email: of.khan@utoronto.ca, Department of Chemical Engineering and Applied Chemistry, and Institute of Biomaterials and Biomedical Engineering, University of Toronto, Toronto, Ontario, Canada, Donnelly Centre for Cellular and Biomolecular Research, University of Toronto, 160 College Street, Room 440, Toronto, Ontario, Canada M5S 3E1
Michael V. Sefton, Email: michael.sefton@utoronto.ca, Department of Chemical Engineering and Applied Chemistry, and Institute of Biomaterials and Biomedical Engineering, University of Toronto, Toronto, Ontario, Canada, Institute of Biomaterials and Biomedical Engineering, University of Toronto, 164 College Street, Suite 407, Toronto, Ontario, Canada M5S 3G9
References
- Akeson AL, Woods CW. J Immunol Methods. 1993;163:181. doi: 10.1016/0022-1759(93)90121-m. [DOI] [PubMed] [Google Scholar]
- Barkefors I, Le Jan S, Jakobsson L, et al. J Biol Chem. 2008;283:13905. doi: 10.1074/jbc.M704917200. [DOI] [PubMed] [Google Scholar]
- Bausero P, Cavaille F, Meduri G, et al. Angiogenesis. 1998;2:167. doi: 10.1023/a:1009292506879. [DOI] [PubMed] [Google Scholar]
- Berk BC. Circulation. 2008;117:1082. doi: 10.1161/CIRCULATIONAHA.107.720730. [DOI] [PubMed] [Google Scholar]
- Brooks AR, Lelkes PI, Rubanyi GM. Physiol Genomics. 2002;2002:27. doi: 10.1152/physiolgenomics.00075.2001. [DOI] [PubMed] [Google Scholar]
- Burns MP, DePaola N. Am J Physiol Heart Circ Physiol. 2005;288 doi: 10.1152/ajpheart.01078.2003. [DOI] [PubMed] [Google Scholar]
- Carlos TM, Harlan JM. Blood. 1994;84:2068. [PubMed] [Google Scholar]
- Chang PK. Separation of Flow. Pergamon; Oxford: 1970. [Google Scholar]
- Chau L, Doran M, Cooper-White J. Lab Chip. 2009;9:1897. doi: 10.1039/b823180j. [DOI] [PubMed] [Google Scholar]
- Chen CN, Chang SF, Lee PL, et al. Blood. 2006;107:1933. doi: 10.1182/blood-2005-08-3137. [DOI] [PMC free article] [PubMed] [Google Scholar]
- Cheng C, Helderman F, Tempel D, et al. Atherosclerosis. 2007;195:225. doi: 10.1016/j.atherosclerosis.2006.11.019. [DOI] [PubMed] [Google Scholar]
- Chien S. Ann Biomed Eng. 2008;36:554. doi: 10.1007/s10439-007-9426-3. [DOI] [PMC free article] [PubMed] [Google Scholar]
- Chiu JJ, Wang DL, Chien S, et al. J Biomech Eng. 1998;120:2. doi: 10.1115/1.2834303. [DOI] [PubMed] [Google Scholar]
- Corada M, Mariotti M, Thurston G, et al. Proc Natl Acad Sci U S A. 1999;96:9815. doi: 10.1073/pnas.96.17.9815. [DOI] [PMC free article] [PubMed] [Google Scholar]
- Cunningham KS, Gotlieb AI. Lab Invest. 2005;85:9. doi: 10.1038/labinvest.3700215. [DOI] [PubMed] [Google Scholar]
- Dekker RJ, Van Soest S, Fontijn RD, et al. Blood. 2002;100:1689. doi: 10.1182/blood-2002-01-0046. [DOI] [PubMed] [Google Scholar]
- Dekker RJ, Van Thienen JV, Rohlena J, et al. Am J Pathol. 2005;167:609. doi: 10.1016/S0002-9440(10)63002-7. [DOI] [PMC free article] [PubMed] [Google Scholar]
- Dekker RJ, Boon RA, Rondaij MG, et al. Blood. 2006;107:4354. doi: 10.1182/blood-2005-08-3465. [DOI] [PubMed] [Google Scholar]
- Du Y, Lo E, Ali S, et al. Proc Natl Acad Sci U S A. 2008;105:9522. doi: 10.1073/pnas.0801866105. [DOI] [PMC free article] [PubMed] [Google Scholar]
- Duffy DC, McDonald JC, Schueller OJA, et al. Anal Chem. 1998;70:4974. doi: 10.1021/ac980656z. [DOI] [PubMed] [Google Scholar]
- Fiddes LK, Raz N, Srigunapalan S, et al. Biomaterials. 2010;31:3459. doi: 10.1016/j.biomaterials.2010.01.082. [DOI] [PubMed] [Google Scholar]
- Fledderus JO, Van Thienen JV, Boon RA, et al. Blood. 2007;109:4249. doi: 10.1182/blood-2006-07-036020. [DOI] [PubMed] [Google Scholar]
- Fox RW, McDonald AT. Introduction to Fluid Mechanics. 4. Wiley; Toronto: 1992. [Google Scholar]
- Fry DL. Circ Res. 1968;22:165. doi: 10.1161/01.res.22.2.165. [DOI] [PubMed] [Google Scholar]
- Fukai F, Mashimo M, Akiyama K, et al. Exp Cell Res. 1998;242:92. doi: 10.1006/excr.1998.4076. [DOI] [PubMed] [Google Scholar]
- Fukuhara S, Sakurai A, Sano H, et al. Mol Cell Biol. 2005;25:136. doi: 10.1128/MCB.25.1.136-146.2005. [DOI] [PMC free article] [PubMed] [Google Scholar]
- Fung JJ. Transplantation. 2004;77:S41. doi: 10.1097/01.tp.0000126926.61434.a5. [DOI] [PubMed] [Google Scholar]
- Gavard J, Gutkind JS. Nat Cell Biol. 2006;8:1223. doi: 10.1038/ncb1486. [DOI] [PubMed] [Google Scholar]
- Hsu PP, Li S, Li YS, et al. Biochem Biophys Res Commun. 2001;285:751. doi: 10.1006/bbrc.2001.5221. [DOI] [PubMed] [Google Scholar]
- Huddleson JP, Ahmad N, Srinivasan S, et al. J Biol Chem. 2005;280:23371. doi: 10.1074/jbc.M413839200. [DOI] [PubMed] [Google Scholar]
- Imberti B, Seliktar D, Nerem RM, et al. Endothelium. 2002;9:11. doi: 10.1080/10623320210714. [DOI] [PubMed] [Google Scholar]
- Inoue M, Itoh H, Ueda M, et al. Circulation. 1998;98:2108. doi: 10.1161/01.cir.98.20.2108. [DOI] [PubMed] [Google Scholar]
- Jackson MW, Roberts JS, Heckford SE, et al. Cancer Res. 2002;62:854. [PubMed] [Google Scholar]
- Khan OF, Sefton MV. Biomaterials. 2010;31:8254. doi: 10.1016/j.biomaterials.2010.07.041. [DOI] [PMC free article] [PubMed] [Google Scholar]
- Krakauer T. Immunol Lett. 1995;45:61. doi: 10.1016/0165-2478(94)00226-h. [DOI] [PubMed] [Google Scholar]
- Lampugnani MG, Corada M, Caveda L, et al. J Cell Biol. 1995;129:203. doi: 10.1083/jcb.129.1.203. [DOI] [PMC free article] [PubMed] [Google Scholar]
- Ley K. Cardiovasc Res. 1996;32:733. [PubMed] [Google Scholar]
- McDonald JC, Whitesides GM. Acc Chem Res. 2002;35:491. doi: 10.1021/ar010110q. [DOI] [PubMed] [Google Scholar]
- McGuigan AP, Sefton MV. Proc Natl Acad Sci USA. 2006;103:11461. doi: 10.1073/pnas.0602740103. [DOI] [PMC free article] [PubMed] [Google Scholar]
- McGuigan AP, Sefton MV. Tissue Eng. 2007;13:1079. doi: 10.1089/ten.2006.0245. [DOI] [PubMed] [Google Scholar]
- McGuigan AP, Sefton MV. Biomaterials. 2008;29:2453. doi: 10.1016/j.biomaterials.2008.02.010. [DOI] [PMC free article] [PubMed] [Google Scholar]
- Miao H, Hu YL, Shiu YT, et al. J Vasc Res. 2005;42:77. doi: 10.1159/000083094. [DOI] [PubMed] [Google Scholar]
- Montminy MR, Bilezikjian LM. Nature. 1987;328:175. doi: 10.1038/328175a0. [DOI] [PubMed] [Google Scholar]
- Morandini R, Ghanem G, Portier-Lemarie A, et al. Am J Physiol Heart Circ Physiol. 1996;270:H807. doi: 10.1152/ajpheart.1996.270.3.H807. [DOI] [PubMed] [Google Scholar]
- Noria S, Cowan DB, Gotlieb AI, et al. Circ Res. 1999;85:504. doi: 10.1161/01.res.85.6.504. [DOI] [PubMed] [Google Scholar]
- Parmar KM, Larman HB, Dai G, et al. J Clin Invest. 2006;116:49. doi: 10.1172/JCI24787. [DOI] [PMC free article] [PubMed] [Google Scholar]
- Prabhakarpandian B, Pant K, Scott RC, et al. Biomed Micro-devices. 2008;10:585. doi: 10.1007/s10544-008-9170-y. [DOI] [PMC free article] [PubMed] [Google Scholar]
- Reinhardt PH, Kubes P. Blood. 1998;92:4691. [PubMed] [Google Scholar]
- Rhodes M. Introduction to Particle Technology. 2. Wiley; Chichester: 2008. [Google Scholar]
- Sakariassen KS, Aarts PAMM, De Groot PG. J Lab Clin Med. 1983;102:522. [PubMed] [Google Scholar]
- Schaff UY, Xing MMQ, Lin KK, et al. Lab Chip. 2007;7:448. doi: 10.1039/b617915k. [DOI] [PubMed] [Google Scholar]
- Schlichting H. Boundary-Layer Theory. 7. McGraw-Hill Book Company; New York: 1979. [Google Scholar]
- SenBanerjee S, Lin Z, Atkins GB, et al. J Exp Med. 2004;199:1305. doi: 10.1084/jem.20031132. [DOI] [PMC free article] [PubMed] [Google Scholar]
- Song JW, Gu W, Futai N, et al. Anal Chem. 2005;77:3993. doi: 10.1021/ac050131o. [DOI] [PubMed] [Google Scholar]
- Tkachenko E, Gutierrez E, Ginsberg MH, et al. Lab Chip. 2009;9:1085. doi: 10.1039/b812184b. [DOI] [PMC free article] [PubMed] [Google Scholar]
- Tsao PS, Lewis NP, Alpert S, et al. Circulation. 1995;92:3513. doi: 10.1161/01.cir.92.12.3513. [DOI] [PubMed] [Google Scholar]
- Tsao PS, Buitrago R, Chan JR, et al. Circulation. 1996;94:1682. doi: 10.1161/01.cir.94.7.1682. [DOI] [PubMed] [Google Scholar]
- Tzima E, Irani-Tehrani M, Kiosses WB, et al. Nature. 2005;437:426. doi: 10.1038/nature03952. [DOI] [PubMed] [Google Scholar]
- Ulbrich H, Eriksson EE, Lindbom L. Trends Pharmacol Sci. 2003;24:640. doi: 10.1016/j.tips.2003.10.004. [DOI] [PubMed] [Google Scholar]
- Van Der Meer AD, Vermeul K, Poot AA, et al. Am J Physiol Heart Circ Physiol. 2010;298:H719. doi: 10.1152/ajpheart.00933.2009. [DOI] [PubMed] [Google Scholar]
- Walpola PL, Gotlieb AI, Cybulsky MI, et al. Arterioscler Thromb Vasc Biol. 1995;15:2. doi: 10.1161/01.atv.15.1.2. [DOI] [PubMed] [Google Scholar]
- Wang N, Miao H, Li YS, et al. Biochem Biophys Res Commun. 2006;341:1244. doi: 10.1016/j.bbrc.2006.01.089. [DOI] [PubMed] [Google Scholar]
- Yellin EL. Circ Res. 1966;19:791. doi: 10.1161/01.res.19.4.791. [DOI] [PubMed] [Google Scholar]
- Yeung T, Georges PC, Flanagan LA, et al. Cell Motil Cytoskeleton. 2005;60:24. doi: 10.1002/cm.20041. [DOI] [PubMed] [Google Scholar]
- Young EWK, Simmons CA. Lab Chip. 2010;10:143. doi: 10.1039/b913390a. [DOI] [PubMed] [Google Scholar]
- Young EW, Wheeler AR, Simmons CA. Lab Chip. 2007;7:1759. doi: 10.1039/b712486d. [DOI] [PubMed] [Google Scholar]
- Yuan H, Goetz DJ, Gaber MW, et al. Radiat Res. 2005;163:544. doi: 10.1667/rr3361. [DOI] [PubMed] [Google Scholar]