Abstract
Certain insects (e.g., moths and butterflies; order Lepidoptera) and nematodes are considered as excellent experimental models to study the cellular stress signaling mechanisms since these organisms are far more stress-resistant as compared to mammalian system. Multiple factors have been implicated in this unusual response, including the oxidative stress response mechanisms. Radiation or chemical-induced mitochondrial oxidative stress occurs through damage caused to the components of electron transport chain (ETC) leading to leakage of electrons and generation of superoxide radicals. This may be countered through quick replacement of damaged mitochondrial proteins by upregulated expression. Since the ETC comprises of various proteins coded by mitochondrial DNA, variation in the composition, expressivity and regulation of mitochondrial genome could greatly influence mitochondrial role under oxidative stress conditions. Therefore, we carried out in silico analysis of mitochondrial DNA in these organisms and compared it with that of the stress-sensitive humans/mammals. Parameters such as mitochondrial genome organization, codon bias, gene expressivity and GC3 content were studied. Gene arrangement and Shine-Dalgarno (SD) sequence patterns indicating translational regulation were distinct in insect and nematodes as compared to humans. A higher codon bias (ENC≫35) and lower GC3 content (≫0.20) were observed in mitochondrial genes of insect and nematodes as compared to humans (ENC>42; GC3>0.20), coupled with low codon adaptation index among insects. These features indeed favour higher expressivity of mitochondrial proteins and might help maintain the mitochondrial physiology under stress conditions. Therefore, our study indicates that mitochondrial genome organization may influence stress-resistance of insects and nematodes.
Keywords: mitochondrial genome, codon bias, stress resistance, insects, nematodes
Background
A number of physical/chemical stress agents increase the cellular ROS/RNS pool and subsequently cause significant biomolecular damage. Since mitochondria are a major source of cellular ROS/RNS, successful maintenance of a healthy cellular redox state through mitochondrial tolerance is considered an important determinant of cellular fate under such conditions. Stress-induced increase in mitochondrial ROS/RNS generation occurs mainly through damage caused to the components of electron transport chain (ETC), thereby resulting in leakage of electrons and the subsequent formation of superoxide radical. This damage may be countered through increase in expression and replacement of the damaged proteins by the newly synthesized functional molecules. Since the ETC comprises of various proteins coded by mitochondrial DNA, variation in the composition, expressivity and regulation of mitochondrial DNA (mt‐ DNA) could prominently influence the mitochondrial tolerance towards oxidative stress conditions.
Mitochondrial DNA is a closed circular molecule which codes for two rRNAs, all 22 species of tRNAs required for translation, and 13 proteins that are essential for proper mitochondrial functioning, primarily the proteins coding for oxidative phosphorylation, viz., NADH dehydrogenase subunit 1‐6 (ND1‐6) and 4L (ND4L), Cytochrome-c oxidase subunit 1‐3 (COX1‐3), ATP subunit 6 and 8, and Cytochrome-B (CYTB). Since the mitochondrial genome codes for a number of proteins participating in oxidative phosphorylation and also all tRNAs, it is pertinent to expect that evolutionary variations known to occur in the organization and functioning/ regulation of mitochondrial genome amongst different organisms [1, 2,3 ,4] may also cause variation in the mitochondrial functions including their role in cellular stress response.
The mitochondrion-encoded genes are highly conserved but are reported to differ in their codon bias. [5,6, 7]Since the higher basal gene expression is reportedly associated with higher codon bias [8] differences in the codon bias within Mt-DNA may also result in differential expression of mitochondrial genes. The different patterns of codon usage bias may be due to mutation bias, variation in GC content and/or various forms of natural selection, viz., to optimize the efficiency or accuracy of translation and/or to maintain sequence composition of mRNA/DNA [9] In addition to translational regulation mechanisms that may control stress response, mitochondria have been known to undergo biogenesis following cellular stress [10, 11] which is marked by an increase in the mitochondrial mass. [12, 13,14] Under these conditions of stress-induced biogenesis as well, the cellular machinery may try to raise expression level of certain mitochondrial coding genes, which is also associated with increased expression of the tRNA pool [15] Therefore, mitochondrial gene expressivity and its regulation by codon usage bias warrants further investigations for understanding their role in the mitochondria-mediated stress responses.
Certain insects (e.g. moths and butterflies; order Lepidoptera) and nematodes are considered as excellent experimental models to study the cellular and molecular signaling pathways. Despite high level of conservation in the molecular and cellular factors involved in stresssignaling, these organisms are far more stress-resistant as compared to mammalian system. Therefore, we carried out in silico analysis of the mtDNA and its encoded proteins in these organisms and compared it with that of the stress-sensitive humans/mammals. The study indicates significant differences in the composition (gene arrangement and nucleotide composition), ENC value and GC3 content between the mt- DNA of mammals and insects/nematodes. Based on these observations, we hypothesize that besides the other cellular and molecular factors reportedso far [16] certain features of mitochondrial genome organization may also influence the responses of these stress-resistant invertebrates.
Methodology
Sequences retrieval and data analysis
Nucleotide sequences were obtained from National Center for Biotechnology Information (http://www.ncbi.nlm.nih.gov). Full mitochondrial genomes of Aedes aegypti (NC_010241), Apis mellifera (NC_001566), Bombyxmori (NC_002355), Drosophila melanogaster (NC_001709), Manduca sexta (NC_010266), Oxya chinensis (NC_010219), Periplaneta fuliginosa (NC_006076), Tribolium castaneum (NC_003081), Mytilus edulis (NC_006161), Sepia officinalis (NC_007895), Caenorhabditis elegans (NC_001328), Xenopus laevis (NC_001573), Pista cristata (NC_011011), Rhabdocalyptus dawsoni (NC_009627), Crocodylus siamensis (NC_008795), Gallus gallus (NC_001323) and Homo sapiens (NC_001807) were chosen and retrieved from the nucleotide database of NCBI for initial analysis. Also we found the open reading frame (ORF), the individual genes were utilizing, using ORF Finder (http://www.ncbi.nlm.nih.gov/projects/gorf/). The arrangements of their protein coding genes were retrieved from NCBI's genome database.
Codon bias analysis
The initial codon bias data were retrieved from an online tool CodonO (http://www.sysbiology.org/CodonO) for initial comparative study of SCU between insects and mammals. Sequences of Bombyx mori, Manduca sexta and Homo sapiens were submitted for analysis and invertebrate and vertebrate mitochondrial codon tables were used as required. The average codon bias for individual amino acids in each species was determined. Since the data on codon usage bias is unnecessarily complex for analysis, it has been expressed in terms of ENC (Effective Number of Codons) value, as a statistical measure proposed by Frank Wright in 1990. The value of ENC ranges from 20 to 61 and is inversely related to the codon usage bias. A gene having 100% codon bias will have the ENC value = 20 and a gene with 0% codon bias will show an ENC value = 61. This shares an analogy with the behavior of multiple alleles; an amino acid with four synonymous codons can be considered analogous to a locus with four alleles.[9]
Where F1, F2, F3 etc. are the average homozygosity estimates for Synonymous Family (SF) type ‘i’, and n1, n2, n3 etc. are the contributions of each of the SF type. Average ENC was calculated for each species by taking average value for each protein coding gene.
Codon Adaptation Index (CAI) is a measure of the relative adaptation of codon usage of a gene towards the codon usage of highly expressed genes, or in other words, measures the degree to which selection has been effective in moulding the pattern of codon usage. [17] A higher CAI value (>0.5) indicates that the gene is well expressed and a CAI value ≫0.3 is an indicator of low expression [18] To calculate the codon usage we used another online tool Mobyle ( http://mobyle.pasteur.fr/cgibin/MobylePortal/portal.py), which allows computing of multiple indexes related to codon usage such as ENC, CAI, and GC3 values. (see supplementary material for details on ENC).
Analysis of Shine-Dalgarno (SD) sequences
The sequences of protein-coding mitochondrial genes coding for the 5'UTR of the translation start site from the four species (M. sexta, B. mori, C.elegans and H. sapiens) were transformed to respective RNA sequence and aligned using CLC Workbench 4. Annotations from NCBI Genbank files were used to find the upstream sequences for the 13 proteins in each sequence. A length of 100 bp preceding the gene was chosen for analysis and conserved consensus sequences from SD sequence such as UUUC, AAAUU, GAAU, and GAUU [19] were spotted.
Discussion
Codon bias: ENC, CAI and GC3 content variation in insects, nematodesand mammals:
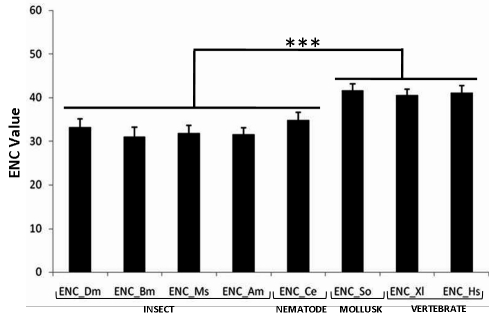
The codon bias data were firstly analyzed in terms of average ENC value. Quite significantly, the average ENC values were found to be lowest (i.e., highest codon bias) for insects and nematodes amongst all the organisms evaluated, while the higher value derived for Homo sapiens implies significantly lower codon bias Figure 1 This feature of insect mitochondrial genes was in contrast to that of the nuclear genome encoded ribosomal genes of Spodoptera frugiperda (Lepidopteran insect) which is unusually unbiased. [20] The ENC value for C. elegans was equal to that of D. melanogaster and almost equal to that of Bombyx mori and Manduca sexta indicating similar nature of mitochondrial genes of all these species, which is quite different from Homo sapiens. Since high codon bias promotes high expression level of genes [8] and thereby assists the cells to fight stress conditions [10] the low codon bias in human mitochondrion may be a possible indicator of low resistance against stressors.
Figure 1.
Average ENC values for D.melanogaster (Insecta: Diptera), B.mori (Insecta: Lepidoptera), M.sexta (Insecta: Lepidopteran), A.mellifera (Insecta: Hymenoptera), C.elegans (Nematoda: Rhabditida), S.officinalis (Mollusca: Sepiida), X.laevis (Amphibia), H.sapiens (Mammalia). Average of all ENC values derived from all 13 protein coding genes present in each species. Statistically significant difference in ENC value was observed between insect-nematode group and mollusca-amphibia-mammal group.
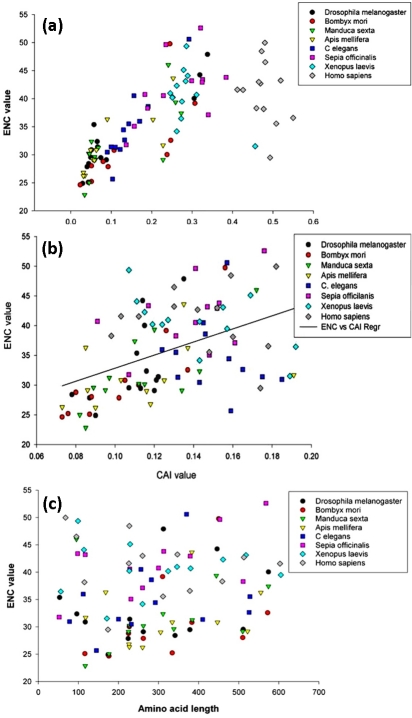
A scatter-plot of ENC values vs GC3 content was also drawn for these species for all the 13 conserved protein-coding mitochondrial genes [Figure 2a]. The dispersion of dots for majority of genes in Apis mellifera, Bombyx mori, Drosophila melanogaster, Manduca sexta as well as for Caenorhabditis elegans clustered mainly between 20≫ ENC ≫35 and 0.0≫ GC3 ≫0.2, indicating a high degree of similarity in the regulation of their expression. As the complexity of the organisms increased, an increase in the GC3 content could be observed clearly in the following order-Insecta (A. mellifera, B. mori, D. melanogaster, M. sexta) ≫ Nematoda (C. elegans) ≫ Mollusca (S. officinalis) ≫ Amphibia (X. laevis) ≫ Mammalia (H. sapiens). In addition, an increase in the variation of ENC value could be observed with the increasing complexity of organisms [Figure 2a]. This may be correlated with the fact that the genes become unbiased with the GC3 content reaching a value of 0.5 [9] and genes move biased as GC3 content shifts either side from 0.5. The drastic difference between GC3 content of humans/mammals versus insects or nematodes strongly correlates with the anomalously high mitochondrial GC content (44%) of Homo sapiens against the low GC content of the insect and nematode species (18‐25%) (Table 1). This also suggests that the third codon position may involve similarity while first and second codon positions are expected to bear more selective stress for holding their function.
Figure 2.
Inter-relationships of ENC values with CAI, GC3 content and amino acid length of mitochondrial proteins. (a) Scatter plot of ENC value vs CAI value of conserved protein coding genes from representative species of various phyla. (b) Scatter plot of ENC value vs GC3 content of conserved protein coding genes from representative species of various phyla. (c) Scatter plot of ENC value vs amino acid length value of conserved protein coding genes from representative species of various phyla.
Codon bias is known to be directly linked to the tRNA pool [15] While microorganisms share the same tRNA pool and thus attain the single most optimal codon usage pattern [4] Mt-DNA codes for only 22 tRNA species out of 60 tRNA's reported in eukaryotes. Although these 22 tRNA species are sufficient for expressing proteins depending on their availability, they may also impart codon bias. Apart from the Mt-DNA encoded tRNA species, tRNA's coded by nuclear DNA can also be imported from cytosol. In addition to the tRNA availability, adaptation of a particular t-RNA for related amino acid may also contribute in codon bias. Hence analysis of codon adaptive index (CAI) can also provide important insight into this phenomenon. CAI reflects the ‘ weight’ (representing the relative adaptation) for each codon from its frequency within a chosen small pool of highly expressed genes, and combines these weights to define the CAI of the gene. [21] A recent study has concluded that a gene showing a CAI≫0.318 should be considered with low expression and a gene with CAI>0.502 should be considered as highly expressed. [18] This result is independent of any ENC value consideration; hence a gene with high CAI should be expected to have a high bias and vice versa. Genes that show above kind of variation in CAI and ENC value may be considered to show an expected or ‘ usual’ behavior. [18] Similarly, a group of genes with low CAI but a high bias and a group of genes with high CAI and low bias show ‘unusual’ behavior. In the present study, we plotted ENC value against CAI values of mitochondrial protein-coding genes in all the species takenunder consideration. Interestingly, majority of mitochondrial genes showed an ‘ unusual’ behavior. The CAI for all mitochondrial genes was less than 0.20 in all the species and ENC for the majority of genes from insect and nematode species was less than 37 denoting a high bias [Figure 2b]. Therefore, since the mitochondrial genes are highly expressed it may be safe to infer that the mitochondrial genome regulation is different from that of the nuclear genome.
A relation between the codon bias and the length of the coding gene has been spotted in a few cases. [22] Assume a non-optimal codon requires double the time to translate into an amino acid in comparison to optimal codon. In a small gene (say 100 codons), one mutation from an optimal codon to non-optimal codon increases the time of translation by 1%, whereas a similar mutation in a gene with larger number of codons (say 1000 codons) would only increase the translation time by 0.1% . [23]Alternatively the length effect could be explained by the fact that highly expressed genes tend to be short. Therefore, we plotted the ENC value for different species against their corresponding protein lengths coded by them [Figure 2c]. No significant difference could be observed in the plot apart from the difference in ENC values. This can be understood by considering that the coded proteins are highly conserved across these species tested despite variations at the genomic or codon level, and thus the same proteins would have almost the same structure and function in different species.
Protein-coding mitochondrial gene arrangement varies significantly between invertebrates and vertebrates
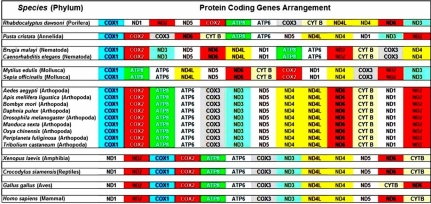
All the sequences obtained for initial analysis were found to code for 13 proteins namely ND1‐6, ND4L, COX1‐3, ATP6, ATP8 and CYT B and the genes ND1, ND4, ND4L and ND5. The arrangement of these proteincoding genes for different species showed a highly conserved pattern within each specific phylum (supplemeSupplementary Figure 1). Changes in the position of these genes within the mitochondrial genome reflect variations acquired during evolution of mt-DNA in the divergent species. The diversity in genes and genomes is known to occur through the complex processes of evolution including mutations, random drift and natural selection, gene rearrangements. However, these are considered to be rare evolutionary events, and as such the existence of a shared derived gene order between taxa most often indicates a common ancestry. [1] As evident from the supplementary Figure 1, changes in the sequences of proteincoding mitochondrial genes become more stagnant among vertebrates unlike the invertebrates where significant variations in the sequence arrangement could be seen. This indicates that the invertebrate mitochondria may have been under a heavy selection pressure compared with the vertebrate mitochondria.
Shine-Dalgarno sequences also show distinct pattern in the insect and nematode mitochondrial genomes
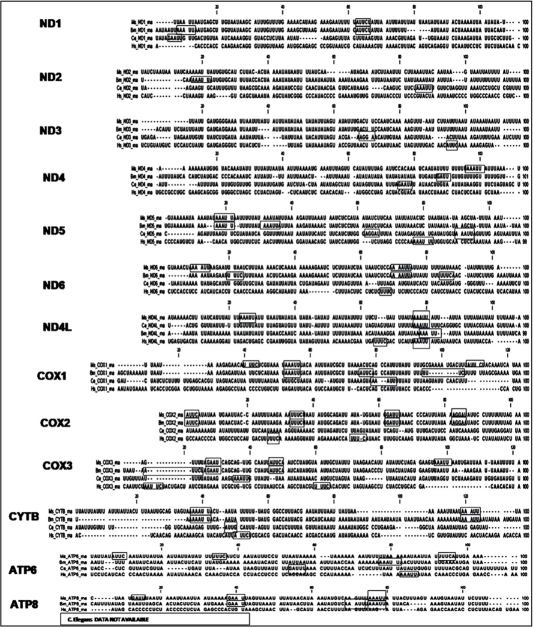
Mitochondrial gene/protein expression is known to be similar to prokaryotes. Like prokaryotic mRNA, the mitochondrial gene encoded mRNA is also known to contain Shine-Dalgarno sequence, responsible for recognition by ribosomes during translation. [24] We examined the Shine- Dalgarno (AAAUU, GAAU, UUUC and AUUC) sequences in the upstream region of mRNA’s from all 13 candidate mitochondrial genes. A remarkable conservation in the Shine-Dalgarno sequence patterns could be found among the upstream regions of Manduca sexta, Bombyx mori, and C. elegans Figure 4. The SD sequences found in Homo sapiens did not show same pattern as observed in these insect and nematode species tested. These variations in the upstream sequence patterns indicate evolutionary changes that may have been incorporated suitably by different organisms during evolution, and may even contribute in the stress resistance of insects and nematodes through higher expressivity of mitochondrial proteins.
Figure 4.
SD sequences in the upstream region of protein coding genes (Bombyx mori, Manduca sexta, C. elegans and Homo sapiens). Rectangular boxes over the sequences mark the position of SD sequences in the respective upstream region.
Conclusion
The present study indicates that mitochondrial genome of insects and nematodes displays unique characteristics such as high codon bias, low GC3 content and highly conserved gene arrangement, which are associated with a well conserved pattern of SD sequences in the transcripts of mitochondrial functional proteins. Some of these features may favour higher expressivity of mitochondrial proteins, thereby maintaining mitochondrial physiology under extreme conditions and potentially leading to increased stress resistance. This is the first study that highlights noticeable features within the mitochondrial genomes of these highly stress-resistant organisms, and warrants more in-depth investigations.
Supplementary material
figure 3.
Rearrangement of protein coding genes in mitochondrial genome of different animal species ranging up to mammals
Acknowledgments
This study was conducted as part of the R&D project INM-311.1.5 funded by DRDO, Ministry of Defence, Government of India. Authors duly acknowledge the encouraging support received from Dr. RP Tripathi, Director INMAS.
Footnotes
Citation:Pandey, Bioinformation 5(1): 21-27 (2010)
References
- 1.Boore JL. Nucleic Acid Research. 1999;27:1767. doi: 10.1093/nar/27.8.1767. [DOI] [PMC free article] [PubMed] [Google Scholar]
- 2.Hudspeth MES. Marcel Dekker Inc NewYork. 1992 [Google Scholar]
- 3.Palmer JD. Trends Gene. 1990;4:115. doi: 10.1016/0168-9525(90)90125-p. [DOI] [PubMed] [Google Scholar]
- 4.Gray MW, et al. Science. 1999;283:1476. doi: 10.1126/science.283.5407.1476. [DOI] [PubMed] [Google Scholar]
- 5.Eisenberg E, Levanon EY. Trends in genetics. 2003;19:362. doi: 10.1016/S0168-9525(03)00140-9. [DOI] [PubMed] [Google Scholar]
- 6.Voss Joachim G, et al. Biological Research for Nursing. 2008;9:272. doi: 10.1177/1099800408315160. [DOI] [PMC free article] [PubMed] [Google Scholar]
- 7.Razeghi P, et al. Circulation. 2001;104:2923. doi: 10.1161/hc4901.100526. [DOI] [PubMed] [Google Scholar]
- 8.Duret L, Mouchiroud D. Pro Natl Acad Sci USA. 1999;96:4482. doi: 10.1073/pnas.96.8.4482. [DOI] [PMC free article] [PubMed] [Google Scholar]
- 9.Wright F. Gene. 1990;87:23. doi: 10.1016/0378-1119(90)90491-9. [DOI] [PubMed] [Google Scholar]
- 10.Garesse R. Genetics. 1987;118:649. doi: 10.1093/genetics/118.4.649. [DOI] [PMC free article] [PubMed] [Google Scholar]
- 11.McCabe TC, et al. Plant Biology. 2000;2:121. [Google Scholar]
- 12.Lopez-Lluch G, et al. Exp Gerontol. 2008;43:813. doi: 10.1016/j.exger.2008.06.014. [DOI] [PMC free article] [PubMed] [Google Scholar]
- 13.Tiao MM, et al. Apoptosis. 2009;14:890. doi: 10.1007/s10495-009-0357-3. [DOI] [PubMed] [Google Scholar]
- 14.Rimbaud S, et al. Pharmacol Rep. 2009;61:131. doi: 10.1016/s1734-1140(09)70015-5. [DOI] [PubMed] [Google Scholar]
- 15.Duchêne AM, et al. Curr Genet. 2009;55:1. doi: 10.1007/s00294-008-0223-9. [DOI] [PubMed] [Google Scholar]
- 16.Chandna S, et al. Int J Rad Biol. 2004;80:301. doi: 10.1080/09553000410001679794. [DOI] [PubMed] [Google Scholar]
- 17.Sharp PM, Li WH. Nucleic Acids Res. 1987;15:1281. doi: 10.1093/nar/15.3.1281. [DOI] [PMC free article] [PubMed] [Google Scholar]
- 18.Basak S, et al. Bioinformation. 2008;3:213. doi: 10.6026/97320630003213. [DOI] [PMC free article] [PubMed] [Google Scholar]
- 19.Marintchev A, Wagner G. Q Rev Biophys. 2005;37:197. doi: 10.1017/S0033583505004026. [DOI] [PubMed] [Google Scholar]
- 20.Landais I, et al. Bioinformatics. 2003;19:2343. doi: 10.1093/bioinformatics/btg324. [DOI] [PubMed] [Google Scholar]
- 21.Carbone A, et al. Bioinformatics. 2003;19:2005. doi: 10.1093/bioinformatics/btg272. [DOI] [PubMed] [Google Scholar]
- 22.Eyre-Walker A. Molecular Biology and Evolution. 1996;13:864. doi: 10.1093/oxfordjournals.molbev.a025646. [DOI] [PubMed] [Google Scholar]
- 23.Powell JR, Moriyama EN. Proc Natl Acad Sci. 1997;94:7784. doi: 10.1073/pnas.94.15.7784. [DOI] [PMC free article] [PubMed] [Google Scholar]
- 24.Hazle T, Bonen L. Mol Bio Evol. 2007;24:1101. doi: 10.1093/molbev/msm030. [DOI] [PubMed] [Google Scholar]
Associated Data
This section collects any data citations, data availability statements, or supplementary materials included in this article.


