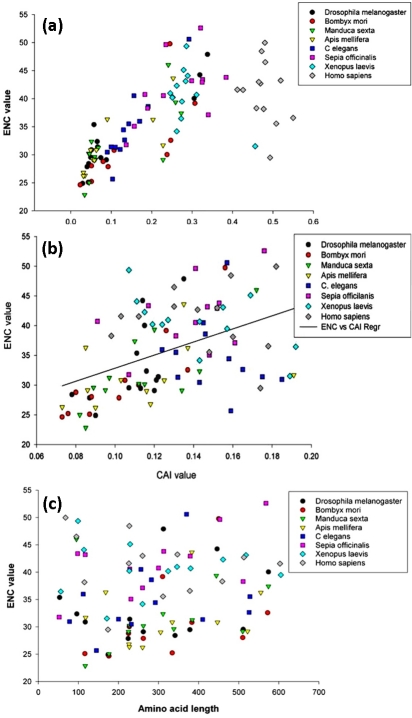
Figure 2.
Inter-relationships of ENC values with CAI, GC3 content and amino acid length of mitochondrial proteins. (a) Scatter plot of ENC value vs CAI value of conserved protein coding genes from representative species of various phyla. (b) Scatter plot of ENC value vs GC3 content of conserved protein coding genes from representative species of various phyla. (c) Scatter plot of ENC value vs amino acid length value of conserved protein coding genes from representative species of various phyla.

