Abstract
Skin cancer is the most prevalent cancer in the light-skinned population and it is generally caused by exposure to ultraviolet light. Early detection of skin cancer has the potential to reduce mortality and morbidity. There are many diagnostic technologies and tests to diagnose skin cancer. However many of these tests are extremely complex and subjective and depend heavily on the experience of the clinician. To obviate these problems, image processing techniques, a neural network system (NN) and a fuzzy inference system were used in this study as promising modalities for detection of different types of skin cancer. The accuracy rate of the diagnosis of skin cancer by using the hierarchal neural network was 90.67% while using neuro-fuzzy system yielded a slightly higher rate of accuracy of 91.26% in diagnosis skin cancer type. The sensitivity of NN in diagnosing skin cancer was 95%, while the specificity was 88%. Skin cancer diagnosis by neuro-fuzzy system achieved sensitivity of 98% and a specificity of 89%.
Keywords: skin cancer, neural networks, fuzzy system, neuro-fuzzy system
Introduction
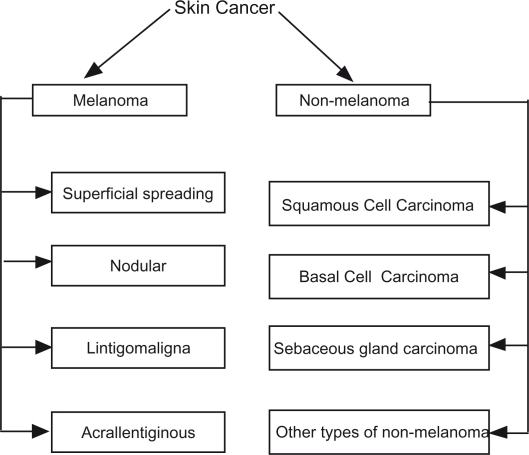
Skin cancer is a major public health problem. Skin cancer is divided into non melanoma skin cancer (NMSC) and melanoma skin cancer (MM) (Fig. 1). Non melanoma skin cancer (MMSC) is the most prevalent cancer among light-skinned population.1 It is divided into basal cell carcinoma (BCC) (75%), squamous cell carcinoma (SCC) (24%), and other rare types (1%) such as sebaceous carcinoma. (Fig. 1).
Figure 1.
Studied skin cancer types.
The age-standardized incidence rates per year of basal cell carcinoma is 175 per 100,000 in men and 124 per 100,000 in women.1 Rates of squamous cell cancer are 63.1 per 100,000 in men and 22.5 per 100,000 women.1 Non melanoma skin cancer is seldom lethal, but if advanced can cause severe disfigurement and morbidity.
The critical factor in assessment of patient prognosis in skin cancer is early diagnosis. There are many methods to diagnose non-melanoma skin cancer (NMSC)2–5 such as physical and clinical examination, biopsy, molecular markers, ultra sonography, Doppler, optical coherence tomography, dermoscopy, spectroscopy, fluoresence imaging, confocal microscopy, positron emission tomography, computed tomography, magnetic resonance imaging, terahertz imaging, and electrical impedance. All these methods have different accuracy rates, sensitivity and specificity in diagnosing NMSC. Melanoma skin cancer is divided into: superficial spreading melanoma, nodular melanoma, lentigo maligna melanoma and acral lentiginous melanoma. (Fig. 1). More than 60,000 people in the United States were diagnosed with invasive melanoma in recent years, and more than 8000 Americans died of the disease.6
The single most promising strategy to cut acutely the mortality rate from melanoma is early detection. Attempts to improve the diagnostic accuracy of melanoma have spurred the development of innovative in-vivo imaging modalities, including total body photography, dermoscopy, automated diagnostic system and reflectance confocal microscopy. Neural networks (NN) are a large class of models developed in the cognitive sciences, the structure of which was inspired by that of the nervous system of living beings. Certain applications of NN in medicine have led to significant improvement in medical decision making,7–10 including pigmented skin lesions and skin cancer,11–16 however, the fuzzy system was not addressed previously. Fuzzy logic is a form of multi-valued logic that deals with reasoning that is approximate rather than precise.
This paper proposes a system to make the computer automatically locate the tumor location in the image and calculate relevant features: such features can be used to determine the type of skin cancer.
Neural network models have been studied and used in this research. In general each network consists of three layers, input, hidden, and output layer. The proposed system composed of four NN built as a hierarchal NN system with Back Propagation learning. Each NN has an input layer, two hidden layers, and output layer. Many transfer functions are included in the neural-network; neurons can use any differentiable transfer function to generate their output. Log-sigmoid transfer functions have often been used by multilayer networks, it generates outputs between 0 and 1 as the neuron’s net input goes from negative to positive infinity. Alternatively, multilayer networks can use the tan-sigmoid transfer function; this function generates outputs from negative to positive infinity. In this study we used tan-sigmoid transfer function, in order to generate outputs between negative infinity to positive infinity.
The fuzzy logic inference system used in this research was intended to make the differentiation results between skin cancer types more accurate. It is based on the nature of fuzzy human thinking. After testing all images by using hierarchal neural network, NN results are entered into a fuzzy logic inference system to improve cancer diagnosis. There are three fuzzy logic inference systems, FIZ1, FIZ2, & FIZ3.
Methods
Reprocessing of data and features extraction
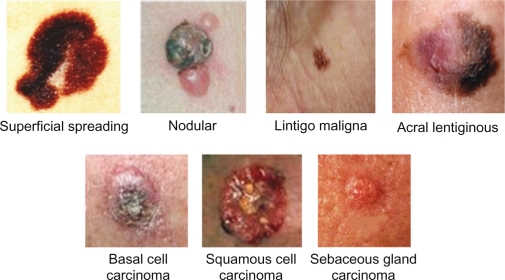
There are many types of the skin cancer; each type has a different color, size and features. Figure 2 shows types of skin cancer that are studied in this research:
Figure 2.
Types of skin cancer studied in this research.
Many skin features may have impact on digital images like hair and color, and other impacts such as lightness, and type of the scanner or digital camera. Images are processed to have the following starting features:
The same dimension (width and height)
Removing hair if any: using a filter
Color filtration through BLURE filter
Matching image colors and brightness to be correspondent to images in the collection for high accuracy: using levels. Normalization of images was done.
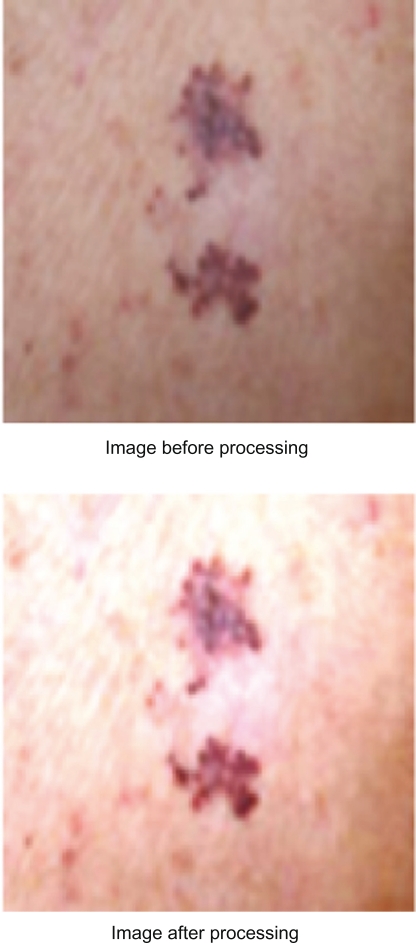
After selecting our testing images, the above four steps for each image are performed manually using Adobe Photoshop in order to have same similar ranges of colors; this makes it easier for VB.NET program to extract the correct place of the tumor. Figure 3 shows the image before and after performance of the normalization steps.
Figure 3.
Processing image using ADOBE PHOTOSHOP.
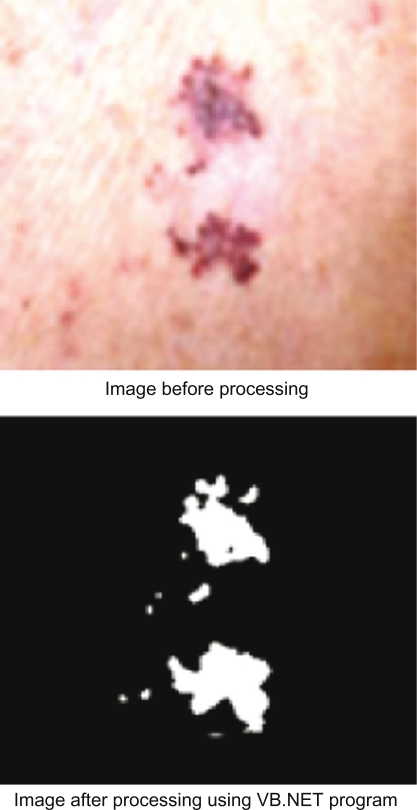
The next step is to enter the images into a VB.NET program to read the location of the tumor using color detection. After the color range of the image collection is checked, pixels that have a red color intensity value of less than 150, a green color intensity value of less than 150, and a blue color intensity value of less than 150 are found to be the tumor location, so all the locations with white area will be the tumor. Figure 4 shows the result of processing the image in VB.NET program.
Figure 4.
Processing image using VB.NET program.
After performing steps mentioned above, VB.NET software starts reading and finding the 20 features of the images that will be entered to the neural network. All these features will be saved in separate file.
The features extracted from images using the VB.NET code are shown in Table 1.
Table 1.
Skin cancer images features.
| Feature | Feature description |
|---|---|
| F1 | Irregularity index |
| F2 | Percent asymmetry |
| F3 | Red color variance |
| F4 | Green color variance |
| F5 | Blue color variance |
| F6 | Red relative chromaticity |
| F7 | Green relative chromaticity |
| F8 | Blue relative chromaticity |
| F9 | Spherical color coordinates (L) |
| F10 | Spherical color coordinates (α) |
| F11 | Spherical color coordinates (β) |
| F12 | Color coordinates (L*) |
| F13 | Color coordinates (a*) |
| F14 | Color coordinates (b*) |
| F15 | Red ratio |
| F16 | Green ratio |
| F17 | Blue ratio |
| F18 | Difference in lightness |
| F19 | Difference in chroma |
| F20 | Difference in color |
Each feature of the image is calculated in a different way.11,18 These features are divided into:
Area Features: Irregularity index and Percent asymmetry features.
Color Features: all remaining features.
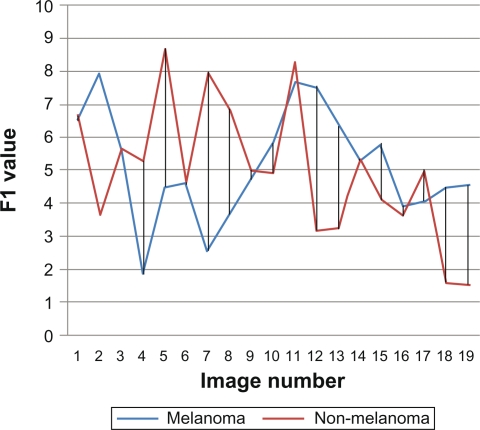
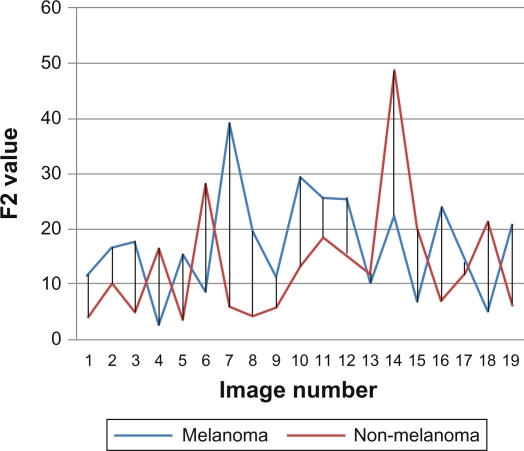
After finding features for the study images sample, related data are analyzed statistically. First nineteen images from melanoma and non-melanoma skin cancers were taken and their features were compared. We found that color features are more dependable features than area features. As shown in Figures 5 and 6, which describe area features, irregularity index and border asymmetry, both melanoma and non-melanoma skin cancers are close together, and have many intersecting points between them, therefore we could not depend only on area features.
Figure 5.
F1 irregularity index.
Figure 6.
F2 percent asymmetry.
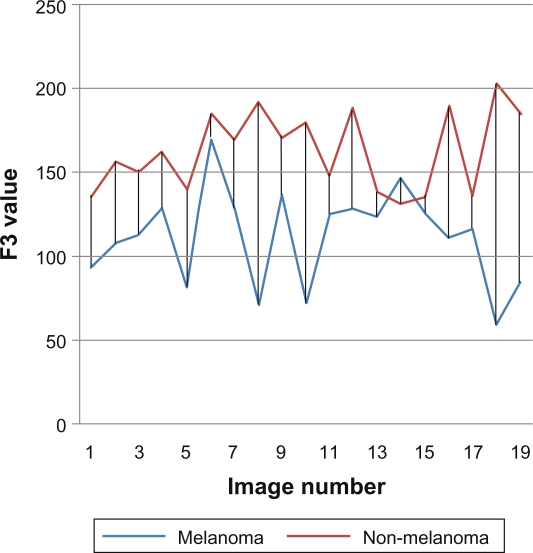
In general, the color feature is the most dependable feature in recognizing cancer, especially the red color, and we can see in Figure 7 that there is a difference between melanoma and non-melanoma in the red variance feature, so we can depend on this feature to recognize the type of the skin cancer.
Figure 7.
F3 red color variance.
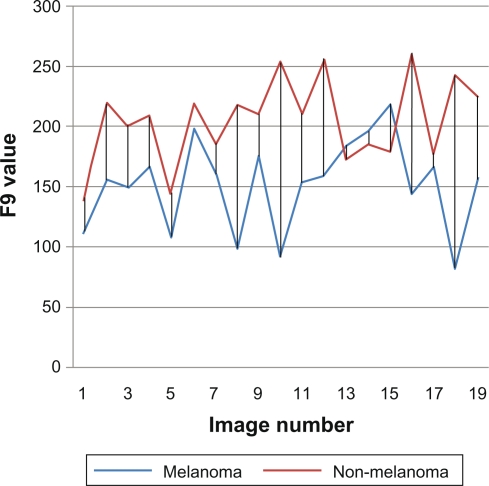
F9 is another example of a dependable feature. With the spherical color coordinates L, as shown in Figure 8, it is seen that the value of L is different between the two main cancer types: melanoma and non-melanoma.
Figure 8.
F9 spherical color coordinates L.
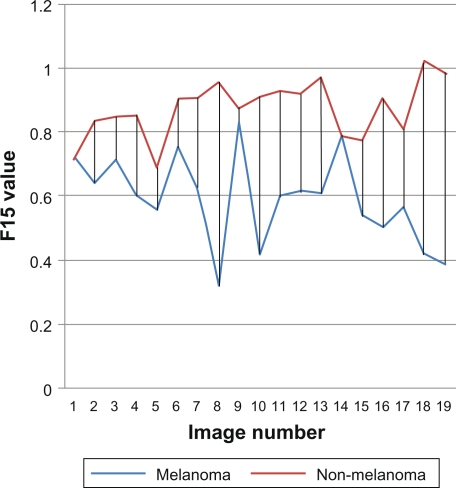
Figures 9 shows the red ratio feature, as we can see no intersection points between melanoma and non-melanoma skin cancer, it is a powerful feature to depend on when recognizing images.
Figure 9.
F15 ratio red.
Using neural networks to diagnose skin cancer type
Image processing finding features for each image from F1 to F20 were entered into the hierarchal NN system, and learned the network for the study selected types of skin cancer, and then neural networks were saved to be used for testing later.
It is known that cancer in general is proved through clinical tests not through the image of the tumor. A sample of a total of 58 images were taken from clinically proven skin cancer type images, and these images were classified into groups. The total number of the study images is 58 divided as shown in Table 2
Table 2.
Skin cancer number of images.
| Cancer type | Number of images |
|---|---|
| Melanoma | |
| Superficial spreading melanoma | 16 |
| Nodular melanoma | 9 |
| Lintigo maligna melanoma | 10 |
| Acral lentiginous melanoma | 4 |
| Non-melanoma | |
| Basal cell carcinoma | 10 |
| Squamous cell carcinoma | 7 |
| Other types of non-melanoma | |
| Sebaceous gland carcinoma | 2 |
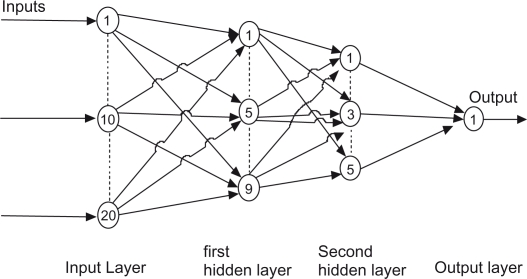
Hierarchal NN systems involve the integration of four distinct neural networks that are trained separately using a back propagation learning algorithm. Each neural network has twenty neurons in input layer, nine neurons in first hidden layers, five neurons in second hidden layer, and an output layer with one neuron as shown In Figure 10. One thousand iterations for each NN are performed in order to have accurate results. Tan-sigmoid transfer function used to generate output.
Figure 10.
Basic neural networks structure.
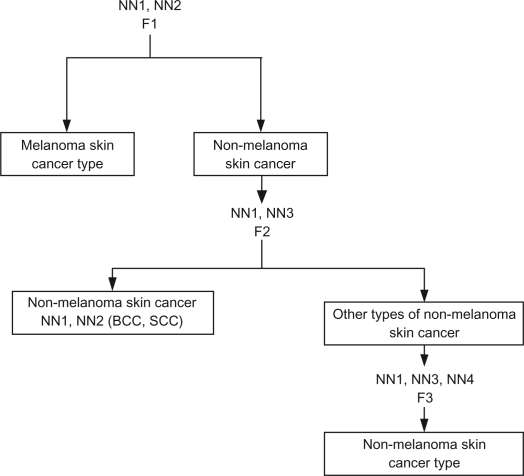
Twenty extracted features are used as networks inputs. NN1 is trained over whole data to determine the main type of the cancer: melanoma or non-melanoma, while NN2 trained over melanoma skin cancer images only to determine the type of melanoma skin cancer.
NN3 is trained over non-melanoma skin cancer images. It checks the type of non-melanoma and determines if it is the non-melanoma skin cancer type or other types of non-melanoma (Sebaceous gland carcinoma.) NN4 is trained over non-melanoma skin cancer images and it is used to determine the type of non-melanoma skin cancer. A proposed hierarchical NN system structure is shown in Figure 11, and Table 3 shows each neural network output ranges and results.
Figure 11.
Hierarchal neural network.
Table 3.
Hierarchical NN output ranges and results.
| Skin cancer type | Ranges of results |
|---|---|
| NN1 | |
| Melanoma skin cancer | −0.5 <= output < 0.5 |
| Non-melanoma skin cancer | 0.5 <= output < 1.5 |
| NN2 | |
| Superficial spreading melanoma | 0.5 <= output < 1.5 |
| Nodular melanoma | 1.5 <= output < 2.5 |
| Lintigo maligna melanoma | 2.5 <= output < 3.5 |
| Acral lentiginous melanoma | 3.5 <= output < 4.5 |
| NN3 | |
| Sebaceous gland carcinoma | −0.5 <= output < 0.5 |
| Non-melanoma skin cancer | 0.5 <= output < 1.5 |
| NN4 | |
| Basal cell carcinoma | −0.5 <= output < 0.5 |
| Squamous cell carcinoma | 0.5 <= output < 1.5 |
Each network is learned separately by taking 80% of the images as training data, and 20% as testing data. In some types of cancers, 50% of data are considered as learning, and 50% as testing, such as Sebaceous Gland Carcinoma since only two images for this type are available. Each network is learned 20 times with different input and testing data.
Using Neuro-Fuzzy to diagnose skin cancer type
Neuro-Fuzzy is one field of artificial intelligence; it is a combination of neural networks and fuzzy logic, with the object of having human-like reasoning style of fuzzy systems with the learning of neural networks. Neuro-fuzzy systems combine the human-like reasoning style of fuzzy systems through the use of fuzzy sets, and a linguistic model consisting of a set of IF-THEN fuzzy rules. The main strength of neuro-fuzzy systems is that they are universal approximations with the ability to use IF-THEN rules.
After testing sample study images using hierarchal NN and extracting the results, the output is validated by using the neuro-fuzzy system that combines NN and fuzzy logic, which leads to high accurate results.
Fuzzy logic uses validation rules that control the output; these rules give a range of input and output.
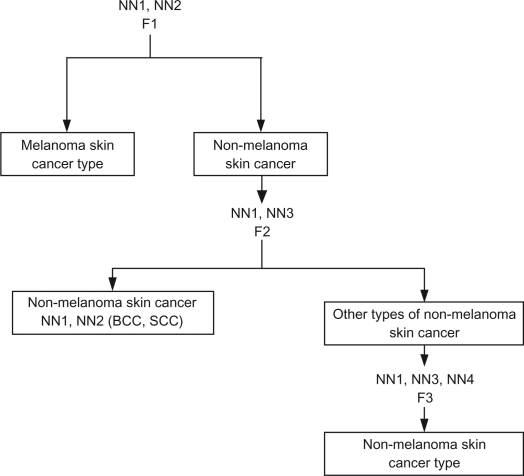
The proposed fuzzy logic system checks its rules over the output of all Neural Networks. The output of NN1 and NN2 will be the input of the first Fuzzy Logic Inference System 1 (FIZ1), the output of FIZ1 will be melanoma or non-melanoma, and the type of melanoma, if the output is non-melanoma, the system enters the next Fuzzy Logic Inference System 2 (FIZ2), where it checks whether the type of the skin cancer is non-melanoma type or other type of non-melanoma, if the result is other type of non-melanoma (Sebaceous Gland Carcinoma), then the system ends, while if the result is non-melanoma, then the system enters Fuzzy Logic Inference System 3 (FIZ3) to determine the correct type of non-melanoma skin cancer. Figure 12 shows the structure of our Fuzzy Logic system.
Figure 12.
Structure of fuzzy logic system.
The output of NN1 and NN2 is used as inputs of FIZ1. It determines if the cancer is melanoma or non-melanoma, and the type of melanoma. Table 4 illustrates linguistic rules used in FIZ1.
Table 4.
FIZ1 Linguistic rules.
| NN1 value | NN2 value | FIZ1 output |
|---|---|---|
| 0.5 <= NN1 < 1.5 | 0.5 <= NN2 < 1.5 | 0.5 <= FIZ1 < 1.5 |
| 0.5 <= NN1 < 1.5 | 1.5 <= NN2 < 2.5 | 1.5 <= FIZ1 < 2.5 |
| 0.5 <= NN1 < 1.5 | 2.5 <= NN2 < 3.5 | 2.5 <= FIZ1 < 3.5 |
| 0.5 <= NN1 < 1.5 | 2.5 <= NN2 < 3.5 | 3.5 <= FIZ1 < 4.5 |
| Else | Else | FIZ1 < 0.5 |
FIZ2 is used if the output of FIZ1 is non-melanoma skin cancer. Table 5 illustrates FIZ2 linguistic rules, it uses NN1 and NN3 outputs as input data. It determines the type of the non-melanoma skin cancer as shown in Table 6.
Table 5.
FIZ2 Linguistic rules.
| NN1 value | NN3 value | FIZ2 output |
|---|---|---|
| −0.5 <=NN1 < 0.5 | −0.5 <=NN3 < 0.5 | −0.5 <= FIZ2 < 0.5 |
| −0.5 <=NN1 < 0.5 | 0.5 <=NN3 < 1.5 | 0.5 <= FIZ2 < 1.5 |
Table 6.
Neuro-Fuzzy system output ranges and results.
| Skin cancer type | Ranges of results |
|---|---|
| FIZ1 | |
| Superficial spreading melanoma | 0.5 <= output < 1.5 |
| Nodular melanoma | 1.5 <= output < 2.5 |
| Lintigo maligna melanoma | 2.5 <= output < 3.5 |
| Acral lentiginous melanoma | 3.5 <= output < 4.5 |
| Non-melanoma skin cancer | Else |
| FIZ2 | |
| Sebaceous gland carcinoma | −0.5 <= output < 0.5 |
| Non-melanoma skin cancer type | 0.5 <= output < 1.5 |
| FIZ3 | |
| Basal cell carcinoma | −0.5 <= output < 0.5 |
| Squamous cell carcinoma | 0.5 <= output < 1.5 |
FIZ3 is used to determine the type of non-melanoma skin cancer if FIZ2 output between 0.5 and 1.5. Its input is the output of NN1, NN3 and NN4, Table 7 describes ranges of output regards each input values.
Table 7.
FIZ3 Linguistic rules.
| NN1 value | NN3 value | NN4 value | FIZ1 output |
|---|---|---|---|
| −0.5<= | 0.5 <= | −0.5 <= | −0.5 <= |
| NN1 | NN3 | NN4 | FIZ3 |
| And | And | And | And |
| NN1 < 0.5 | NN3 < 1.5 | NN4 < 0.5 | FIZ3 < 0.5 |
| −0.5 <= | 0.5 <= | 0.5 <= | 0.5 <= |
| NN1 | NN3 | NN4 | FIZ3 |
| And | And | And | And |
| NN1 < 0.5 | NN3 < 1.5 | NN4 < 1.5 | FIZ3 < 1.5 |
Results
The average results of neural networks system testing are shown in the Table 8.
Table 8.
NN testing success percentage.
| NN | Training images | Testing images | Success average |
|---|---|---|---|
| NN1 | 51 | 7 | 94.3% |
| NN2 | 35 | 4 | 87.5% |
| NN3 | 17 | 2 | 85% |
| NN4 | 15 | 2 | 90% |
As shown in this table, NN1 has the largest success percentage, since all images are used as training data, while NN3 has the lowest percentage, which means that increasing the sample volume may improve the results. Image type has an impact on the results, such as the quality of the image, size of the tumor compared with other images, and variances in skin color.
The result of the neuro-fuzzy system is shown in Table 4. If the output of NN1 is between 0.5 and 1.5, the cancer is melanoma, and if the output of NN2 is between 0.5 and 1.5, then the cancer type will be Superficial Spreading Melanoma, which will be the output of FIZ1. All other skin cancer types will be known in the same way. Table 9 illustrates the output values of Neuro-Fuzzy System and their meaning.
Table 9.
Neuro-Fuzzy testing success percentage.
| Fuzzy system | Failed images | Success average |
|---|---|---|
| FIZ1 | 1 | 97.4% |
| FIZ2 | 0 | 100% |
| FIZ3 | 4 | 76.4% |
All studied images were tested by using proposed Neuro-Fuzzy system. First, hierarchical NN is used to generate outputs regards each image, second, NN outputs used as inputs to Fuzzy Logic Inference systems as mentioned above. Table 10 shows the results of the Neuro-Fuzzy system. Accordingly overall success percentage of diagnosing skin cancer type by using the Neuro-Fuzzy system is 91.26%, which is greater than hierarchal NN results.
Table 10.
Number of failed testing images.
| Cancer type | Neuro-Fuzzy system failed testing images | Hierarchical neural network failed testing images |
|---|---|---|
| Superficial spreading melanoma | 0 | 0 |
| Nodular melanoma | 1 | 1 |
| Lintigo maligna melanoma | 0 | 1 |
| Arcal lentignious melanoma | 0 | 1 |
| Basal cell carcinoma | 1 | 2 |
| Squamous cell carcinoma | 3 | 4 |
| Sebaceous gland carcinoma | 0 | 1 |
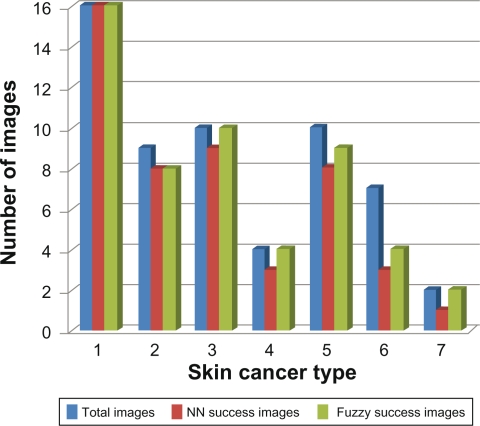
As shown in Table 9, by using the Neuro-Fuzzy system the number of failed diagnostic images is very low: five out of fifty eight images. Failed tests appear to occur owing to a close value of all features for most of the image data, noting that the types of skin cancer with fewer images have the same or close error rate compared to the Hierarchical NN system.
The overall success rate was (91.26%) which is slightly higher than the hierarchal NN alone (90.76%). This increase (0.5%) is not significant; this might be due to few studied images in the system.
Ten experiments were performed to calculate the success rate of diagnosis various types of cancer by using Hierarchical Neural Network system, while only one experiment was done by using Neuro-Fuzzy system. Table 10 describes these results.
Figure 13 shows the diagnostic results of Hierarchical Neural Network, and Neuro-Fuzzy systems. As we can see, number of correct diagnostic images by Neuro-Fuzzy system is more than the number diagnosis by Hierarchical Neural Network.
Figure 13.
Hierarchical NN and Neuro-Fuzzy comparison.
The worst results were in the diagnosis of squamous cell carcinoma, which might be due to the small number of squamous cell carcinoma cancer images.
Discussion
In the fight against melanoma, a diagnostic aid from new technologies could be useful. However, the effective reliability of computer-aided systems has still to be assessed.17,18 In this study we have explored the opportunity of using multispectral analysis and an NN and neuro fuzzy system in an attempt to mimic the decision of an expert clinician.
The 80% specificity with the resulting 88% sensitivity is an arbitrary value and could be considered more or less satisfactory, depending on the accuracy usually assigned to physicians in identifying pigmented lesions suggestive of melanoma.
Several research efforts have focused in the last few years on the possibility of introducing into daily clinical practice computer aided classification or automatic machine vision to increase the accuracy of melanoma diagnosis.19–26 In fact, although dermoscopy seems to have a discriminant power significantly higher than clinical examination in classifying pigmented lesions, as documented in a recent meta-analysis,34 the accuracy of dermoscopy is highly variable across different studies and is still far from the desirable levels of 100% sensitivity and high specificity.
Sources of variation are likely to arise from differences in sample sizes, proportion of melanomas in the sample, type of instrument used, dermoscopic criteria used, and, last but not least, human variability in feature recognition and coding.
Our study provides an important contribution to this research area, since it is applied to all known types of skin cancer and because it highlights the importance of factors such as classifier design and feature selection in computer aided diagnosis that are generally overlooked in the previously published studies.
We adopted a very conservative procedure in feature selection for the linear classifier to obtain a relatively small set of robust parameters to discriminate melanoma and non melanoma types. This strategy and the use of a hold-out (separate training and test sets) design allowed performance estimates that were likely conservatively biased.35 Despite this, the performances of the linear classifiers were remarkably accurate, with a mean sensitivity of 95%, a mean specificity of 88% and was highly stable on sets of lesions derived from different dermatology centres, where the referral criteria for patients with pigmented lesions and the operating conditions of the instruments could have been different.
The most critical requirement of the NN and neuro fuzzy classifiers is to have a training set including enough examples of each class of pigmented lesions to adequately represent the full range of measurements that can be expected from each class.
Comparing the performances of the two classifiers, the neuro fuzzy approach, yielding a sensitivity of 98% and a specificity of 89%, seemed to give results similar to the NN approach (which gave sensitivity of 95% and specificity of 88%). Although the bottom line in the diagnosis of melanoma is likely to continue to depend on the clinical insight of the physician and on the expertise of the pathologist, computer-aided diagnosis could provide clinicians an objective second opinion, at expert level, based on consistently extracting and analyzing image features. To what extent the combination of human and machine-based diagnoses would affect the decision-making process in the management of patients with pigmented lesions by improving the detection of early melanoma and/or decreasing unnecessary surgery remains to be evaluated by well-designed, randomized clinical trials in the field.
Conclusion and Future Works
After testing the studied sample of images on the two systems included in this research, the automatic image processing of skin cancer found is difficult because of the different features of human skin, i.e, the skin pigmentation or color variations. The most dependable feature to recognize the type of image is the red color.
The results of testing the studied sample of images by using hierarchal NN system gave 90.67%, accuracy, while using neuro-fuzzy system gave better results than using the hierarchal NN system alone, with accuracy rate of 91.26%.
Image processing is the primary foundation of this study, and the concept of improving the means of extracting features of the skin image is the main recommendation for researchers to follow in the future. The output of both hierarchal NN and neuro-fuzzy systems depends on these features. The more accurate these feature are, the better the results will be.
Image normalization in our research was manual, and in future work it is recommended that this is computerized. Benign cancers should be studied and distinguished in relation to that, and the proposed system can be compared with other systems.
Footnotes
Disclosure
This manuscript has been read and approved by the author. This paper is unique and not under consideration by any other publication and has not been published elsewhere. The author and peer reviewers report no conflicts of interest. The author confirms that they have permission to reproduce any copyrighted material.
References
- 1.Rigel DS, Friedman R, DZubow LM, et al. Cancer of the skin. Philadelphia: El Sevier Sanders; 2004. p. 736S. [Google Scholar]
- 2.Gluud C, Gluud LL. Evidence based diagnostics. BMJ. 2005;330:724–6. doi: 10.1136/bmj.330.7493.724. [DOI] [PMC free article] [PubMed] [Google Scholar]
- 3.Whited JD, Hall RP. Diagnostic accuracy and precision in assessing dermatologic disease: problem or promise. Arch Dermatol. 1997;133:1409–15. [PubMed] [Google Scholar]
- 4.Schwartzbery JB, Elgart GW, Romanelli P, et al. Accuracy and predicators of based cell carcinoma diagnosis. Dermatol Surg. 2005;31:534–7. doi: 10.1111/j.1524-4725.2005.31156. [DOI] [PubMed] [Google Scholar]
- 5.Mogensen M, Jemec GBE. Diagnosis of non melanoma skin cancer/karatirocyte carcinoma: A review of diagnosis accuracy of non melanoma skin cancer diagnostic tests and technologies. Dermatol Surg. 2007;33:1158–74. doi: 10.1111/j.1524-4725.2007.33251.x. [DOI] [PubMed] [Google Scholar]
- 6.Pasty EL, Allan BA, Halpern C. Current and emerging technologies in melanoma diagnosis: the state of the art. Clinics in Dermatology. 2009;27:35–45. doi: 10.1016/j.clindermatol.2008.09.004. [DOI] [PMC free article] [PubMed] [Google Scholar]
- 7.Acc orsero BN, Camozza M. OP TONET: neural network for visual field diagnosis. Med Biol Eng Comput. 1995;33:223–6. doi: 10.1007/BF02523047. [DOI] [PubMed] [Google Scholar]
- 8.Lapurerta CP, Azen SP, Labree L. Use of neural networks in predicting the risk of coronary artery disease. Comp Biomed Res. 1995;28:38–52. doi: 10.1006/cbmr.1995.1004. [DOI] [PubMed] [Google Scholar]
- 9.Givens DTB, Braun PJ. Classification of factor deficiencies from coagulation assays using neural networks. Int J med Inf. 1997;46:17–9. doi: 10.1016/s1386-5056(97)00065-8. [DOI] [PubMed] [Google Scholar]
- 10.Kermani Ba, Schiffman SS, Nagle HT. Using neural networks and genetic algorithms to enhance performance in an electric nose. IEEE Trans Biomed Eng. 1999;46:429–39. doi: 10.1109/10.752940. [DOI] [PubMed] [Google Scholar]
- 11.Rubegri P, Ceverinini G, Burronim, et al. Automated diagnosis of pigmented skin lesions. Int J cancer. 2002;101:576–80. doi: 10.1002/ijc.10620. [DOI] [PubMed] [Google Scholar]
- 12.Green A, Martin N, mckenzie G, et al. Computer image analysis of pigmented skin lesions. Melanoma Res. 1991;4:231–6. doi: 10.1097/00008390-199111000-00002. [DOI] [PubMed] [Google Scholar]
- 13.Green A, Martin N, Pfitzner J, et al. Computer image analysis in the diagnosis of melanoma. J Am Acad Dermatol. 1994;31:958–64. doi: 10.1016/s0190-9622(94)70264-0. [DOI] [PubMed] [Google Scholar]
- 14.Carrara M, Bono A, Bartolic, et al. Multispectral imaging and artificial neural network: mimicking the management decision of the clinician facing pigmented skin lesions. Phys med Biol. 2007;52:2599–613. doi: 10.1088/0031-9155/52/9/018. [DOI] [PubMed] [Google Scholar]
- 15.Hoffmann K, Gambichler T, Rick A, et al. Diagnostic and neural analysis of skin caner (DANAOS). A multi centre study for collection and computer – aided analysis of data from pigmented skin lesions using digital dermoscopy. Br J Dermatol. 2003;149:801–9. doi: 10.1046/j.1365-2133.2003.05547.x. [DOI] [PubMed] [Google Scholar]
- 16.Ubeyli ED, Guler I. Automatic detection of erthemato—squamous disease using adaptive neuro–fuzzy inference systems. Comput Biol Med. 2005;35:421–33. doi: 10.1016/j.compbiomed.2004.03.003. [DOI] [PubMed] [Google Scholar]
- 17.Chen SC, Bravata DM, Weil E, Olkin I. A comparison of dermatologists’ and primary care physicians’ accuracy in diagnosing melanoma. Arch Dermatol. 2001;137:1627–34. doi: 10.1001/archderm.137.12.1627. [DOI] [PubMed] [Google Scholar]
- 18.Sahiner B, Chan HP, Petrick N, Wagner RF, Hadjiiski L. Feature selection and classifier performance in computer-aided diagnosis: the effect of finite sample size. Med Phys. 2000;27:1509–22. doi: 10.1118/1.599017. [DOI] [PMC free article] [PubMed] [Google Scholar]
- 19.Green N, Martin G, Mckenzie J, et al. Knight, computer image analysis of pigmented skin lesions. J Amer Acad Dermatol. 1994;31:925–1039. [Google Scholar]
- 20.La Torre E, Tommasi T, Caputo B, Gigante GE. Kernel Methods for Melanoma Recognition. Stud Health Technol Inform. 2006;124:983–8. [PubMed] [Google Scholar]
- 21.Celenk M. A color clustering technique for image segmentation, Computer Vision, Graphics, and Image Processing. 1990;52:145–70. [Google Scholar]
- 22.Philippe Schmid-Saugeon. Symmetry axis computation for almost-Symmetrical and asymmetrical objects: Application to pigmented skin lesions. Med Image Anal. 2000;4:269–82. doi: 10.1016/s1361-8415(00)00019-0. l. [DOI] [PubMed] [Google Scholar]
- 23.Suyi Shao, Grams Ralph R. A Proposed Computer Diagnostic Malignant Melanoma (CDSMM) J Med Sys. 1994;18:85–96. doi: 10.1007/BF00999454. [DOI] [PubMed] [Google Scholar]
- 24.Nachbar F, Stolz W, Merkle T, et al. The ABCD rule of dermatoscopy: High prospective value in the diagnosis of doubtful melanocytic skin lesions. J Amer Acad Dermatol. 1994;30:551–9. doi: 10.1016/s0190-9622(94)70061-3. [DOI] [PubMed] [Google Scholar]
- 25.Menzies SW, Bischof L, Talbot H, et al. The Performance of SolarScan. An Automated Dermoscopy Image Analysis Instrument for the Diagnosis of Primary Melanoma. Arch Dermatol. 2005;141:1388–96. doi: 10.1001/archderm.141.11.1388. [DOI] [PubMed] [Google Scholar]
- 26.Burroni M, Corona R, Dell’Eva G, et al. Melanoma Computer-Aided Diagnosis: Reliability and Feasibility Study. Clin Cancer Res. 2004;10:1881–6. doi: 10.1158/1078-0432.ccr-03-0039. [DOI] [PubMed] [Google Scholar]


