

Abstract
Objective
To illustrate the effects of failing to account for model uncertainty when modelling is used to estimate the global burden of disease, with specific application to childhood deaths from rotavirus infection.
Methods
To estimate the global burden of rotavirus infection, different random-effects meta-analysis and meta-regression models were constructed by varying the stratification criteria and including different combinations of covariates. Bayesian model averaging was used to combine the results across models and to provide a measure of uncertainty that reflects the choice of model and the sampling variability.
Findings
In the models examined, the estimated number of child deaths from rotavirus infection varied between 492 000 and 664 000. While averaging over the different models’ estimates resulted in a modest increase in the estimated number of deaths (541 000 as compared with the World Health Organization’s estimate of 527 000), the width of the 95% confidence interval increased from 105 000 to 198 000 deaths when model uncertainty was taken into account.
Conclusion
Sampling variability explains only a portion of the overall uncertainty in a modelled estimate. The uncertainty owing to both the sampling variability and the choice of model(s) should be given when disease burden results are presented. Failure to properly account for uncertainty in disease burden estimates may lead to inappropriate uses of the estimates and inaccurate prioritization of global health needs.
Résumé
Objectif
Illustrer les effets de l'absence de prise en compte de l'incertitude des modèles quand la modélisation est utilisée pour estimer les effets globaux induits par la maladie, avec une application spécifique à la mortalité infantile liée à l'infection par rotavirus.
Méthodes
Pour estimer la charge globale de l'infection par rotavirus, différents modèles de méta-analyse d'effet aléatoire et de méta-régression ont été élaborés en faisant varier les critères de stratification et en incluant différentes associations de covariantes. Un modèle bayésien de calcul de moyenne a été utilisé pour combiner les résultats entre les modèles et fournir une mesure de l'incertitude qui reflète la variabilité du choix du modèle et de l'échantillonnage.
Résultats
Dans les modèles examinés, le nombre estimé d'enfants morts par infection de rotavirus variait entre 492 000 et 664 000. Tandis que le calcul de la moyenne des estimations des différents modèles donnait une légère augmentation du nombre estimé de morts (541 000, par comparaison aux 527 000 estimés par l'Organisation mondiale de la Santé), l’ampleur de l'intervalle de confiance de 95% passait de 105 000 à 198 000 morts lorsque l'incertitude du modèle était prise en compte.
Conclusion
La variabilité de l'échantillonnage n’explique qu’une partie de l'incertitude globale dans une estimation par modèle. L'incertitude liée à la fois à la variabilité de l'échantillonnage et au choix de modèle(s) doit être indiquée dans la présentation de résultats concernant les effets induits par la maladie. Ne pas prendre en compte l'incertitude comme il se doit dans les estimations des effets de la maladie peut conduire à un usage inapproprié des estimations et à une affectation erronée des priorités dans les besoins globaux de santé.
Resumen
Objetivo
Ilustrar las consecuencias que acarrea no contemplar la incertidumbre del modelo cuando dicho modelo se emplea para calcular la carga de enfermedad global, especialmente en el caso de las muertes infantiles por una infección por rotavirus.
Métodos
Con el fin de calcular la carga global de la infección por rotavirus, se desarrollaron diversos modelos de metaanálisis y metarregresión de efectos aleatorios modificando los criterios de estratificación e incluyendo diversas combinaciones de covariables. Se empleó el método bayesiano de estimación de la media para combinar los resultados entre los modelos y ofrecer una medida de incertidumbre que reflejara la elección de modelo y la variabilidad del muestreo.
Resultados
En los modelos examinados, la cantidad estimada de muertes infantiles provocadas por una infección por rotavirus osciló entre 492 000 y 664 000. Si bien la media de las estimaciones de los diversos modelos dio como resultado un aumento moderado en la cantidad estimada de muertes (541 000 en comparación con la estimación de la Organización Mundial de la Salud, de 527 000); la amplitud del intervalo de confianza del 95% provocó un aumento de 105 000 a 198 000 muertes cuando se tomó en consideración la incertidumbre de los modelos.
Conclusión
La variabilidad del muestreo explica únicamente una parte de la incertidumbre global de una estimación extraída empleando un modelo. La incertidumbre atribuible tanto a la variabilidad del muestreo como a la elección de uno o varios modelos debe indicarse cuando se presenten los resultados de carga de enfermedad. No contemplar debidamente la incertidumbre de las estimaciones en la carga de enfermedad, podría acarrear un uso inadecuado de las estimaciones y una priorización inexacta de las necesidades sanitarias globales.
ملخص
الغرض: توضيح الآثار المترتبة على فشل حساب نموذج اللايقين عند استخدام صَوْغ النماذج في تقدير العبء العالمي للمرض، مع تطبيق خاص لوفيات الأطفال الناجمة عن العدوى بالفيروسة العجليّة.
الطريقة: تقدير العبء العالمي للعدوى بالفيروسة العجلية، وقد صُمِمَت نماذج تحليل تلوي وتحوّف تلوي للآثار العشوائية المختلفة عن طريق تغيير معايير التصنيف وإدراج تواليف مختلفة للمتغيرات المساعدة. واستخدم نموذج بايز Bayesian model في حساب الوسطي لدمج النتائج عبر النماذج وتقديم قياس لايقين يعكس اختيار النموذج واختلاف أخذ العينة.
النتائج: في النماذج التي جرى فحصها، ترواح العدد التقديري لوفيات الأطفال الناجمة عن الفيروسة العجليّة بين 492000 إلى 664000. في حين أن حساب الوسطي عبر تقديرات النماذج المختلفة نتج عنه زيادة متواضعة في العدد التقديري للوفيات (541000 مقارنة بتقدير منظمة الصحة العالمية البالغ 527000)، وزاد اتساع فاصلة الثقة 95% من 105000 وفاة إلى 198000 وفاة بعد أخذ نموذج اللايقين في الحسبان.
الاستنتاج: اختلاف أخذ العينة يشرح فقط جزءاً من اللايقين الإجمالي في التقدير الناتج عن النموذج. ويجب تحديد اللايقين الناجم عن كل من اختلاف أخذ العينة واختيار النموذج أو النماذج عند تقديم نتائج العبء المرضي. والإخفاق في الحساب الصحيح للايقين في تقديرات العبء المرضي قد يؤدي إلى استخدام غير مناسب للتقديرات وتحديد غير دقيق لأولويات الاحتياجات الصحية العالمية.
Резюме
Цель
Проиллюстрировать на примере детской смертности от ротавирусной инфекции воздействие ошибочного расчета неопределенности модели в случае, когда модель используется для оценки глобального бремени болезней.
Методы
Для оценки глобального бремени ротавирусной инфекции были разработаны различные модели мета-анализа и мета-регрессии случайных эффектов путем варьирования критериев стратификации с использованием различных комбинаций ковариат. Для сочетания результатов по моделям и получения меры неопределенности, отражающей выбор модели и изменчивость выборки, было использовано усреднение байесовских моделей.
Результаты
В рассмотренных моделях оценочное количество случаев смерти детей от ротавирусной инфекции колебалось от 492 000 до 664 000. Усреднение по оценкам различных моделей привело к незначительному повышению оценочного количества случаев смерти (541 000 , по сравнению с оценкой Всемирной организации здравоохранения, составлявшей 527 000), но когда была учтена неопределенность модели, то ширина 95%-ного доверительного интервала возросла с 105 000 до 198 000 случаев смерти.
Вывод
Изменчивость выборки только частично объясняет общую изменчивость смоделированной оценки. При представлении результатов бремени болезни должна быть задана неопределенность, обусловленная как изменчивостью выборки, так и выбором модели (моделей). Неправильный учет неопределенности в оценках бремени болезней может привести к неправильному использованию оценок и неточному установлению приоритетов глобальных потребностей в области здравоохранения.
摘要
目的
当使用建模来估测全球疾病负担并具体应用到轮状病毒感染导致的儿童死亡时,说明不能解释模型不确定性原因的影响因素。
方法
为了估测轮状病毒感染的全球负担,我们通过变更分层标准和包含协变量的不同组合建立了不同的随机效应meta分析和meta回归模型。贝叶斯模型平均法用来综合各模型的结果并提供一种反映模型选择和抽样变异性的不确定性度量。
结果
在所检验的模型中,所估测的轮状病毒感染引起的儿童死亡人数在492,000和664,000之间。尽管对不同模型估测进行平均会引起所估测的死亡人数的略微增加(541,000,而世界卫生组织的估测为527,000),但如果考虑模型的不确定性,则死亡人数的95%置信区间的宽度将从105,000增加至198,000。
结论
抽样变异性仅仅解释了模型估测中整个不确定性的一部分。由于抽样变异性和模型选择所引起的不确定性应在展示疾病负担结果的时候予以说明。未能适当地解释疾病负担估测中的不确定性可能导致估测的使用不当和不准确的全球健康优先需求。
Introduction
Because vital registration and surveillance data on etiology-specific causes of death are frequently unavailable, incomplete or inaccurate, statistical models are commonly used to estimate burden of disease. Mathers et al. argue that while such estimates have a degree of uncertainty, they are far more useful for policy-makers than fragmented and unsynthesized data.1 A key mission of the World Health Organization (WHO) is to disseminate coherent and complete disease burden estimates, and quantifying uncertainty is one of WHO’s five principles of data dissemination.2 Accurately reporting uncertainty is essential so that policy-makers can determine whether an estimate with a given level of uncertainty is appropriate for a given purpose. Furthermore, quantifying uncertainty is important to establish global health priorities and make accurate cross-national comparisons.1
Estimates of disease burden based on statistical models involve uncertainty not only because of sampling variability but also because of the choice of potential covariates and model structure. Researchers typically select a single model structure and subset of predictors and proceed to analyse the data as if the correct model structure and relevant covariates were known. Throughout this paper, we use model uncertainty to refer to the uncertainty that results from both the structure of the model and the covariates included in the model. Failing to account for model uncertainty leads to standard error calculations that underestimate the overall uncertainty of the results. While previous uncertainty measures of global burden of disease have described the uncertainty generated by the sampling variance in the underlying data, to the best of our knowledge no one to date has attempted to describe the uncertainty associated with the choice of the model used to estimate disease burden. We suggest using Bayesian model averaging to account for model uncertainty when using statistical modelling to make disease burden predictions.3–5
We illustrate the effects of failing to account for model uncertainty on the estimated global burden of child deaths from rotavirus infection, a major cause of childhood diarrhoea.6 According to WHO, in 2004 an estimated 527 000 (confidence interval, CI: 475 000–580 000) deaths from rotavirus infection occurred worldwide in children younger than 5 years.7,8 The full analytic framework for deriving the WHO estimate is described in Parashar et al.8 and summarized in this paper. The WHO estimate and previous estimates in the literature were computed by multiplying each country’s estimated number of child deaths from diarrhoea by each country’s estimated proportion of diarrhoea deaths attributable to rotavirus and then summing the product over all countries.7–11 The number of child deaths from diarrhoea in each country is routinely reported by WHO. Although no data exist on the proportion of these deaths that is caused by rotavirus, this proportion can be estimated from 76 studies across the world that have reported it for particular regions within each country. But because the proportion of child diarrhoea deaths attributed to rotavirus varies considerably across countries, using the sample average of all 76 studies to estimate this proportion for any given country would be inappropriate. Instead, to account for the heterogeneity in the proportion of diarrhoea deaths WHO has employed a statistical model using covariates thought to be associated with that proportion.
The WHO model divided the Member States, which at the time numbered 192, into five strata based on under-5 mortality and region (Table 1). The proportion of diarrhoea deaths caused by rotavirus infection was estimated for countries within each stratum based on a DerSimonian and Laird random-effects meta-analysis of studies from countries in the stratum.12 However, other reasonable covariates besides geographical area and under-5 mortality could be used to predict the proportion, as noted by Parashar et al.8
Table 1. Cut-off points for each stratum used to group countries and studies for the random-effects meta-analysis of child deaths from rotavirus infection.
| Variable | Stratum |
||||
|---|---|---|---|---|---|
| 1 | 2 | 3 | 4 | 5 | |
| WHO model: under-5 mortality & geographical region | Member States in all regions with very low mortality | Member States in all regions with low mortality | Member States in the Americas with high mortality | Member States in Asia with high mortality | Member States in Africa with high mortality |
| No. of countries with studies/no. of studies conducted/no. of countries in stratum | 9/14/34 | 19/41/88 | 1/1/6 | 2/8/13 | 8/12/51 |
| Alternative WHO model: under-5 mortality & geographical region | Member States in all regions with very low mortality | Member States in all regions with low mortality except the Americas | Member States in the Americas with low or high mortality | Member States in Asia with high mortality | Member States in Africa with high mortality |
| No. of countries with studies/no. of studies conducted/no. of countries in stratum | 9/14/34 | 14/29/62 | 6/13/32 | 2/8/13 | 8/12/51 |
| Life expectancy at birth in females (years) | > 76 | 66–75 | 53–65 | 46–53 | 34–45 |
| No. of countries with studies/no. of studies conducted/no. of countries in stratum | 18/30/63 | 11/26/66 | 3/10/33 | 5/7/16 | 2/3/14 |
| Life expectancy at birth in males (years) | > 76 | 70–75 | 65–69 | 50–64 | 36–49 |
| No. of countries with studies/no. of studies conducted/no. of countries in stratum | 7/12/28 | 11/22/39 | 11/20/48 | 5/12/49 | 5/8/28 |
| Under-5 mortality rate (per 1 000 live births) | 3–10 | 11–20 | 21–35 | 36–85 | > 86 |
| No. of countries with studies/no. of studies conducted/no. of countries in stratum | 14/21/44 | 5/11/31 | 9/22/29 | 4/11/37 | 7/11/51 |
| Infant mortality rate (per 1 000 live births) | 2–7 | 8–17 | 18–30 | 31–75 | > 76 |
| No. of countries with studies/no. of studies conducted/no. of countries in stratum | 11/20/36 | 9/15/38 | 8/19/34 | 5/13/38 | 6/9/46 |
| % DPT3 immunization coverage among 1-year-olds | 97–99 | 93–96 | 86–92 | 76–85 | < 75 |
| No. of countries with studies/no. of studies conducted/no. of countries in stratum | 9/13/54 | 11/21/31 | 7/18/32 | 6/11/35 | 6/13/40 |
| Natural log of per capita GNI (in PPP international dollars) | > 9.50 | 8.75–9.49 | 8.00–8.74 | 7.25–7.99 | < 7.24 |
| No. of countries with studies/no. of studies conducted/no. of countries in stratum | 12/21/45 | 11/18/42 | 7/20/38 | 4/9/38 | 5/8/29 |
| % urban population | 80.0–100.0 | 60.0–79.9 | 45.0–59.9 | 30.0–44.9 | < 30.0 |
| No. of countries with studies/no. of studies conducted/no. of countries in stratum | 11/23/35 | 12/17/50 | 8/13/42 | 4/11/35 | 4/12/30 |
DTP3, third dose of diphtheria–tetanus–pertussis vaccine; GNI, gross national income; log, logarithm; PPP, purchasing power parity; WHO, World Health Organization.
This paper explores how estimates of the number of child deaths from rotavirus diarrhoea and their uncertainty change when different model structures and covariates are included in the model used to estimate the proportion of diarrhoea deaths caused by rotavirus. Furthermore, we show how Bayesian model averaging can be used to account for model uncertainty.
Methods
The WHO model is based on the 76 prospective observational studies previously mentioned, all of which lasted for at least one year and were conducted between 1990 and 2004. Each study reported data on the proportion of diarrhoea hospitalizations among children less than 5 years of age in whom rotavirus was detected, and this proportion was used as a proxy for the proportion of diarrhoea deaths caused by rotavirus. For the purposes of this illustrative example, we have assumed that the proxy is valid.7,8 The inverse of the sample variance of this proportion was the only factor used to weight the studies, although measures of study quality could have been easily incorporated into the models. All other data used to model the proportion of diarrhoea deaths caused by rotavirus were gathered through the WHO Statistical Information System.
Strata models
Table 2 shows the variables used to stratify countries and believed to be associated with the proportion of diarrhoea deaths caused by rotavirus based on consultation with expert WHO staff, including a co-author, and a review of the existing literature on estimates of the global burden of rotavirus infection.6–11 Although other relevant covariates certainly exist, to predict the proportion of diarrhoea deaths caused by rotavirus in each country we were restricted to using only those covariates that were available for all countries. Since WHO initially estimated the burden of rotavirus deaths in children by dividing countries into five strata based on under-5 mortality and geography, we compared the WHO estimate with the results obtained with models in which countries were stratified according to the criteria listed in Table 1. We chose these criteria so that the five strata would have approximately equal ranges of the covariate.
Table 2. Additional covariates considered for predicting the percentage of diarrhoea deaths caused by rotavirus in each WHO Member State.
| Variable | Year data collected | Source |
|---|---|---|
| Life expectancy at birth in males (years) | 2004 | WHOSIS |
| Life expectancy at birth in females (years) | 2004 | WHOSIS |
| Under-5 mortality rate (per 1 000 live births) | 2004 | WHOSIS |
| Infant mortality rate (per 1 000 live births) | 2004 | WHOSIS |
| % DPT3 immunization coverage among 1-year-olds | 2004 | WHOSIS |
| Per capita GNI (in PPP international dollars) | 2004a | WHOSIS if availableb |
| Natural log of per capita GNI (in PPP international dollars) | 2004a | WHOSIS if availableb |
| % urban population | 2005 | WHOSIS |
DTP3, third dose of diphtheria–tetanus–pertussis vaccine; GNI, gross national income; log, logarithm; PPP, purchasing power parity; WHO, World Health Organization; WHOSIS, WHO Statistical Information System.
a The year closest to 2004 was used if 2004 estimates were unavailable.
b When WHOSIS data were not available, we used corresponding estimates from The world factbook.13 The data collected from the The world factbook were actually the gross domestic products (in PPP international dollars). Other sources reporting GNI (in PPP international dollars), such as The World Bank, contained the same missing values as the WHOSIS.14
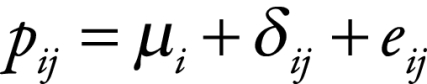
We performed a DerSimonian and Laird random-effects meta-analysis to estimate the mean proportion of diarrhoea deaths in children caused by rotavirus in each stratum and its standard error.12 More specifically, for each study j in stratum i we assumed that
 |
(1) |
where  is the proportion of diarrhoea deaths due to rotavirus,
  is the mean proportion across stratum i,
  is the between-study random effect and
  is the within-study random error. We assumed that both
  and
and  were independent and normally distributed. For consistency with the WHO model, we used the user-contributed package, rmeta, in the statistical computing language R (R Project for Statistical Computing, Vienna, Austria) to fit these models. For consistency with other studies of disease burden, we used Monte Carlo methods in all the models with which we estimated the global disease burden and its CI.7,8 We drew 10 000 parameter estimates from their sampling distributions and used them to estimate the disease burden. The mean was used as the global burden estimate and percentiles 2.5 and 97.5 were used as the CI bounds.
For comparison purposes only, the estimated proportion of diarrhoea deaths caused by rotavirus was determined using a random effects meta-analysis with all 76 studies grouped into a single stratum.
Regression models
While stratifying the study data does reduce some of the between-study variability, van Houwelingen et al. have noted the importance of exploring all sources of study heterogeneity by including study-level covariates.15 Including additional predictors can also account for the fact that the 76 studies may not represent a random sample of diarrhoea deaths in children, a critical assumption in meta-analysis.16 Because few study-level covariates were consistently reported, we used country-level covariates instead, just as we used country-level covariates to stratify the studies.
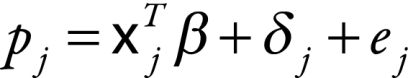
To include continuous country-level covariates and still separate within-study error from between-study error, a mixed-effects model or a meta-regression model was fitted using maximum likelihood in SAS version 9.1 (SAS Institute, Cary, United States of America).15 In principle, the model is quite similar to the one described by Equation 1, only instead of just including indicator variables for each stratum we allowed continuous covariates to be included and assumed that the variance in the between-study error was the same across all studies. Specifically, we assumed that
 |
(2) |
where  is the proportion of diarrhoea deaths due to rotavirus in study j,
  is the vector of country-level covariates,
  is the vector of country-level parameters,
  is the between-study random effect and
  is the within-study error. As before, both
  and
and  were assumed to be independent and normally distributed.
We again considered models with the covariates listed in Table 2. To derive a set of models we used a combination of expert knowledge and numerical methods. Among the eight variables considered for inclusion, models with every combination of one, two and three variables were fit and the Bayesian information criterion (BIC) was tabulated for each model.17 BIC is a measure of how well the model fits the data but penalizes models with a larger number of covariates; lower BICs indicate better fits.
Model averaging
To account for model uncertainty, we averaged across several models rather than choosing a single model’s results. The BIC can be used to empirically approximate the posterior probability of the model, which represents the likelihood that the model is correct.3,18 These posterior model probabilities can be used to derive an overall averaged point estimate and a standard error that includes model uncertainty.3–5 To obtain the model-averaged point estimate,  , of the number of child deaths caused by rotavirus
  , we averaged the estimates from each of the different models,
 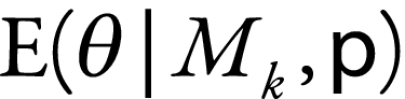 , weighted by how strongly the data supported each model or the posterior probability,
  :
:
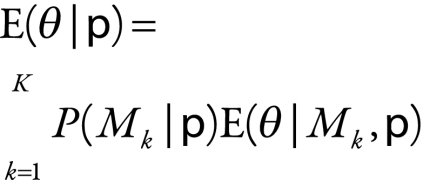 |
(3) |
where  is the vector of study data, K is the total number of models considered, and
  is model k.
The model-averaged estimated variance of the burden estimate,  , is given by:
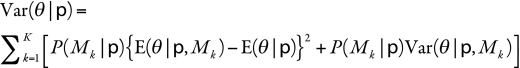 |
(4) |
where 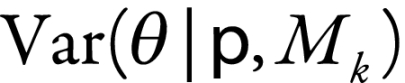 is the variance of the estimate of the number of global childhood deaths from rotavirus infection in model k. The model-averaged variance takes into account both the variability in each model’s estimate due to sampling variability (second term) and the variability between the different models or model uncertainty (first term).
To compare the quality of the strata models to that of the meta-regression models, the stratification models were refit using maximum likelihood to obtain a valid BIC, which only slightly alters the standard error estimates. Because one stratum in the WHO model had only one study assigned to it, WHO used some studies assigned to other strata to also estimate the proportion in the stratum with one study.8 A statistical comparison with other models that did not use those studies twice is invalid. A conceptually similar but slightly different stratification scheme was used for comparisons and is referred to as the WHO alternative model (Table 1).
Results
Stratification models
The one-stratum model, which was constructed for comparative purposes only, produced a point estimate of 664 000 child deaths (95% CI: 608 000–721 000). This is substantially greater than the WHO’s estimate of 527 000 (CI: 475 000–580 000). Among the models with five strata, large variability was noted in the estimated number of rotavirus deaths among children (Fig. 1, Table 3). Point estimates ranged from 526 000 to 630 000 deaths. The stratification methods that used mortality rates other than under-5 mortality yielded point estimates similar to each other and ranging from 526 000 to 537 000 deaths. All but one of these strata models yielded predictions greater than the WHO estimate. The lengths of the model-based CIs were fairly consistent between models. Among the stratification models, the alternative WHO model best fit the data according to the BIC.
Fig. 1.
Point estimatesa and Monte Carlo 95% confidence intervals (CIs) for the models developed from stratifying countries into five stratab based on the variables listed
DTP3, third dose of diphtheria–tetanus–pertussis vaccine; GNI, gross national income; log, logarithm; WHO, World Health Organization.
a The vertical corresponds to the WHO estimate.
b Cut-off values for each stratum are presented in Table 1.
c “WHO” refers to the stratification method used by the WHO.
d “WHO alternative” refers to the WHO stratification method with a slight adjustment (Table 1).
e The model average estimate averages across all the models here except for the WHO model.

Table 3. Results obtained by means of Monte Carlo estimates from model-derived meta-analysis on five separate strataa.
| Stratification variable | Estimated no. of rotavirus deathsb | SE | CI | CI width | BIC | Posteriorc (%) |
|---|---|---|---|---|---|---|
| WHO model | 527 000 | 26 800 | 475 000–580 000 | 105 000 | NA | NA |
| Alternative WHO model | 530 000 | 26 500 | 477 000–582 000 | 105 000 | −101.6 | 57.268 |
| Female life expectancy | 537 000 | 32 900 | 473 000–601 000 | 128 000 | −97.2 | 6.345 |
| Male life expectancy | 536 000 | 30 600 | 476 000–596 000 | 121 000 | −97.5 | 7.372 |
| Infant mortality rate (per 1 000 live births) | 526 000 | 29 800 | 467 000–585 000 | 118 000 | −100.2 | 28.438 |
| Under-5 mortality rate (per 1 000 live births) | 555 000 | 36 200 | 485 000–627 000 | 142 000 | −87.8 | 0.058 |
| % DTP3 immunization coverage among 1-year-olds | 574 000 | 36 000 | 503 000–646 000 | 143 000 | −92.1 | 0.495 |
| Natural log of per capita GNI (in PPP international dollars) | 609 000d | 34 300 | 542 000–676 000 | 135 000 | −85.8 | 0.021 |
| % urban population | 630 000d | 52 900 | 527 000–734 000 | 206 000 | −81.1 | 0.002 |
| Model average | 530 000 | 28 700 | 473 000–586 000 | 112 000 | NA | NA |
CI, confidence interval; BIC, Bayesian information criterion; DTP3, third dose of diphtheria–tetanus–pertussis vaccine; GNI, gross national income; log, logarithm; NA, not applicable; PPP, purchasing power parity; SE, standard error; WHO, World Health Organization.
a The model average estimate averages across all the models here except for the WHO model.
b In children < 5 years old.
c This represents the posterior probability of all models except the WHO model.
d This estimate was outside the 95% CI in the World Health Organization model.
Meta-regression models
Within the meta-regression models, the model that included the infant mortality rate and the natural logarithm of gross national income per capita was found to best fit the data according to the BIC (Table 4). The 20 models with the lowest BIC scores showed little difference in BIC scores. In spite of the models’ comparable predictive capacity, differences in the estimated number of rotavirus deaths in children were large, having ranged from 492 000 to 588 000 (Fig. 2). Two of the point estimates of those 20 models exceeded the limits of the 95% CI of the WHO model. In fact, the CIs yielded by the models produced by meta-regression were all wider than those produced by WHO and by most of the other stratification models. The stratification models impose a stronger assumption that the mean proportion is constant over all countries in a particular stratum, which leads to narrower CIs. The BIC scores for the meta-regression models were all considerably lower than the stratification models, including the alternative WHO model. This suggests that meta-regression models can achieve improved prediction over stratification models.
Table 4. Number of rotavirus deaths obtained through Monte Carlo estimates from the 20 burden of disease models with the lowest Bayesian information criterion (BIC)a.
| Variables included in model | Deathsb (no.) | SE | CI | CI width | BIC | Posteriorc (%) |
|---|---|---|---|---|---|---|
| Natural log of per capita GNI & infant mortality | 513 000 | 43 700 | 428 000–599 000 | 171 000 | −114.0 | 16.12 |
| Infant mortality | 534 000 | 43 900 | 448 000–620 000 | 172 000 | −113.9 | 15.33 |
| Under-5 mortality | 549 000 | 41 400 | 468 000–630 000 | 162 000 | −113.1 | 10.28 |
| Female life expectancy | 574 000 | 35 800 | 504 000–644 000 | 140 000 | −112.7 | 8.42 |
| Per capita GNI & infant mortality | 522 000 | 43 700 | 436 000–607 000 | 171 000 | −112.4 | 7.24 |
| Male life expectancy | 574 000 | 36 200 | 503 000–645 000 | 142 000 | −112.3 | 6.89 |
| Natural log of per capita GNI & female life expectancy | 588 000d | 36 000 | 517 000–658 000 | 141 000 | −111.3 | 4.18 |
| Natural log of per capita GNI & child life expectancy | 545 000 | 40 800 | 465 000–625 000 | 160 000 | −111.2 | 3.98 |
| Per capita GNI & female life expectancy | 575 000 | 35 200 | 506 000–644 000 | 138 000 | −110.9 | 3.42 |
| Natural log of per capita GNI, infant mortality, under-5 mortality | 496 000 | 47 300 | 403 000–588 000 | 185 000 | −110.6 | 2.94 |
| Per capita GNI & under-5 mortality | 547 000 | 41 100 | 466 000–627 000 | 161 000 | −110.3 | 2.53 |
| Per capita GNI & male life expectancy | 575 000 | 35 600 | 506 000–645 000 | 140 000 | −110.3 | 2.53 |
| Natural log of per capita GNI & infant mortality & % urban population | 506 000 | 44 900 | 418 000–594 000 | 176 000 | −110.1 | 2.29 |
| Infant mortality & % urban population | 536 000 | 43 900 | 450 000–622 000 | 172 000 | −110.0 | 2.18 |
| Per capita GNI & infant mortality & under-5 mortality | 492 000d | 48 300 | 398 000–587 000 | 189 000 | −109.9 | 2.08 |
| Natural log of GNI & male life expectancy | 585 000 | 36 600 | 513 000–657 000 | 144 000 | −109.8 | 1.97 |
| Per capita GNI & natural log of GNI & infant mortality | 513 000 | 43 700 | 427 000–598 000 | 171 000 | −109.8 | 1.97 |
| Infant mortality & under-5 mortality | 527 000 | 46 900 | 435 000–619 000 | 184 000 | −109.7 | 1.88 |
| Infant mortality & male life expectancy | 525 000 | 52 500 | 422 000–628 000 | 206 000 | −109.7 | 1.88 |
| Infant mortality & female life expectancy | 520 000 | 58 200 | 406 000–634 000 | 228 000 | −109.7 | 1.88 |
| Model average | 540 000 | 49 800 | 443 000–638 000 | 195 000 | NA | NA |
CI, confidence interval; GNI, gross national income; log, logarithm; NA, not applicable; SE, standard error.
a The model average estimate averages across all the models here.
b In children < 5 years old.
c This represents the posterior probability of all models.
d This estimate was outside the 95% CI in the World Health Organization model.
Fig. 2.
Point estimatesa and Monte Carlo 95% confidence intervals (CIs) for the 20 models with the lowest Bayesian information criterion (BIC) developed from meta-regressionb
a The vertical line corresponds to the World Health Organization estimate.
b Based on the covariates in Table 2.
c The model average estimate averages across all the models here.

Model-averaged results
The model-averaged point estimates of the global burden of rotavirus deaths in children for each of the two broad methods (five strata and meta-regression) were similar to each other and to the WHO estimate, but the CIs were all considerably wider than the WHO’s. The model-averaged estimate of the number of deaths among all stratification models with five strata, 530 000 deaths, was similar to the point estimates of the individual models that stratified by mortality. The 95% CI interval, 473 000 to 586 000 deaths, was moderately wider than the CI yielded by the WHO model. Among the top 20 meta-regression models, the model-averaged estimate of the number of rotavirus deaths in children, 540 000, was slightly larger than the WHO estimate, and the 95% CI: 443 000 to 638 000 deaths, was far wider (195 000 versus 105 000 deaths). Averaging across all the models considered gave an estimated number of childhood rotavirus deaths of 541 000 with a 95% CI of 442 000 to 640 000 deaths, almost identical to the model-averaged results of the meta-regression models.
Discussion
The confidence limits of each model developed only account for variability in the data. Repeating the process of conducting 76 studies would yield slightly different results owing to sampling variability, which is captured by each model’s standard errors. However, the estimates between the different models exhibit substantial variability that is not taken into account by the model-based standard errors. Even after limiting the models considered to only the stratification models and the 20 regression models with the lowest BIC, the estimated number of rotavirus deaths in children in 2004 ranged from 492 000 to 664 000. This variability exists within each particular class of models.
Widely varying predictions between different models does not automatically suggest that one must account for model uncertainty because the quality of the models or their posterior probabilities should also be considered. Several poor models will yield highly variable predictions in the burden estimates, but because the model-average point estimate (Equation 3) and Equation 4 are weighted by the model quality, 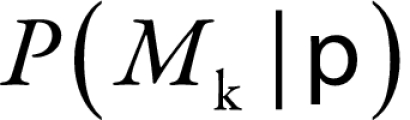 , models poorly supported by the data do not practically affect the model average point estimate or increase the model uncertainty. Our concern arises when good fitting models lead to variable predictions.
For example, among the meta-regression models, all 20 of the models with the lowest BIC scores were strongly supported by the data. Even the 20 best models yielded significant variability (95 000 deaths) in the estimated global burden. In this case, choosing a single set of covariates is clearly inadequate because many models that are well supported by the data give vastly different estimates of the number of rotavirus deaths in children. However, the overall model-averaged estimate of the global burden of diarrhoea deaths caused by rotavirus among children and its uncertainty are quite similar to the model average and uncertainty from the meta-regression models, since the strata models are poorly supported by the data. The data also suggest that limiting consideration to just stratification models (i.e. to a single type of model structure) is a poor decision since the data more strongly support the meta-regression models.
The results suggest that the uncertainty captured due to sampling variability is only a portion of the overall uncertainty in the estimate. Model uncertainty represents another source of variability that must be accounted for in the model. Model averaging over a broad class of models in the case of the disease burden estimates for childhood diarrhoea rotavirus deaths increases the width of the 95% CI from 105 000 to 198 000 deaths. By not accounting for model uncertainty, the WHO model substantially understates the level of uncertainty of its estimates.
Besides the model selected by WHO, many others could also produce reasonable results. The alternative models we selected are only a subset of all possible models. From a statistical perspective, we could have allowed the covariates to vary nonlinearly with the response or allowed some parameters to be estimated at the regional level (hierarchical model). For the rotavirus example presented in this paper, we lacked enough data to reliably estimate parameters at the regional level or to entertain nonlinear functional forms. From an epidemiologic perspective, we could have considered using several different methods, including a natural history model, to estimate the number of rotavirus deaths. Different epidemiologic approaches would have probably increased the model uncertainty substantially. Unfortunately, the data available to us did not allow us to consider other modelling approaches in this application. For other disease burden estimates, a broader class of models could be considered, but the underlying message remains the same: different model choices result in variable burden estimates and model averaging provides an attractive way of accounting for model uncertainty.
The methods used in this study to develop new measures for quantifying the uncertainty in the estimated global burden of childhood deaths from rotavirus diarrhoea illustrates the importance of accounting for model uncertainty and are applicable to other disease burden estimations. Since the accuracy of the data needed to inform different policy decisions will vary, failure to accurately describe the uncertainty surrounding disease burden estimates may lead to inappropriate uses of the data. WHO needs to publish disease burden estimates that fully describe the uncertainty so that its Member States can accurately prioritize global health problems and spend public health money in a cost-effective way. Furthermore, by overestimating certainty in disease burden estimates, epidemiologists downplay the need for improvements in disease surveillance and statistical capacity. Whenever a statistical model is used to estimate disease burden, we recommend developing multiple candidate models and assessing the quality of the models using fit statistics such as BIC or Akaike’s information criterion or, in the Bayesian context, posterior model probability.5,19 If a large amount of variability exists between model results that are strongly supported by the data, then model averaging should be used to account for model uncertainty.
Funding:
United States National Science Foundation Grant No. 0354308.
Competing interests:
None declared.
References
- 1.Mathers CD, Salomon JA, Ezzati M, Begg S, Vander Hoorn S, Lopez AD. Sensitivity and uncertainty analyses for burden of disease and risk factor estimates. In: Lopez AD, Mathers CD, Ezzati M, Jamison DT, Murray CJL, editors. Global burden of disease and risk factors New York: Oxford University Press; 2006. pp.399-426. doi:10.1596/978-0-8213-6262-4/Chpt-5. 10.1596/978-0-8213-6262-4/Chpt-5 [DOI] [PubMed] [Google Scholar]
- 2.Murray CJL, Mathers CD, Salomon JA. Towards evidence-based public health. In: Murray CJL, Evans DB, editors. Health systems performance assessment: debates, methods and empiricisms Geneva: World Health Organization; 2003. pp.715-26. [Google Scholar]
- 3.Raftery AE. Bayesian model selection in social research. Sociol Methodol. 1995;25:111–63. doi: 10.2307/271063. [DOI] [Google Scholar]
- 4.Raftery AE, Madigan D, Hoeting J. Bayesian model averaging for regression models. J Am Stat Assoc. 1997;92:179–91. doi: 10.2307/2291462. [DOI] [Google Scholar]
- 5.Hoeting J, Madigan D, Raftery AE, Volinsky C. Bayesian model averaging: a tutorial. Stat Sci. 1999;14:382–417. doi: 10.1214/ss/1009212814. [DOI] [Google Scholar]
- 6.Bresee JS, Parashar UD, Widdowson M-A, Gentsch JR, Steele AD, Glass RI. Update on rotavirus vaccines. Pediatr Infect Dis J. 2005;24:947–52. doi: 10.1097/01.inf.0000186295.18969.e6. [DOI] [PubMed] [Google Scholar]
- 7.Global and national estimates of deaths under age five attributable to rotavirus infection Geneva: World Health Organization; 2006. Available from: http://www.who.int/immunization_monitoring/burden/Global_national_estimates_2004_deaths_under_age_five_attributable_to_rotavirus_infection_2004.pdf [accessed 20 October 2009].
- 8.Parashar UD, Burton A, Lanata C, Boschi-Pinto C, Shibuya K, Steele D, et al. Global mortality associated with rotavirus disease among children in 2004. J Infect Dis. 2009;200(Suppl 1):S9–15. doi: 10.1086/605025. [DOI] [PubMed] [Google Scholar]
- 9.Bryce J, Boschi-Pinto C, Shibuya K, Black RE, WHO Child Health Epidemiology Reference Group WHO estimates of the causes of death in children. Lancet. 2005;365:1147–52. doi: 10.1016/S0140-6736(05)71877-8. [DOI] [PubMed] [Google Scholar]
- 10.Parashar UD, Hummelman EG, Bresee JS, Miller MA, Glass RI. Global illness and deaths caused by rotavirus disease in children. Emerg Infect Dis. 2003;9:565–72. doi: 10.3201/eid0905.020562. [DOI] [PMC free article] [PubMed] [Google Scholar]
- 11.Parashar UD, Gibson CJ, Bresse JS, Glass RI. Rotavirus and severe childhood diarrhea. Emerg Infect Dis. 2006;12:304–6. doi: 10.3201/eid1202.050006. [PMID: 16494759.] [DOI] [PMC free article] [PubMed] [Google Scholar]
- 12.DerSimonian R, Laird N. Meta-analysis in clinical trials. Control Clin Trials. 1986;7:177–88. doi: 10.1016/0197-2456(86)90046-2. [DOI] [PubMed] [Google Scholar]
- 13.The world factbook Washington: Central Intelligence Agency; 2009. Available from: https://www.cia.gov/library/publications/the-world-factbook/index.html [accessed 8 October 2010].
- 14.WHO Statistical Information System. Geneva: World Health Organization; 2010. Available from: http://www.who.int/gho/countries/en/ [accessed 8 October 2010].
- 15.van Houwelingen HC, Arends LR, Stijnen T. Advanced methods in meta-analysis: multivariate approach and meta-regression. Stat Med. 2002;21:589–624. doi: 10.1002/sim.1040. [DOI] [PubMed] [Google Scholar]
- 16.Fleiss JL. The statistical basis of meta-analysis. Stat Methods Med Res. 1993;2:121–45. doi: 10.1177/096228029300200202. [DOI] [PubMed] [Google Scholar]
- 17.Schwarz G. Estimating the dimension of a model. Ann Stat. 1978;6:461–4. doi: 10.1214/aos/1176344136. [DOI] [Google Scholar]
- 18.Jackson CH, Thompson SG, Sharples LD. Accounting for uncertainty in health economic decision models by using model averaging. J R Stat Soc Ser A Stat Soc. 2009;172:383–404. doi: 10.1111/j.1467-985X.2008.00573.x. [DOI] [PMC free article] [PubMed] [Google Scholar]
- 19.Akaike H. A new look at the statistical model identification. IEEE Trans Automat Contr. 1974;19:716–23. doi: 10.1109/TAC.1974.1100705. [DOI] [Google Scholar]