Introduction
According to the most recent estimates from the World Health Organization (WHO) and Joint United Nations Programme on HIV/AIDS (UNAIDS),1,2 42% of all HIV-positive individuals who were needing antiretroviral treatment (ART) at the end of 2008 were receiving treatment. This is a substantial increase on the level of 33% coverage at the end of the previous year. Coverage is defined as the number of individuals receiving ART at a point in time divided by the number of individuals who are eligible to receive treatment at the same point in time (including those who are already receiving ART).2 This is a cross-sectional measure, a “snapshot” of the cumulative ART enrolment relative to the “backlog” of unmet need, at a point in time. The measure is widely used and is the indicator of ART access that is currently recommended by the United Nations General Assembly Special Session on HIV/AIDS (UNGASS).
Changes in enrolment
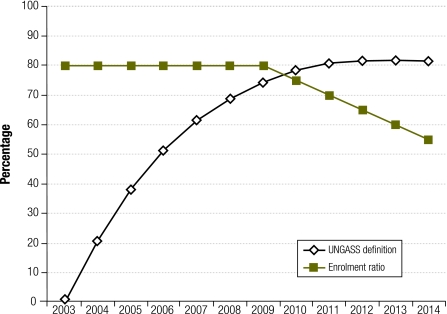
As ART programmes mature, the increasing number of patients on ART, included in both the numerator and denominator, render the measure increasingly insensitive to annual changes in ART enrolment. Consider, for example, a hypothetical country that has 30 000 untreated individuals in need of ART at the start of the year 2000, with 10 000 patients becoming eligible to receive ART in each year, from 2000 onwards. If the country started enrolling patients on ART at a rate of 8000 per annum from 2003 onwards, it could expect to have coverage of close to 80% by the start of 2010 (details of the calculations available at: http://tinyurl.com/45hxwgm). However, if the annual number of patients enrolled on ART were to drop by 500 per annum, from the start of 2010, coverage after 2010 would remain relatively stable at around 80%, even though the numbers of patients starting ART are decreasing relative to the numbers of patients becoming eligible to receive ART (Fig. 1). In this situation, the currently used ART coverage measure says relatively little about recent programme performance. The measure is heavily influenced by the length of time that an ART programme has been running. Recently introduced programmes are likely to have lower coverage than programmes that have been running for several years, even if they are currently enrolling patients at a higher rate.
Fig. 1.
Comparison of definitions of access to antiretroviral treatment (ART) in a hypothetical countrya
UNGASS, United Nations General Assembly Special Session on HIV/AIDS.
a The UNGASS coverage definition is the number of patients on ART divided by the number of individuals eligible to receive ART. The enrolment ratio is the ratio of patients starting ART to newly eligible individuals.
Changes in eligibility
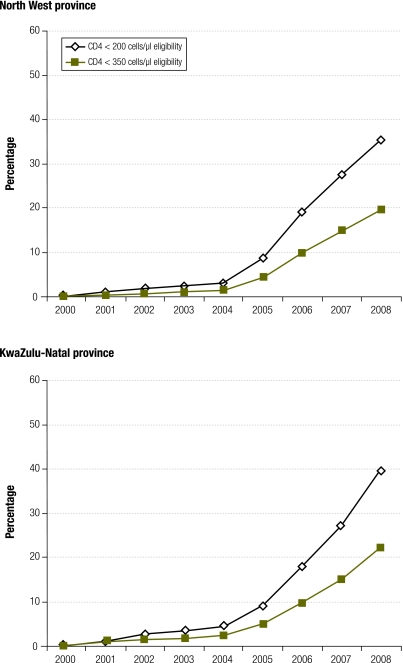
The current coverage definition is also very sensitive to the ART eligibility criteria. This is illustrated in Fig. 2, which shows ART coverage estimates for two of South Africa’s provinces based on a previously described analysis.3 In the North West province, ART coverage in adults is shown to decrease from 35% to 20% in 2008 if the CD4 threshold for eligibility changes from 200 cells/μl to 350 cells/μl. In 2009, WHO recommended this new threshold for ART initiation in adults which has since been adopted by many countries. This change could therefore result in significant decreases in cross-sectional estimates of coverage, in spite of countries enrolling greater numbers of patients onto ART.
Fig. 2.
Estimated levels of adult access to antiretroviral treatment (ART) using UNGASS definition in North West and KwaZulu-Natal provinces, South Africaa
UNGASS, United Nations General Assembly Special Session on HIV/AIDS.
a The UNGASS coverage definition is the number of patients on ART divided by the number of individuals eligible to receive ART.
An enrolment ratio
To complement the interpretation of ART programme data, it would be beneficial to consider a second definition of ART access: the ratio of ART initiation to HIV disease progression. The numerator is the number of individuals starting ART in a given year, and the denominator is the number of individuals becoming eligible for ART in the same year, according to the ART guidelines that are in place during that year. This enrolment ratio is a longitudinal measure rather than a cross-sectional measure, as it requires estimates of numbers of events over a one-year period.
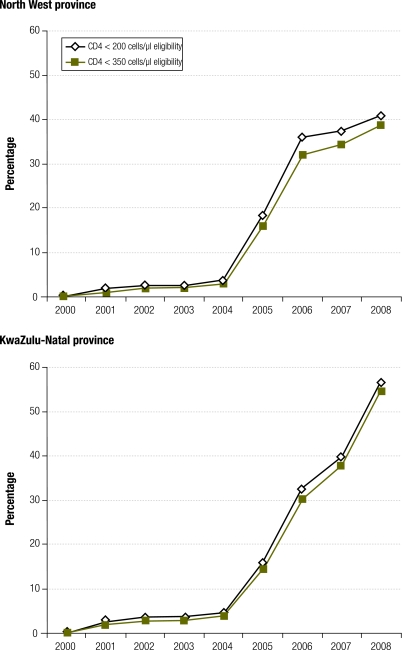
The primary advantage of this enrolment ratio is that it is a better indicator of recent programme performance. For example, although the North West and KwaZulu-Natal provinces in South Africa have similar levels of coverage according to the standard UNGASS definition (Fig. 2), the enrolment ratio shows that the rate at which patients are enrolled onto ART has started to slow down in the North West province in recent years, but has increased dramatically in KwaZulu-Natal (Fig. 3). The hypothetical example in Fig. 1 also demonstrates that the enrolment ratio reflects the decline in the numbers of patients enrolled on ART after 2009.
Fig. 3.
Estimated levels of adult access to antiretroviral treatment (ART) using enrolment ratio definition in North West and KwaZulu-Natal provinces, South Africaa
a The enrolment ratio is the ratio of patients starting ART to newly eligible individuals.
A second advantage of this measure is that it is relatively insensitive to the way in which ART eligibility is defined. For example, the enrolment ratio in 2008 in KwaZulu-Natal is 57% if eligibility is defined as CD4 < 200 cells/μl, and 55% if eligibility is defined as CD4 < 350 cells/μl (Fig. 3). This is because the denominator, the number of individuals whose CD4 counts drop below a particular threshold in a given period, will be relatively insensitive to the choice of CD4 threshold if HIV incidence rates have been roughly stable in recent years.
A related advantage is that the measure is also relatively insensitive to model assumptions about the rates of mortality and CD4 decline in untreated individuals. Regardless of the measure of ART access, mathematical models are usually required to estimate the denominator in ART-access calculations. This introduces a major source of uncertainty, as rates of mortality and CD4 decline in untreated individuals are difficult to quantify accurately, and may well vary between populations. For example, when using seven different sets of estimated CD4 transition rates,4–7 the range of variation in model estimates of coverage in the North West province in 2008 (according to the < 350 cells/μl definition) is 22% of the mean, using the standard UNGASS definition of coverage. However, when the same sets of CD4 transition rates are used in the model, and ART access is instead defined as the ratio of ART initiation to HIV progression, the range of variation in ART-access estimates is only 12% of the mean. This reduction in uncertainty occurs because the unmet need for ART at a point in time is more sensitive to assumptions about rates of CD4 decline than is the number of individuals crossing a particular CD4 threshold over a period of time.
Another potential advantage of the enrolment ratio is that the numerator is the number of patients starting ART in a period, rather than the number of individuals currently receiving ART. The former may be easier for some countries to report, although it may be subject to double counting errors if ART patients who are transferred from one clinic to another are counted as “new” ART patients. In countries that do not routinely collect data on new enrolment, additional costs may be incurred in collecting this information. The potential for double counting and the potential costs of additional data collection are disadvantages of the enrolment ratio, although it is possible to estimate the number of patients starting ART from the number of patients currently on ART if the latter is considered more reliable or if it is the only information available (more information available at http://tinyurl.com/45hxwgm).
The enrolment ratio is relatively easy to apply to children. Under the new paediatric ART guidelines, all infected children aged less than 24 months are considered to be eligible for ART. The denominator for the enrolment ratio can therefore be calculated as the number of new HIV infections in children – assuming that almost all of these occur before the age of 24 months. Using the standard UNGASS definition of ART coverage in children requires an estimation of numbers of children aged more than 24 months with CD4 counts below specified limits. This is difficult because of the lack of long-term disease progression data from untreated HIV-positive children in developing countries.
A potential disadvantage of the enrolment ratio is that it is a ratio rather than a proportion, which makes the measure more difficult to interpret. For example, it is possible to obtain a ratio of ART initiation to HIV progression in excess of one if there are more people starting ART than becoming eligible for ART in a particular period. This does not imply that there are more people on ART than people who need it, although the result could be misinterpreted as such. The definitions of the numerator and denominator may also be more difficult to communicate to individuals familiar with cross-sectional measures of ART access. The standard UNGASS indicator is still needed because the enrolment ratio does not provide information about the “backlog” of unmet need.
Conclusion
The current globally agreed definition of cumulative ART coverage has proved an invaluable tool for promoting the systematic estimation of ART coverage at country level and for holding countries accountable through reporting requirements, such as those requested by UNGASS. As programmes mature and funding for ART becomes more uncertain, there is however a need to expand reporting of ART access to include measures of recent enrolment. We have proposed one such definition to complement the existing UNGASS definition of ART coverage. The ratio of ART initiation to HIV progression is not only a better reflection of recent programme performance, but also a more robust measure that is less sensitive to model assumptions and to changes in ART eligibility criteria.
Acknowledgements
We thank Mary Mahy for her helpful comments.
Competing interests:
None declared.
References
- 1.Towards universal access: scaling up priority HIV/AIDS interventions in the health sector Geneva: World Health Organization; 2009. Available from: http://www.who.int/hiv/pub/tuapr_2009_en.pdf [accessed 5 Oct 2009].
- 2.Mahy M, Tassie JM, Ghys PD, Stover J, Beusenberg M, Akwara P, et al. Estimation of antiretroviral therapy coverage: methodology and trends. Curr Opin HIV AIDS. 2010;5:97–102. doi: 10.1097/COH.0b013e328333b892. [DOI] [PubMed] [Google Scholar]
- 3.Adam MA, Johnson LF. Estimation of adult antiretroviral treatment coverage in South Africa. S Afr Med J. 2009;99:661–7. [PubMed] [Google Scholar]
- 4.Hendriks JC, Craib KJ, Veugelers PJ, van Druten HA, Coutinho RA, Schechter MT, et al. Secular trends in the survival of HIV-infected homosexual men in Amsterdam and Vancouver estimated from a death-included CD4-staged Markov model. Int J Epidemiol. 2000;29:565–72. doi: 10.1093/ije/29.3.565. [DOI] [PubMed] [Google Scholar]
- 5.Hendriks JC, Satten GA, Longini IM, van Druten HA, Schellekens PT, Coutinho RA, et al. Use of immunological markers and continuous-time Markov models to estimate progression of HIV infection in homosexual men. AIDS. 1996;10:649–56. doi: 10.1097/00002030-199606000-00011. [DOI] [PubMed] [Google Scholar]
- 6.Satten GA, Longini IM. Markov chains with measurement error: estimating the 'true' course of a marker of the progression of human immunodeficiency virus disease. Appl Stat. 1996;45:275–309. doi: 10.2307/2986089. [DOI] [Google Scholar]
- 7.Longini IM, Clark WS, Gardner LI, Brundage JF. The dynamics of CD4+ T-lymphocyte decline in HIV-infected individuals: a Markov modeling approach. J Acquir Immune Defic Syndr. 1991;4:1141–7. [PubMed] [Google Scholar]


