Abstract
Building photoacoustic imaging (PAI) systems by using stand-alone ultrasound (US) units makes it convenient to take advantage of the state-of-the-art ultrasonic technologies. However, the sometimes limited receiving sensitivity and the comparatively narrow bandwidth of commercial US probes may not be sufficient to acquire high quality photoacoustic images. In this work, a high-speed PAI system has been developed using a commercial US unit and a custom built 128-element piezoelectric-polymer array (PPA) probe using a P(VDF-TrFE) film and flexible circuit to define the elements. Since the US unit supports simultaneous signal acquisition from 64 parallel receive channels, PAI data for synthetic image formation from a 64 or 128 element array aperture can be acquired after a single or dual laser firing, respectively. Therefore, 2D B-scan imaging can be achieved with a maximum frame rate up to 10 Hz, limited only by the laser repetition rate. The uniquely properties of P(VDF-TrFE) facilitated a wide -6 dB receiving bandwidth of over 120 % for the array. A specially designed 128-channel preamplifier board made the connection between the array and the system cable which not only enabled element electrical impedance matching but also further elevated the signal-to-noise ratio (SNR) to further enhance the detection of weak photoacoustic signals. Through the experiments on phantoms and rabbit ears, the good performance of this PAI system was demonstrated.
Keywords: Photoacoustic imaging, P(VDF-TrFE) transducer, Broad bandwidth, Real-time imaging, Vasculature
INTRODUCTION AND LITERATURE
Photoacoustic imaging (PAI), which is also referred to as optoacoustic imaging or thermoacoustic imaging, is an emerging technology combining the merits of both light and ultrasound. In PAI, a short-pulsed laser source is used to illuminate a biological sample. The laser-generated photoacoustic signals, which are excited by thermoelastic expansion resulting from a small transient temperature rise, are measured by a wide-band ultrasonic transducer(s). The acquired signals can then be used to rebuild the distribution of optical energy deposition within the acoustically imaged region of the sample. Although photoacoustic signal propagation in biological tissues is intrinsically high-speed, to achieve signal acquisition fast enough for real-time imaging is still technologically challenging. Many pioneering studies on PAI are based on home-fabricated signal acquisition systems that employ a single transducer or an array with only limited receiving channels (Karabutov, Savateeva 2003, Manohar, Kharine 2005, Wang, Chamberland 2007, Wang, Pang 2003, Xiao, Yao 2010). Therefore, the mechanical or electrical scan of signals for tomographic imaging is time consuming, especially when the laser repetition rate is also limited. Researchers have recently made efforts on accelerating the imaging speed of PAI drastically by developing custom designed systems powered with large amount of channels(Ermilov, Khamapirad 2009, Kruger, Kiser 2003, Li, Aguirre 2010, Song, Maslov 2010, Yang, Maurudis 2009). Most of these imaging systems, however, are very costly and also difficult to be duplicated by other groups when fabrication of sophisticated data acquisition circuits is involved.
By combining with commercial medical US systems, the development of PAI can be accelerated by taking advantage of the state-of-the-art US image processing, management and display technologies (Erpelding, Kim 2010, Kolkman, Brands 2008, Wang, Fowkes 2008, Yaseen, Ermilov 2010). For example, the imaging speed of PAI can be significantly improved by acquiring data from the parallel ultrasound channels each with commercial-grade receiver sensitivity and noise figures. Moreover, PAI results can be more easily reproduced between laboratories when realized with commercially available US. PAI is a natural complement to established US techniques and may significantly enlarge the scope of application of medical US in diagnostic imaging and therapeutic monitoring. An US and PAI dual-modality system may allow nonionizing and noninvasive visualization of both ultrasonic and optical contrast in a biological sample as well as tissue physiological properties including blood flow, volume and oxygen saturation. By presenting comprehensive structural and functional information of a biological sample, the sensitivity and specificity in diagnosis and characterization of a variety of disorders can be substantially improved in comparison with conventional US alone. In comparison with PAI, US is a more established imaging modality. Therefore, interpretation of US images of an object may help guide the PAI procedure and interpretation. The morphological and tissue acoustic information provided by US, e.g. tissue boundaries, acoustic attenuation and speed of sound, may also be used to improve the reconstruction of PAI images, which may elevate the accuracy in quantitative PAI imaging of tissue optical properties and hemodynamic parameters.
Direct use of a commercial US unit to achieve high quality PAI, however, is challenging. Since the signal level in US is typically much higher than those in PAI, and most commercial US systems do not have a high enough SNR nor low enough digitizer threshold for the recovery of weak photoacoustic signals from expected subsurface tissues. Unlike PAI, US involves both ultrasonic signal transmission and receiving; hence piezoelectric or piezoelectric-composite transducers with both good transmission and reception efficiencies are employed to build most US probes. Using piezoelectric arrays, typical US systems have only limited detection bandwidths (e.g. usually less than 80%) which are not sufficient for high quality PAI, especially when realized in a tomographic manner. The photoacoustic signals generated in biological tissues have intrinsically broad bandwidth. It has been demonstrated that the spatial resolution achievable in a tomographic PAI system is highly dependent on its detection bandwidth (Xu and Wang 2003). More importantly, with a broad spatial frequency response, a PAI system will be sensitive to imaging a reasonably broad range of spatial frequencies in the target area, i.e., the broadband system can present the optical absorption distribution in a reasonably wide range of object sizes accurately, without strong edge enhancement or blurring. Moreover, broader detection bandwidth also leads to reduced side lobes.
In this work, a high-speed PAI data acquisition system was developed using a commercial US unit (z.one, Zonare Medical Systems, Inc) and a custom built 128-element piezoelectric-polymer array (PPA). Since the US unit supports simultaneous signal acquisition from 64 parallel receive channels, PAI RF data from a 64-element array aperture can be acquired after a single laser firing. For complete data acquisition with the 128 elements, a minimum of 2 laser pulses are needed. Unlike in some other previously developed photoacoustic imaging systems where PVDF arrays were employed (Ermilov, Conjusteau 2006, Kozhushko, Khokhlova 2004), the custom built probe developed for this system was using P(VDF-TrFE) film and, for the first time, was integrated with a commercial US machine. Although piezoelectric-polymers are not efficient transmitters, their receiving sensitivity is excellent competitive detection of weak photoacoustic signals. More importantly, an array fabricated using piezoelectric-polymer elements provides uniquely broad detection bandwidth, which allows satisfactory image quality for PAI. To further elevate the SNR and also realize impedance matching to the 2-meter cable, the signals received by the PPA are sent to a specially designed 128-channel preamplifier board before digitization in the US unit. That is, the preamplifier board provides a much lower capacitance load for the PPA, efficiently drives the coaxial cables, and further amplifies the signal prior to the digitizers to allow recovery of signals well below the noise level by averaging. Validating the feasibility of PAI imaging by using a commercial US machine and array probes optimized for photoacoustic signal receiving, as completed in this work, should accelerate the development of PAI and US dual-modality imaging and its application in preclinical and clinical settings.
MATERIALS AND METHODS
Imaging system
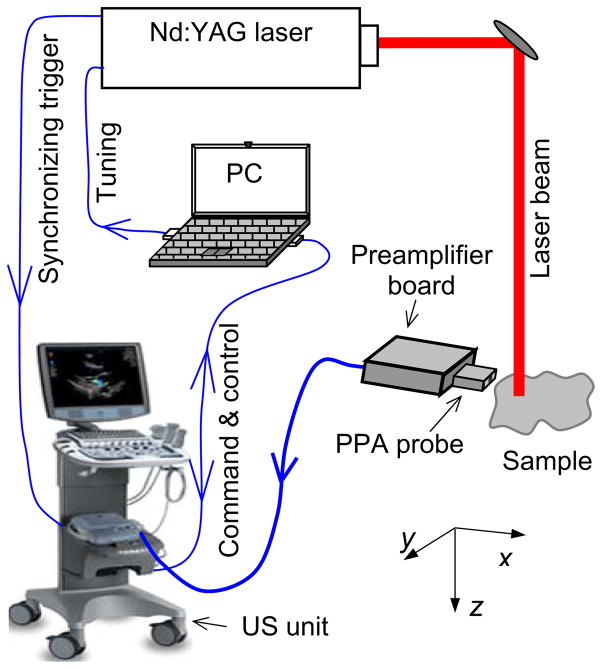
A PAI data acquisition system assembled using a commercially US unit is shown in Fig. 1. A Nd:YAG laser (Powerlite, Continuum) is employed to provide laser pulses with repetition rate of 10 Hz, wavelength of 532 nm, pulse energy up to 0.8 J, and pulse length of 5 ns. The synchronization between the US unit receive cycle and the laser firing is achieved using a frame-trigger signal tapped from the probe connector. To acquire laser-generated photoacoustic signals, the US unit can operate in receive-only mode (with the transmitter turned off) at a frame rate triggered by the 10-Hz repetition rate of the pulsed laser. For each laser pulse, 64 channels of 16-bit I/Q data are acquired from a selectable 64-element sub-aperture of the array. Therefore, for 2D imaging using the data from 64 elements, this system can acquire images in a real-time manner with a maximum frame rate of 10 Hz. When 2D imaging is realized by using the data from complete 128 elements, a minimum of 2 laser pulses are required. If needed, repeat acquisitions are also made to support coherent data averaging for improved SNR. Once the I/Q data including both reconstructed and channel data are captured in the CINE buffer, they are transferred as binary raw data files to an external USB storage device via one of the USB ports of the US unit, or to an FTP site on the external PC via an Ethernet link. On the PC, a MATLAB tool are used to extract the raw I/Q data and associated imaging parameters from binary data files. The RF data from the 64 or 128 elements are then processed using a standard ultrasound dynamic receive focusing algorithm to reconstruct a PAI image.
Fig. 1.
Schematic of a PAI system using a custom PPA probe driven by a commercial US unit
Custom probe
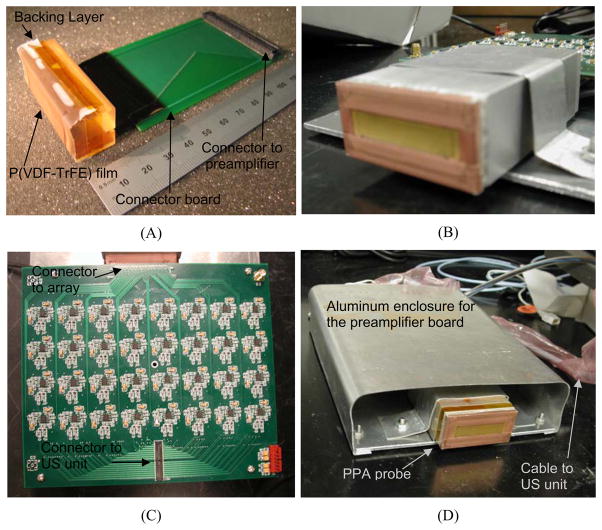
The PPA probe was fabricated using a 100 μm thick sheet of the piezoelectric polymer P(VDF-TrFE) (Ktech, Albuquerque, NM) as the active material and a custom designed flexible circuit and printed circuit board (PCB) connector for interconnect. The fabrication of the PPA was similar to that reported by Carey et al. (Carey, Brox-Nilsen 2009) was chosen for our PPA due to its superior electromechanical coupling coefficient when compared to PVDF(Brown 2000). The flex-circuit composed of 128-element electrodes spaced at a 300-μm pitch was fabricated using traditional wet-etch photolithography with a photomask supplied by Microtonics Inc. (Newtown, PA) and a 25 μm thick piece of polyimide plated with 5 μm thick copper. The P(VDF-TrFE) sheet was bonded to the flex circuit using an unloaded epoxy (Epo-Tek 301, Epoxy Technology Inc., Billerica, MA). An unloaded epoxy (Epo-Tek 301) backing layer was then cast in a rubber mold to create a cylindrically curved substrate for the array elements. After curing, the backing layer was removed from the mold and bonded to the flex circuit directly underneath the P(VDF-TrFE) sheet. The curved array surface ensured an elevation focus of 30 mm. A photo of the array assembly without the aluminum enclosure is shown in Fig. 2(A). A 2500 Å layer of sputtered Gold/Chrome was used to create a common ground plane for the elements with an elevational aperture of 10 mm. Ground electrodes on both ends of the flex-circuit were used to connect this sputtered ground plane to a simple printed circuit board (not shown) used to connect the array to the preamplifier board. The array assembly was housed in an aluminum enclosure for additional RF shielding after soldering the element and ground electrodes on the flex-circuit to the PCB [as shown in Fig. 2(B)]. Finally the array and housing was coated with a 10 μm thick layer of parylene polymer (Parylene C, Specialty Coating Systems, Indianapolis, IN) for insulation.
Fig. 2.
(A) Photograph of the 128-element PPA assembly without the aluminum enclosure. (B) Photograph of the finished PPA in an aluminum enclosure. (C) Photograph of the 128-channel preamplifier board. (D) Photograph of the finished custom probe with the PPA connected directly to the preamplifier board in an aluminum enclosure.
The preamplifier board consisted of 128 independent channels with fixed 20 dB gain and 2-pole LC lowpass filters with cutoff frequency of 10 MHz for noise reduction. In order to decrease the variation of the filter response, all the components (inductors/capacitors) used were in 5% tolerance in values. The Samtec Inc. connector (New Albany, IN) BTS-075-01-F-D-A was used for array connection while the connector LTH-050-01-GDA was used for the system side. Each channel was tested to work at 20 dB gain. The circuits can achieve even higher amplification by replacing the resistors. The preamplifier used in this design is OPA2846 (Texas Instruments, Dallas, TX) which provides two very low-noise, high gain bandwidth, voltage-feedback operational amplifiers in a single package. Each channel provides a 1.2 input voltage noise with a 1.65GHz gain bandwidth product. These decompensated, low-noise and voltage-feedback amplifiers are ideal for broadband transimpedance requirements. With over 200-MHz bandwidth at a gain of 20 dB, excellent gain and phase matching are provided by using this amplifier. The first 64 channels are on the top side of the 6.3 by 7.3 inch PCB board, as shown in Fig. 2(C), while the remaining 64 channels are on the bottom side. In order to decrease the noise and electrical cross talk between channels, dedicated signal and power/ground layers are used in layout. For noise reduction, the preamplifier board connects the 128-element PPA directly without using any cable. The finished custom probe is shown in Fig. 2(D), where both the preamplifier board and the PPA are placed in an enclosure to further restrain the noise. The connection between this custom built probe and the US unit is realized through a probe cable and two Samtec connectors each having a group of 64 channels. A new software database has been developed for this new probe so that the US unit can drive this probe in a receive-only mode at a frame rate of 10 Hz.
RESULTS
Frequency response
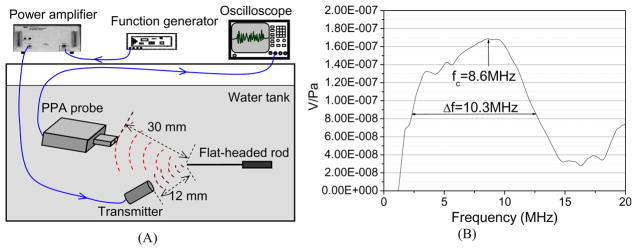
The receiving frequency response of the PPA driven by the preamplifier board was tested by using a calibrated hydrophone (HGL-0400, Onda). One cycle of sine wave at a frequency of 10 MHz was generated with a function generator (3314A, HP) working in a burst mode and amplified with an RF power amplifier (A-300, Electronic Navigation Industries). The transmitter was a broad bandwidth transducer (V312-SM, Panametrics) with a focal length of 12 mm. In order to generate a point acoustic source, a flat-headed rod was placed in the calibration water tank with a distance of 12 mm between the rod head and the transmitter surface, as shown in Fig. 3(A) (Lubbers and Graaff 2006, Preston and Bond 1997). The diameter of the flat-headed rod was 100 μm. The ultrasound wave reflected from the rod head was then measured with the PPA with a distance of 3 cm (i.e. elevational focal length of the probe) between the probe surface and the rod head. The signal detected by each transducer element was then measured directly through an oscilloscope. Without changing the measurement geometry, the PPA probe was replaced with the Onda hydrophone and the ultrasound signal reflected from the rod head was measured again. With the frequency response of the hydrophone calibrated from 1 MHz to 20 MHz, we then calibrated the frequency response of the PPA probe. As shown in Fig. 3(B), this PPA probe driven by the compatible 128-channel preamplifier board has a peak frequency at 8.6 MHz and a wide −6 dB receiving bandwidth from 2.3 MHz to 12.6 MHz (i.e. 120 %).
Fig. 3.
(A) Geometry for the experiment examining the receiving frequency response of the PPA probe. (B) Frequency response of the custom PPA driven by the preamplifier board.
Receiving sensitivity
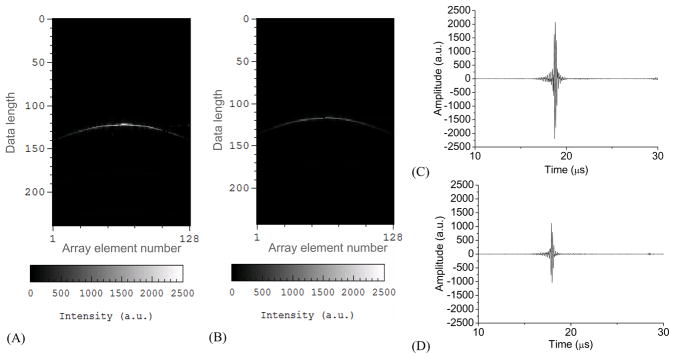
The receiving sensitivity of this PPA probe for detecting photoacoustic signals has been compared with that of a commercial lead zirconate titanate (PZT)-based linear array probe (L10-5, Zonare Medical Systems, Inc). Working with a similar center frequency of 8.4 MHz, the -6 dB bandwidth of the L10-5 is 70 %, less than that of the PPA probe. The L10-5 array has 128 elements and a pitch of 0.3 mm, both the same as those of the PPA probe. The imaged object was a hair fiber with a diameter of 50 μm. Because the orientation of the hair fiber was orthogonal to the transducer array, this hair formed a point-like object in the 2D B-scan image plane when illuminated by a narrow laser beam. The distance between the hair fiber and the probe surface was 30 mm. Fig.4(A) shows the IQ data of received photoacoustic signals from the point object acquired with the PPA probe. As an example, Fig. 4(C) shows the converted RF signal received by a representative center element No. 65. For comparison, the same object was measured with the L10-5 probe with a very similar distance between the object and the probe surface. The 128-channel IQ data and the converted RF signal from the center element No. 65 are shown in Figs. 4(B) and (D), respectively. In comparison with that acquired by the PPA probe, the signal acquired with the L10-5 probe shows an amplitude that is 50 % lower. We have quantified the SNR of the RF signals acquired with these two probes. The SNR achieved with the L10-5 probe is 50% of that with the PPA probe at the same 30-mm depth. As the L10-5 probe is elevationally focused at 15 mm, its receiving sensitivity at 15 mm depth vs. that at 30 mm depth is 114%. After compensating the gain in receiving sensitivity due to the elevational focusing, the SNR of the L10-5 probe is 57% of that with the PPA probe. Using the calibrated Onda hydrophone and the Panametrics transducer as the transmitter (as described in the above for the validation of receiving frequency response of the PPA probe), we have also quantified the noise equivalent pressure of the PPA probe driven by the preamplifier board which is 110 Pa at the peak frequency of 8.6 MHz.
Fig. 4.
128-channel IQ data of photoacoustic signal from a point object detected by (A) the PPA probe and (B) the commercial L10-5 probe. (C) and (D) RF signals from element No. 65 converted from the IQ data in (A) and (B), respectively.
Spatial resolution
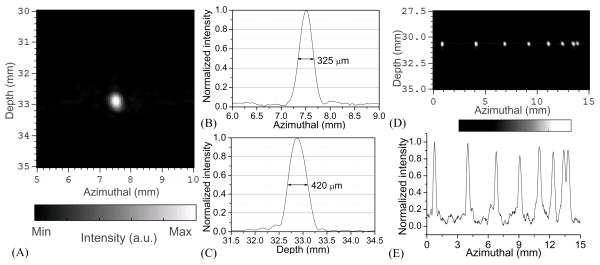
Using the standard ultrasound dynamic receive focusing (i.e. delay-and-sum) algorithm, 2D B-scan imaging of a point object was conducted for the evaluation of the system spatial resolution. As described above, the point object was a 50μm diameter hair fiber illuminated with a narrow laser beam. Each 2D image was reconstructed using the signals from the full 128 elements without apodization. As shown in Fig. 5, by studying the image intensities along lines through the center of the point object, the axial and lateral (azimulthal) resolution achieved by this system were quantified as 420 μm and 325 μm respectively at the depth of 32.8 mm. The lateral resolution of this PAI system was also examined by imaging a group of parallel lines printed on a piece of transparency. With the B-scan imaging plane perpendicular to the orientation of the lines, this group of lines formed a set of point objects in the 2D imaging plane. The distance between the transparency and the surface of the probe was 30.5 mm, close to the elevational focal length of the probe. 2D cross-sectional image of the line pattern is shown in Fig. 5(D), where the distances between adjacent objects are 3.5, 3.0, 2.5, 2.0, 1.5, 1.0 and 0.5 mm respectively from the left to the right side of the image. In Fig. 5(D) as well as Fig. 5(E) that shows the intensity profile along the dash line in the image in Fig. 5(D), all objects can be discerned clearly. Considering that the distance between the two objects at the right end of the image was 0.5 mm, and the width of each line object was 0.134 mm, the smallest gap between the lines was 0.366 mm, which indicates that the lateral resolution of this system was beyond 0.366 mm.
Fig. 5.
(A) Reconstructed photoacoustic image of a point object acquired with the PPA probe. (B) System lateral response profile. (C) System axial response profile. (D) 2D cross-sectional photoacoustic image of a group of parallel lines printed on a piece of transparency. (E) Intensity profiles along the dash line in (D).
Imaging continuity
For a preliminary examination of the imaging continuity of this system in 2D mapping of vasculature, a phantom made from porcine gel with embedded hair fibers was imaged. As shown in the sample photograph in Fig. 6(A), two hair fibers (50 μm diameter) in the same 2D plane were embedded in the porcine gel. Illuminated by laser light at 532-nm wavelength with incident light fluence of 10 mJ/cm2 (below the ANSI safety limit), a 2D B-scan image of the sample through the plane containing the hair fibers was taken using the PPA probe. The distance between the two hair fibers and the surface of the probe was 25–32 mm. B-scan image was reconstructed using the signals from the full 128 elements without apodization. As shown in the PAI image in Fig. 6(B), the hair fibers are presented with satisfactory continuity and a good matching with the photograph of the sample.
Fig. 6.
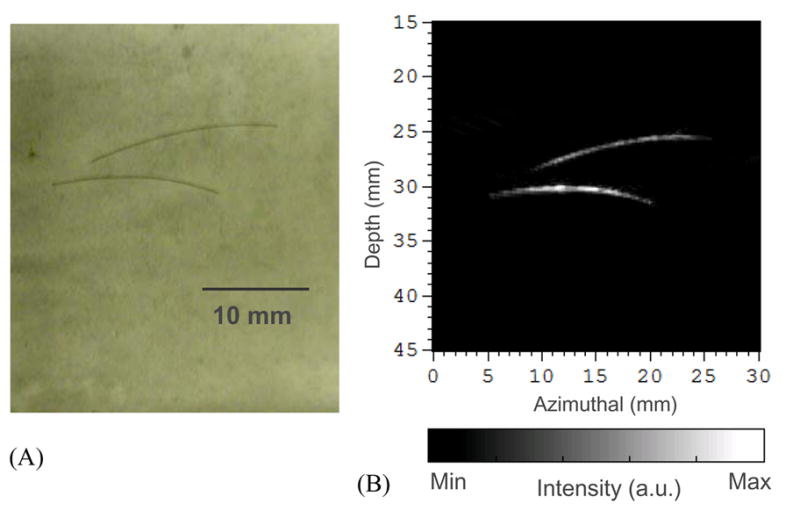
(A) Photograph of two hair fibers embedded in a gel phantom. (B) 2D PAI B-scan image of the two hair fibers acquired with the PPA probe.
Imaging of rabbit ear
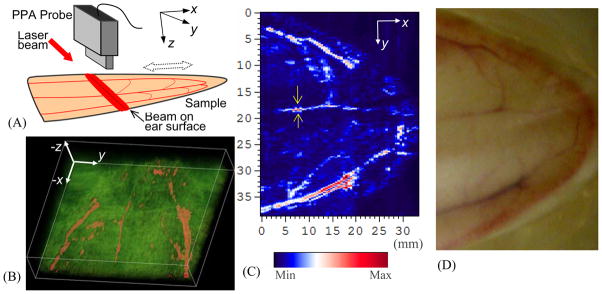
To explore the feasibility of the PAI system in imaging vascular tree in biological samples, experiment was performed on rabbit ears. The laboratory animal protocol for this work was approved by the UCUCA of the University of Michigan. Whole ears were harvested immediately after the rabbits (New Zealand bunny; ~5 kg body weight) were euthanized. To keep as much blood as possible in the ear vessels, an electrocautery device (SurgiStat, Valleylab) was then used to clot blood and seal vessels. The hair on the ear was removed using hair remover lotion before imaging; and then the ear was placed on a block of porcine gel. For acoustic coupling, the sample and the head of the PPA probe were immersed in a tank of water. As shown in Fig. 7(A), the rabbit ear was placed in the X–Y plane; while the probe head faced down during signal acquisition (i.e. along Z-axis) with a distance about 30 mm from the sample surface. The laser beam illuminated on the ear surface formed a strip covering the imaging area. The incident light fluence on the tissue was about 15 mJ/cm2, below the ANSI safety limit at 532-nm wavelength. Each 2D B-scan image in the Y–Z plane perpendicular to the ear surface was acquired quickly without need to relocate the probe. To acquire 3D data, the sample was moved along the X-axis through a stepper motor while the probe and the laser beam were kept static. With a constant step size of 0.5 mm, the raster scan along the X-axis covered a total distance of 33 mm. Therefore, in total 66 2D B-scan images were taken. Although the section of the harvested ear sample was cauterized to keep the blood in the vessels, there was still major blood loss before images were taken. Therefore, in order to achieve sufficient SNR especially in imaging small vessels, each 2D image was averaged over 90 laser pulses, which took 9 seconds. However, signal acquisition with less averaging should work in future imaging on live animals when there is no blood loss from the sample. Due to the limited volume of the CINE buffer of the US unit, the IQ data of each 2D image had to be downloaded to the PC before the next image could be acquired. Therefore, currently the raster scan over 66 planes for 3D imaging of the rabbit ear took a relatively long time of over 0.5 hour.
Fig. 7.
(A) Geometry for 3D PAI of the vascular tree in a rabbit ear. (B) 3D image of the ear vasculature. (C) 2D maximum projection image of the ear vasculature. (D) Photograph of the sample.
3D image and 2D maximum projection image in the X–Y plane are shown in Fig. 7(B) and (C) respectively for comparison with the sample photograph in Fig. 7(D). Most main vascular branches that can be recognized in the photograph of the sample have been presented successfully in the PAI images. We can notice some discontinuity in PAI images in presenting blood vessels, especially when the imaged area was close to the tip of the ear. The main reason is the loss of blood in some vessels, although effort had been made to keep the blood in the sample. We have also evaluated the spatial resolution of this system in imaging vascular trees in biological tissues. When a vessel can be regarded as a line object in an image, the full width at half maximum (FWHM) of the intensity profile across this vessel gives the estimated lateral resolution. The FWHM of the vessel pointed by a pair of arrows in Fig. 7(C) is 0.4 mm, which suggests that this imaging system can achieve a spatial resolution better than 0.4 mm when imaging vasculatures in biological tissues.
DISCUSSION AND SUMMARY
The feasibility of achieving PAI imaging by using a custom probe driven by a commercial US unit has been investigated. The goal of this new imaging strategy is taking advantages of the state-of-the-art ultrasonography technology while overcoming the limitations of commercial US machines including limited receiving bandwidth and sensitivity. To achieve this goal, a specially designed 128-element receive-only PPA and a compatible 128-channel preamplifier board were fabricated and used to replace the commercial PZT probes for photoacoustic signal acquisition. The uniquely broad receiving bandwidth of the PPA is essential for high quality tomographic PAI. By employing the preamplifier board that connects the array directly without using cable and enables elevated digitized SNR not only by impedance matching but also by amplifying signals, the imaging system working with the PPA has presented better receiving sensitivity in comparison with that using a state-of-the-art commercial PZT-based probe. Through the studies on phantoms and rabbit ears, the good performance of this imaging system has been approved.
One of the limitations of the PPA is its limited transmit efficiency. As a result, the system built in this work cannot achieve US imaging at the same time when working with the custom PPA probe. In order to achieve dual-modality US and PAI imaging without the need to change the probe, new design of transducer probe as well as further modification of the signal acquisition of the US unit is required. Single-crystal piezoelectric-based arrays with uniquely high two-way sensitivity (Lau, Li 2009, Sun, Zhou 2009) and capacitive micromachined ultrasound transducer (cMUT) arrays with tremendous fabrication flexibility (Ladabaum, Jin 1998, Oralkan, Ergun 2002, Vaithilingam, Ma 2009), both with intrinsically broad bandwidth, are good candidates. Moreover, the PAI system developed in this work, although facilitating real-time image acquisition, cannot achieve high speed image reconstruction and display. With the current system, the signal processing, image reconstruction and display are all realized off-line on an external PC after the IQ data is downloaded from the CINE buffer of the US unit. In the future, through extended collaboration with the manufacture of the US system, we will further modify this imaging system to improve its performance on the PAI mode. After the software shall be modified to support receive beamforming for one-way imaging, real-time PAI can be achieved solely by the US unit without involving an external PC.
Acknowledgments
This work was supported in part by the National Institute of Health (NIH) under grant numbers R01 AR055179, and Department of Defense grant number W81XWH-07-1-0231. We thank Larry Mo, Derek DeBusschere and Glen Mclaughlin from Zonare Medical Systems, Inc. for their contribution to the development of the imaging system, and Jay Williams at the University of Southern California for fabricating the array. We also thank Justin Rajian and Zhixing Xie for their help in the experiments.
Footnotes
Publisher's Disclaimer: This is a PDF file of an unedited manuscript that has been accepted for publication. As a service to our customers we are providing this early version of the manuscript. The manuscript will undergo copyediting, typesetting, and review of the resulting proof before it is published in its final citable form. Please note that during the production process errors may be discovered which could affect the content, and all legal disclaimers that apply to the journal pertain.
References
- Brown LF. Design considerations for piezoelectric polymer ultrasound transducers. IEEE Trans Ultrason Ferroelectr Freq Control. 2000;47:1377–96. doi: 10.1109/58.883527. [DOI] [PubMed] [Google Scholar]
- Carey SJ, Brox-Nilsen C, Lewis HM, Gregory CM, Hatfield JV. Scanning head with 128-element 20-MHz PVDF linear array transducer. IEEE Trans Ultrason Ferroelectr Freq Control. 2009;56:1769–77. doi: 10.1109/TUFFC.2009.1242. [DOI] [PubMed] [Google Scholar]
- Ermilov SA, Conjusteau A, Mehta K, Lacewell R, Henrichs PM, Oraevsky AA. 128-channel laser optoacoustic imaging system (LOIS-128) for breast cancer diagnostics - art. no. 608609. In: Oraevsky AA, Wang LV, editors. Photons Plus Ultrasound: Imaging and Sensing 2006. 2006. pp. 8609–09. [Google Scholar]
- Ermilov SA, Khamapirad T, Conjusteau A, Leonard MH, Lacewell R, Mehta K, Miller T, Oraevsky AA. Laser optoacoustic imaging system for detection of breast cancer. Journal of Biomedical Optics. 2009:14. doi: 10.1117/1.3086616. [DOI] [PubMed] [Google Scholar]
- Erpelding TN, Kim C, Pramanik M, Jankovic L, Maslov K, Guo ZJ, Margenthaler JA, Pashley MD, Wang LHV. Sentinel Lymph Nodes in the Rat: Noninvasive Photoacoustic and US Imaging with a Clinical US System. Radiology. 2010;256:102–10. doi: 10.1148/radiol.10091772. [DOI] [PMC free article] [PubMed] [Google Scholar]
- Karabutov AA, Savateeva EV, Oraevsky AA. Optoacoustic tomography: New modality of laser diagnostic systems. Laser Physics. 2003;13:711–23. [Google Scholar]
- Kolkman RGM, Brands PJ, Steenbergen W, van Leeuwen TG. Real-time in vivo photoacoustic and ultrasound imaging. Journal of Biomedical Optics. 2008:13. doi: 10.1117/1.3005421. [DOI] [PubMed] [Google Scholar]
- Kozhushko V, Khokhlova T, Zharinov A, Pelivanov I, Solomatin V, Karabutov A. Focused array transducer for two-dimensional optoacoustic tomography. J Acoust Soc Am. 2004;116:1498–506. doi: 10.1121/1.1781710. [DOI] [PubMed] [Google Scholar]
- Kruger RA, Kiser WL, Reinecke DR, Kruger GA, Miller KD. Thermoacoustic molecular imaging of small animals. Mol Imaging. 2003;2:113–23. doi: 10.1162/15353500200303109. [DOI] [PubMed] [Google Scholar]
- Ladabaum I, Jin X, Soh HT, Atalar A, Khuri-Yakub BT. Surface micromachined capacitive ultrasonic transducers. IEEE Trans Ultrason Ferroelectr Freq Control. 1998;45:678–90. doi: 10.1109/58.677612. [DOI] [PubMed] [Google Scholar]
- Lau ST, Li H, Wong KS, Zhou QF, Zhou D, Li YC, Luo HS, Shung KK, Dai JY. Multiple matching scheme for broadband 0.72Pb(Mg(13)Nb(23))O(3)-0.28PbTiO(3) single crystal phased-array transducer. J Appl Phys. 2009;105:94908. doi: 10.1063/1.3065476. [DOI] [PMC free article] [PubMed] [Google Scholar]
- Li CH, Aguirre A, Gamelin J, Maurudis A, Zhu Q, Wang LV. Real-time photoacoustic tomography of cortical hemodynamics in small animals. Journal of Biomedical Optics. 2010:15. doi: 10.1117/1.3302807. [DOI] [PMC free article] [PubMed] [Google Scholar]
- Lubbers J, Graaff R. Flat ended steel wires, backscattering targets for calibrating over a large dynamic range. Ultrasound Med Biol. 2006;32:1585–99. doi: 10.1016/j.ultrasmedbio.2006.05.026. [DOI] [PubMed] [Google Scholar]
- Manohar S, Kharine A, van Hespen JC, Steenbergen W, van Leeuwen TG. The Twente Photoacoustic Mammoscope: system overview and performance. Phys Med Biol. 2005;50:2543–57. doi: 10.1088/0031-9155/50/11/007. [DOI] [PubMed] [Google Scholar]
- Oralkan O, Ergun AS, Johnson JA, Karaman M, Demirci U, Kaviani K, Lee TH, Khuri-Yakub BT. Capacitive micromachined ultrasonic transducers: next-generation arrays for acoustic imaging? IEEE Trans Ultrason Ferroelectr Freq Control. 2002;49:1596–610. doi: 10.1109/tuffc.2002.1049742. [DOI] [PubMed] [Google Scholar]
- Preston RC, Bond AD. An experimental study of the reflection from spherical and flat ended cylindrical targets suitable for fetal Doppler performance assessment. Ultrasound Med Biol. 1997;23:117–28. doi: 10.1016/s0301-5629(96)00168-8. [DOI] [PubMed] [Google Scholar]
- Song LA, Maslov K, Shung KK, Wang LHV. Ultrasound-array-based real-time photoacoustic microscopy of human pulsatile dynamics in vivo. Journal of Biomedical Optics. 2010:15. doi: 10.1117/1.3333545. [DOI] [PMC free article] [PubMed] [Google Scholar]
- Sun P, Zhou Q, Zhu B, Wu D, Hu C, Cannata JM, Tian J, Han P, Wang G, Shung KK. Design and fabrication of PIN-PMN-PT single-crystal high-frequency ultrasound transducers. IEEE Trans Ultrason Ferroelectr Freq Control. 2009;56:2760–3. doi: 10.1109/TUFFC.2009.1367. [DOI] [PMC free article] [PubMed] [Google Scholar]
- Vaithilingam S, Ma TJ, Furukawa Y, Wygant IO, Zhuang XF, De la Zerda A, Oralkan O, Kamaya A, Gambhir SS, Jeffrey RB, Khuri-Yakub BT. Three-Dimensional Photoacoustic Imaging Using a Two-Dimensional CMUT Array. Ieee Transactions on Ultrasonics Ferroelectrics and Frequency Control. 2009;56:2411–19. doi: 10.1109/TUFFc.2009.1329. [DOI] [PubMed] [Google Scholar]
- Wang X, Chamberland DL, Jamadar DA. Noninvasive photoacoustic tomography of human peripheral joints toward diagnosis of inflammatory arthritis. Opt Lett. 2007;32:3002–4. doi: 10.1364/ol.32.003002. [DOI] [PubMed] [Google Scholar]
- Wang X, Fowkes JB, Carson PL, Mo L Ieee. Experimental Evaluation of a High-Speed Photoacoustic Tomography System based on a Commercial Ultrasound Unit. Ieee Ultrasonics Symposium; 2008; 2008. pp. 1234–37. Appendix. [Google Scholar]
- Wang X, Pang Y, Ku G, Xie X, Stoica G, Wang LV. Noninvasive laser-induced photoacoustic tomography for structural and functional in vivo imaging of the brain. Nat Biotechnol. 2003;21:803–6. doi: 10.1038/nbt839. [DOI] [PubMed] [Google Scholar]
- Xiao JY, Yao L, Sun Y, Sobel ES, He JS, Jiang HB. Quantitative two-dimensional photoacoustic tomography of osteoarthritis in the finger joints. Optics Express. 2010;18:14359–65. doi: 10.1364/OE.18.014359. [DOI] [PubMed] [Google Scholar]
- Xu M, Wang LV. Analytic explanation of spatial resolution related to bandwidth and detector aperture size in thermoacoustic or photoacoustic reconstruction. Phys Rev E Stat Nonlin Soft Matter Phys. 2003;67:056605. doi: 10.1103/PhysRevE.67.056605. [DOI] [PubMed] [Google Scholar]
- Yang XM, Maurudis A, Gamelin J, Aguirre A, Zhu Q, Wang LV. Photoacoustic tomography of small animal brain with a curved array transducer. Journal of Biomedical Optics. 2009:14. doi: 10.1117/1.3227035. [DOI] [PMC free article] [PubMed] [Google Scholar]
- Yaseen MA, Ermilov SA, Brecht HP, Su R, Conjusteau A, Fronheiser M, Bell BA, Motamedi M, Oraevsky AA. Optoacoustic imaging of the prostate: development toward image-guided biopsy. Journal of Biomedical Optics. 2010:15. doi: 10.1117/1.3333548. [DOI] [PMC free article] [PubMed] [Google Scholar]


