

Abstract
Objectives
To assess the validity of the Work Productivity and Activity Impairment questionnaire as adapted for caregiving (WPAI:CG) to measure productivity loss (hours missed from work, impairment while at work, and impairment in regular activities) due to unpaid caregiving for medically complex older adults.
Methods
The WPAI:CG was administered along with the Caregiver Strain Index (CSI) and Center for Epidemiologic Studies Depression Scale (CESD) to a caregiving population (N = 308) enrolled with their older, medically complex care-recipient in a cluster-randomized controlled study. Correlation coefficients were calculated between each productivity variable derived from the WPAI:CG and CSI/CESD scores. Nonparametric tests for trend across ordered groups were carried out to examine the relationship between each productivity variable and the intensity of the caregiving.
Results
Significant positive correlations were found between work productivity loss and caregiving-related strain (r = 0.45) and depression (r = 0.30). Measures of productivity loss were also highly associated with caregiving intensity (P < 0.05) and care-recipient medical care use (P < 0.05). The average employed caregiver reported 1.5 hours absence from work in the previous week and 18.5% reduced productivity while at work due to caregiving. Employed and nonemployed caregivers reported 27.2% reduced productivity in regular activities in the previous week.
Conclusion
The results indicate high convergent validity of the WPAI:CG questionnaire. This measure could facilitate research on the cost-effectiveness of caregiver-workplace interventions and provide employers and policy experts with a more accurate and comprehensive estimate of caregiving-related costs incurred by employers and society.
Keywords: absenteeism, activities of daily living, caregiving, productivity, quality of life, validity
Introduction
It is estimated that 61% [1] to 70% [2] of frail or chronically disabled older adults rely on a friend or family member for assistance with everyday tasks. Although productivity loss associated with chronic illness to employers and society has been estimated in the billions of dollars [3], very few studies have examined caregiving-related productivity loss. Engaging in a caregiver role can impact work through several pathways: 1) exit from the workforce; 2) missed work time (absenteeism); and 3) decreased productivity while at work (presenteeism) [4,5].
International research indicates that individuals engaged heavily in caregiving are more likely to have left a job or retired early than matched noncaregivers [6]. Evidence indicates that minorities [7], low-income caregivers [8–10], and women [11–14] are more likely to leave the workforce because of their caregiving role. Similarly, caregivers who remain in the work-force are more likely to miss work time than noncaregiver employees [6,15], with lower income, minority and female caregivers being most likely to miss time from work [16]. The impact of caregiving on work productivity increases as the intensity of caregiving increases; for example, assisting with greater number of tasks, caring for an individual with cognitive limitations, or providing more hours of caregiving [6,7,17]. The actual lost work time, or absenteeism (due to caregiving), is difficult to quantify, but has been estimated at 8 to 12 days a year [18,19].
In addition to absenteeism, caregiving may impede productivity while at work through negative health effects of caregiving (depression, injury, anxiety) [20–23], decreased ability to concentrate on work activities [17,24], or conflict with supervisors [9,25]. To our knowledge, the only peer-reviewed study to examine caregiving-related presenteeism relied on data from an eight-item work limitations questionnaire (WLQ) fielded to employees of a large financial company [20]. In the study, 10.6% of respondents reported missing an average of 7.7 hours from work in the previous 2-week period to care for an ill dependent, either a child or adult, with any temporary or chronic health condition. Increased time spent caregiving was associated with increased self-reported impairment in mental, interpersonal, and time management work tasks (using a five-point Likert scale). Although informative and consistent with other studies, inferences from this study are impeded by poor generalizability, given the sampling frame of a single company, a low response rate (23%), and a sample restricted to broadly defined caregivers who self-identified as missing work in the past 2 weeks. Furthermore, the WLQ did not assess the direct impact of caregiving on work productivity. Respondents were asked about work limitations due to physical health or emotional problems, making it impossible to differentiate the effect of caregiving from other health or emotional problems.
MetLife and the National Alliance for Caregiving (NAC) have also conducted a series of studies on the effect of caregiving on work productivity and the cost to employers. A 2004 MetLife study estimated that for the most intense caregivers (measured using the NAC caregiver intensity scale [26]), 1 hour of work time was lost each week due to caregiving-related work interruptions. Although conservative, the estimate was derived by the investigators from 55 in-depth interviews with working caregivers who reported having missed work time to provide care for a dependent, and therefore suffers from an absence of precision regarding productivity loss [27].
This article advances our understanding of caregiving-related productivity loss by using an instrument that measures the impact of caregiving on absenteeism and presenteeism, as well as lost productivity while engaged in regular activities outside the workplace among a well-defined sample of caregivers to chronically ill older adults. The Work Productivity and Activity Impairment (WPAI) questionnaire has been validated in patients with specific health problems, including panic disorder [28], allergic rhinitis [29], chronic hand dermatitis [30,31], asthma [32,33], gastroesophageal reflux disease [34,35], and irritable bowel disease [36,37]. The questionnaire has been used to study the effect of a care-recipient’s mood and mental state on a caregiver’s work and regular activity productivity among a convenience sample of Alzheimer’s patients and their partners. The present study builds on this work by measuring the impact of caregiving for a broader population of older adults with a mixture of chronic conditions [38]. The original WPAI was modified for this study into an interviewer-administered questionnaire designed to measure lost productivity due to caregiving. To our knowledge, this is the first questionnaire developed to specifically measure the caregivers’ assessment of the impact of caring for a chronically ill older adult on work and regular activity productivity. The primary objectives of this study were to validate the WPAI questionnaire for caregivers, and to examine to what extent caregivers experience absence from work, reduced productivity while at work, and reduced productivity while engaged in regular activities such as work around the house, shopping, childcare, exercising, and studying due to caregiving-related responsibilities.
Methods
Study Population
Data for this study were obtained from a cross-sectional baseline survey of caregivers to patients enrolled in the “Guided Care” (GC) randomized trial (see Boyd 2007 [39], Boult 2008 [40], and Wolff, forthcoming [41] for more detailed descriptions of study). This cluster-randomized controlled trial enrolled 904 older patients and their primary caregivers (N = 308) from 14 primary care teams in the Baltimore, MD and Washington, DC area. Patients were eligible for the study if they had been seen by a participating physician within the previous year and were identified as being among the 25% of the older Medicare population at the highest risk of heavy utilization of health care during the following year. Risk of heavy utilization was computed from the study participant’s previous year’s health insurance claims, using the Center for Medicare and Medicaid Services’ hierarchical condition categories (HCC) predictive model [42].
Each patient who reported receiving health-related assistance was asked to identify the person (family or unpaid friend) who assisted them the most with activities of daily living (ADLs), instrumental activities of daily living (IADLs), or health-care tasks. Caregivers were then contacted, and upon completing informed consent, were administered an in-person interview by a professional survey research firm. The survey asked the caregivers questions about the care they provided for the patient, and were instructed that the term “caregiving” in the context of the survey referred to the care they provided to the patient. The response rate among eligible caregivers was 86%.
WPAI
The WPAI includes questions about employment: time lost from work, reduced productivity at work and reduced productivity while engaged in regular activities in the previous week. This instrument has been validated for use with general health problems including headache, pain, arthritis, and allergies [43]. The format of the questionnaire lends itself to assessing the impact of any chronic situation or symptom on work productivity, and was modified for this study to reflect caregiving-related productivity loss. The modified six-item instrument (WPAI:CG) was administered during a 30-minute in-person interview with caregivers that was conducted at baseline. Caregivers were asked if they were currently employed for pay. Caregivers who indicated that they were employed for pay were asked four questions about the impact of caregiving on their productivity in the previous week. Both employed and nonemployed caregivers were asked about productivity in regular daily activities outside of employment. The WPAI:CG quantifies lost productivity by combining the amount of time missed from work with the amount of reduced productivity while at work. Questions delineate lost time and productivity due to caregiving responsibilities and lost time/productivity for other reasons in the past 7 days, as follows.
absenteeism is measured as a percentage equal to [hours missed from work due to caregiving/(hours. missed due to caregiving + hours actually worked)] * 100;
presenteeism is defined as the degree to which caregiving affected productivity while at work [(measured as a number on a scale from 1–10)/10] * 100;
productivity loss is measured as a percentage equal to [absenteeism + (% of time worked * presenteeism)] * 100;
regular activity productivity loss is defined as the degree to which caregiving affected productivity while doing regular daily activities [(measured as a number on a scale from 1–10)/10] * 100.
Caregiver Strain and Depression
In addition to sociodemographic attributes, the baseline caregiver interview included the validated, modified Caregiver Strain Index (CSI) [44,45] and Center for Epidemiological Studies Depression Scale (CESD) [46]. The CSI is a 13-item index originally developed to screen for caregiver strain after hospital discharge of an elderly family member that has been used in caregiver studies across a wide range of populations. The modified CSI has been adapted to allow for greater sensitivity to caregiver strain. The modified CSI score ranges from 0 to 26, with higher scores indicating higher strain. The CESD is a 20-item depression scale widely used to self-report the presence and persistence of depressive symptoms. Each item asks about the frequency of depressive symptoms during the past week. The CESD score ranges from 0 to 60, with higher scores indicating more depression. A score of 16 or above is considered to be evidence of clinically significant depression.
Caregiving Intensity Measures
To assess the intensity of the care-recipient’s disability and caregiver’s level of assistance, questions were fielded regarding assistance provided for five ADLs: bathing, eating, toileting, transferring, and dressing [47]. A higher number of ADL tasks assisted with indicates a more heavy-duty caregiving responsibility. The HCC predictive model is based on diagnoses reported on health insurance claims. This model was used to rank potential GC patients with regard to their risk for using health services heavily during the coming year; placement in the upper quartile of risk was necessary to participate in the GC study [42]. For the purpose of this analysis, HCC ranking, a case mix measure, is used as a proxy for care-recipient medical complexity, and is indicative of potential challenges of assisting with coordination of care given that a higher score indicates greater risk of health-care utilization.
Time Spent Caregiving
Hours spent caregiving in a typical week was ascertained by asking the caregiver, “On average, how many hours do you spend helping [PATIENT] in a typical week?” The measure of hours spent care giving reflects both the amount of time spent on caregiving and the amount of time available to spend on caregiving, and therefore may not accurately reflect the intensity of the caregiving situation, given variability among caregivers in discretionary time (e.g., employment).
Analysis
Employed and unemployed caregivers in the sample were compared at baseline on sociodemographic and caregiving situation variables (see Table 1). Statistical significance was ascertained using Fisher’s exact test for categorical variables and the unpaired Student’s t test for continuous variables. Overall productivity loss across the entire working caregiver sample was calculated using the formulas described above.
Table 1.
Baseline caregiver (CG) characteristics by employment status
| Employed (n = 125) percentage/Mean (SD) | Nonemployed (n = 183) percentage/Mean (SD) | Total (n = 308) percentage/Mean (SD) | |
|---|---|---|---|
| Age† | 53.4 (12.0) | 67.5 (14.1) | 61.8 (15.1) |
| Female | 71.2% | 71.6% | 71.4% |
| Married† | 56.8% | 71.6% | 68.5% |
| Adult child CG† | 70.4% | 26.8% | 44.5% |
| Spousal CG† | 16.8% | 66.0% | 46.1% |
| At least one child lives in CG household† | 27.2% | 11.5% | 17.9% |
| CG receives additional help from family and friends* | 57.6% | 42.1% | 48.4% |
| CG receives additional paid help | 8.8% | 7.7% | 8.1% |
| CG has at least a high school education† | 97.6% | 78.1% | 86.0% |
| CG reports not enough money to make ends meet | 9.6% | 12.0% | 11.0% |
| CG helps patient daily† | 44.8% | 72.7% | 61.4% |
| Average hours of assistance per week† | 16.6 (18.6) | 30.0 (30.0) | 24.7 (26.8) |
| Avg. number of ADL tasks CG assists with | 0.9 (1.5) | 1.1 (1.5) | 1.0 (1.5) |
| Avg. number of IADL tasks CG assists with | 2.8 (1.9) | 3.0 (2.1) | 2.9 (2) |
| Care-Recipient HCC score | 2.15 (1.32) | 2.41 (1.28) | 2.31 (2.16) |
| Baseline CG Depression (CESD) | 6.3 (6.8) | 7.5 (7) | 7.1 (6.9) |
| Baseline CG Strain (CSI) | 7.5 (5.7) | 7.1 (6.0) | 7.3 (5.9) |
P < 0.01;
P < 0.001.
ADL, activities of daily living; CESD, Center for Epidemiological Studies Depression Index; CSI, Caregiver Strain Index; HCC, hierarchical condition category; IADL, instrumental activities of daily living; SD, standard deviation.
We assessed the construct validity of the WPAI: CG to measure the impact of caregiving on work productivity by providing evidence of convergent and known-group validity. Evidence of convergent validity is provided by significant and strong correlations between the new measure being developed and existing measures [48]. Previous validation studies of the WPAI have shown productivity loss to be correlated with health problem severity and quality of life [30,32,35,37,43,49]. Therefore, we hypothesized that the WPAI:CG would be highly correlated with: 1) intensity of care giving (measured by number of ADL tasks for which the caregiver provides assistance); 2) time spent care giving (measured by hours of care provided in a typical week); 3) degree of patient medical complexity (measured by level of HCC score); 4) caregiver depression (CESD); and 5) strain (CSI). Because of the ordinal scale used in the WPAI, nonparametric tests of association were used. The strength of associations between continuous variables (CESD/CSI/hours of care) and productivity was measured using Spearman rank correlations. Significance of the correlation coefficient was determined by using Student’s t tests. Cuzick’s nonparametric test for trend was used to compare productivity loss across ordered groups (ADL tasks/HCC level). We hypothesized that these correlations and trends would also be present for general activity impairment.
Evidence of “known-group validity” is provided by significant differences in mean scores across independent samples predicted to score high and low on a trait [48]. Previous research indicates that caregivers who coreside with the person for whom they care are more likely to be impacted by caregiving at work [7], that female caregivers are more likely to be impacted than male caregivers [11,12,14], and that low-income caregivers are more likely to be impacted than high-income caregivers [8,10]. We used Wilcoxon rank-sum tests to test for differences in productivity loss across these groups.
Results
Three hundred eight caregivers of medically complex older adults were recruited and interviewed between February 2006 and June 2006 by a professional survey company.
Caregiver Characteristics: Employed and Nonemployed
The caregiver study sample is described by employment status in Table 1. Slightly less than half of these caregivers were employed (41%) either part-time or full-time in the previous 7 days. Employed caregivers were on average younger, more educated, more likely to have young children in the household, and on average spent less time engaged in caregiving tasks than nonemployed caregivers. Observed differences were at least partially explained by the fact that the majority of the employed caregiver samples (70%) were adult children of care-recipients, while the majority of the nonemployed caregiver sample was spouses (66%). However, the care-recipients of the employed caregivers did not differ significantly from the care-recipients of the non-employed caregivers in disability (0.9 ADL limitations for recipients of employed caregivers; 1.1 ADL limitations for recipients of nonemployed caregivers), or in risk of heavy utilization of health care (HCC scores of 2.15 for recipients of employed caregivers; 2.41 for recipients of nonemployed caregivers). Thus, despite caring for a similarly disabled care-recipient population, employed caregivers provided fewer hours of help and were more likely to receive additional help from family and friends than nonemployed caregivers, but were not more likely to engage paid help than nonemployed caregivers.
Construct Validity of WPAI:CG
To assess the construct validity of the WPAI:CG to measure the impact of caregiving on work and regular activity productivity, we examined evidence of convergent validity between the WPAI:CG (work loss and regular activity loss) and existing measures of 1) caregiver depression; 2) caregiver strain; 3) number of assisted ADL tasks; 4) hours spent caregiving; and 5) HCC score (see Table 2). Using Spearman rank correlation, both work productivity loss and regular activity productivity loss were positively correlated with depression, strain, and hours spent caregiving. Student’s t tests of the null hypothesis that productivity loss is independent from depression, strain, or hours spent caregiving were significant (P < 0.001) for all six correlation coefficients. Cuzick’s nonparametric test for trends was used to compare productivity loss across HCC quartile and number of assisted ADL tasks. We found that there was a significant upward trend in productivity loss as HCC quartile increased, and likewise, as the number of ADL tasks assisted with increased. Figure 1 illustrates that caregivers with the greatest impairment in work and regular activity productivity assisted care-recipients with the highest risk of future utilization of health care.
Table 2.
Association between WPAI-CG and measures of caregiving intensity and health-related quality of life measures
| Work productivity loss (n = 123) | Regular activity productivity loss (n = 308) | |
|---|---|---|
| Caregiver strain (CSI score) | r = 0.45 (P < 0.001) | r = 0.55 (P < 0.001) |
| Depression (CESD score) | r = 0.30 (P < 0.001) | r = 0.31 (P < 0.001) |
| Number of hours spent caregiving in typical week | r = 0.32 (P < 0.001) | r = 0.39 (P < 0.001) |
| Number of ADL tasks | z = 2.18 (P = 0.029) | z = 5.61 (P < 0.001) |
| HCC quartile | z = 2.21 (P = 0.027) | z = 2.39 (P = 0.017) |
r = Spearman rank correlation rho (P-value).
z = Cuzick’s nonparametric test for trend (P-value).
ADL, activities of daily living; CESD, Center for Epidemiological Studies Depression Index; CSI, Caregiver Strain Index; HCC, hierarchical condition category.
Figure 1.
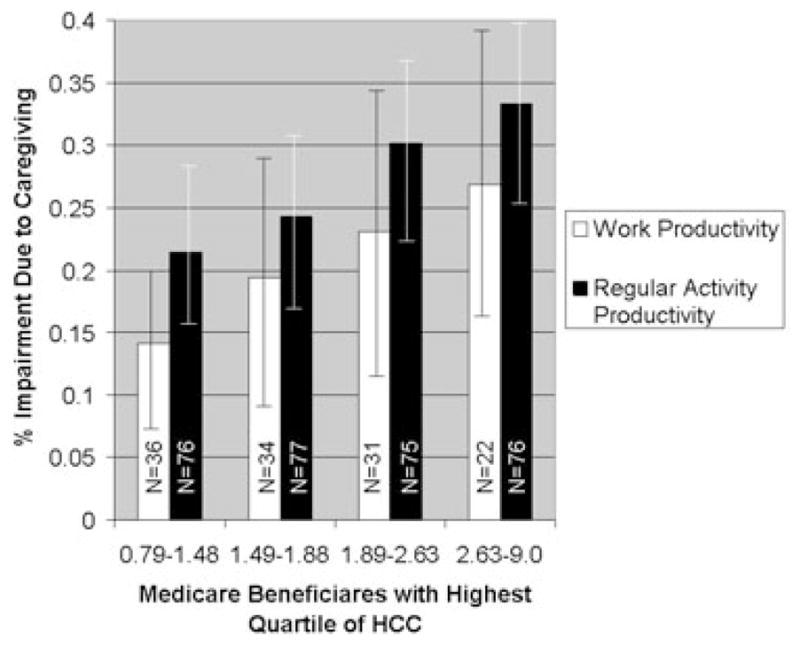
Care-recipient’s hierarchical condition categories (HCC) score was strongly associated with caregiver work productivity loss (P < 0.05) and regular activity productivity loss (P < 0.01). This figure illustrates the dose-response relationship between HCC and productivity loss. Caregivers to the most medically complex recipients (as measured by HCC score) were less than 75% productive at work and in their regular activities. Caregiver impairment and 95% confidence interval versus risk of heavy utilization based on hierarchical condition category score in quartiles.
To further assess the construct validity of the WPAI:CG, we examined evidence of known-group validity across the sample (see Table 3). Previous research indicates coresiding caregivers have more impairment at work and in regular activities than caregivers who do not live with the person they care for [7]. Our findings were consistent in showing coresiding caregivers to have greater work productivity loss than non–coresiding caregivers (25.2 vs. 15.0; P < 0.01). Coresidence was associated with a higher likelihood of missing work (32% of coresiding caregiver vs. 18% of non–coresiding caregiver; P < 0.05), but non–coresiding caregivers who missed any work time missed more overall work time (8 hours for non–coresiding caregiver vs. 5 hours for coresiding caregiver; P < 0.05; see Fig. 2). We did not detect significant differences in impairment between female- and male-employed caregivers (see Table 3), although the sample size of employed male caregivers (N = 36) may limit inferences that can be made from these data. Although we did not observe significant differences in work productivity loss by income sufficiency, regular activity productivity loss was significantly higher among caregivers who reported not having enough money to make ends meet at the end of the month (P < 0.05).
Table 3.
Effect of caregiving on work and regular activity productivity among employed and nonemployed caregivers (CG): percent loss (SD)
| Work productivity loss |
Regular activity loss |
||||
|---|---|---|---|---|---|
| % absenteeism (SD) | % presenteeism (SD) | % productivity loss (SD) | % activity loss (SD) | ||
| n = 125 | N = 308† | ||||
| Coreside with care-recipient | No n = 63 | 5.7 (18.2) | 14.3 (24.7) | 15.0 (26.3)* | 22.5 (28.9) |
| Yes n = 62 | 4.1 (8.9) | 22.7 (25.8) | 25.2 (26.7)* | 29.0 (30.7) | |
| Gender | Male n = 36 | 2.5 (5.6) | 15.8 (22.2) | 17.8 (22.6) | 25.8 (28.7) |
| Female n = 89 | 5.9 (16.5) | 19.6 (26.8) | 21.1 (28.5) | 27.7 (31.0) | |
| Relationship with care-recipient | Spouse n = 21 | 4.7 (11.6) | 21.0 (21.0) | 23.2 (30.3) | 26.0 (29.2) |
| Child n = 88 | 3.7 (8.6) | 16.9 (16.9) | 19.0 (24.6) | 26.5 (30.6) | |
| Other n = 16 | 12.3 (32.5) | 23.8 (23.8) | 22.7 (35.1) | 36.2 (33.2) | |
| Has additional help | No n = 53 | 3.7 (8.8) | 20.2 (24.9) | 21.8 (26.5) | 25.5 (29.9) |
| Yes n = 72 | 5.8 (17.2) | 17.2 (26.0) | 19.0 (27.3) | 29.0 (30.6) | |
| Caregiver age | <65 n = 104 | 4.1 (9.4) | 18.3 (24.4) | 20.3 (26.1) | 25.8 (29.7) |
| 65+ n = 21 | 8.8 (27.8) | 19.5 (31.2) | 19.5 (31.2) | 28.7 (31.0) | |
| Dependent child living in caregiver’s household | None n = 91 | 6.2 (16.4) | 18.8 (27.1) | 21.0 (28.6) | 27.1 (30.2) |
| Child age <18 n = 34 | 1.3 (3.4) | 17.6 (21.0) | 17.8 (21.6) | 27.4 (31.2) | |
| How money works out each month | Some left over n = 75 | 4.3 (15.5) | 15.7 (25.9) | 16.6 (26.2) | 22.8 (28.1)* |
| Just enough n = 38 | 5.4 (11.5) | 22.1 (23.9) | 25.3 (27.3) | 31.8 (33.1)* | |
| Not enough n = 12 | 6.9 (14.8) | 24.2 (23.9) | 26.4 (27.6) | 37.4 (29.4)* | |
| Highest level of education | Some high school or high school grad n = 28 | 4.2 (11.1) | 13.2 (21.4) | 15.7 (24.0) | 28.3 (33.1) |
| Some college n = 44 | 4.3 (9.9) | 22.3 (25.3) | 24.7 (27.0) | 26.1 (27.9) | |
| College grad n = 24 | 10.0 (26.0) | 22.1 (31.6) | 24.0 (31.7) | 28.0 (27.3) | |
| More than college n = 29 | 2.0 (5.5) | 14.8 (23.7) | 13.9 (24.2) | 25.8 (30.1) | |
| Total | 4.9 (14.3) | 18.5 (25.5) | 20.1 (26.8) | 27.2 (30.3) | |
Significant difference between groups P < 0.05.
The calculation for impact on regular activity was done with the entire caregiving sample (employed and unemployed). SD, standard deviation.
Figure 2.
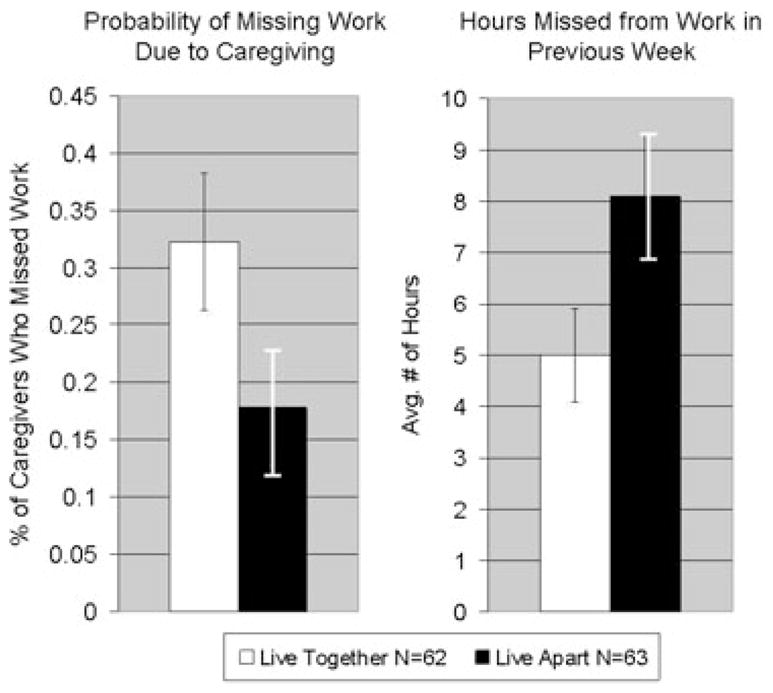
Coresiding with the care-recipient was associated with a higher likelihood of missing work for working caregivers (CG; 32% of coresiding CG vs. 18% of non–coresiding CG; P < 0.05). However, non–coresiding caregivers who missed any work time, missed more overall work time (8 hours. for non–coresiding CG vs. 5 hours. for coresiding CG; P < 0.05). This pattern suggests that while coresiding caregivers show more overall work productivity loss, the quantity of time missed from work is less than similar non–coresiding caregivers. Caregiving-related work productivity impact and 95% confidence intervals in coresiding caregivers versus non–coresiding caregivers.
Impact of Caregiving on Productivity
Across the entire employed caregiver sample, there was a 4.9% [standard deviation (SD): 14.3] loss in work time [1.5 (SD: 3.4) hours in previous week] due to caregiving-related absenteeism. Seventy-five percent of caregivers reported no missed work time due to caregiving in the previous week, although 25.0% reported missing an average of 6.1 (SD: 4.4) hours of work in the previous week due to caregiving. Across the entire employed caregiving sample, the productivity loss while at work was 18.5% (SD: 25.5). The combination of missing 4.9% of work time and being only 81.5% productive while at work resulted in a total impact of 20.1% (SD: 26.8) work productivity loss due to caregiving.
Caregiving-related impacts also were evident for productivity in the non-work setting. Both employed and nonemployed caregivers reported an average of 27.2% (SD: 30.3) impairment in usual activities due to caregiving (see Table 3).
Discussion
Results of this study indicate that the WPAI: CG is a valid tool to assess the impact of informal caregiving for chronically ill older adults on work productivity. The WPAI has been validated for use with at least eight chronic illnesses [28,30–32,34–37,50] and has been shown to be highly correlated with disease severity in each of the validation studies (correlations ranging from 0.3–0.7) [43]. Although the “severity” of caregiving is difficult to measure given its complexity and the diversity of experiences across emotional, physical, and financial dimensions, we examined several measures that broadly reflect the intensity of caregiving, all of which were highly associated with the WPAI:CG measure. When using the patient’s HCC score as a proxy for medical complexity, the WPAI:CG indicated that productivity loss increased in a stepwise manner along with anticipated levels of health services. A similar strong relationship was seen between WPAI:CG and number of ADL tasks with which caregivers assisted. Another proxy for intensity of caregiving is whether the caregiver coresides with their care-recipient. Caregivers who live with the person they care for are generally engaged in more caregiving tasks than caregivers who live separately from their care-recipient [7]. In our sample, coresidence with ones’ care-recipient was associated with greater productivity loss due to caregiving. Previous validation studies of the WPAI have also shown positive correlations between the WPAI and health-related quality-of-life measures, although the relationship has consistently been weaker than the relationship between WPAI and disease severity [35,43,49]. The CSI, which measures the subjective burden of care provision, showed significant correlations with both work and regular activity productivity loss. Similarly, we showed moderate correlations between work productivity loss and depression (measured by the CESD).
Providing informal care to a disabled older adult was found to be associated with a 20% decrease in work productivity and a 27% decrease in regular activity productivity each week in this sample of caregivers of medically complex older adults. Assessing work productivity loss due to caregiving with the WPAI:CG allows employers and researchers to understand the relative impact of caregiving in relation to other chronic health conditions. Regular activity productivity loss reported in this study is comparable to the 29.9% decrease that was found in a study of partners of Alzheimer’s patients, using the WPAI to assess the impact of care-recipient’s mood and mental state on regular activity productivity in the caregiver [38]. This 20% work productivity loss is also comparable to the impairment some chronic diseases have on work productivity. Using the WPAI, previous studies have found that gastroesophageal reflux disease reduces work productivity by 23% and regular activity productivity by 30% [35]. Similarly, irritable bowel syndrome has been shown to reduce work productivity by 21% and regular activity by 27%, and to correlate with symptom severity and health-related quality of life [50].
Several limitations should be noted. Although the study sample of both caregivers and care-recipients are well defined and representative of the caregiving dyads of medically complex older adults, the sample was not large or geographically diverse. We also could not assess the responsiveness of the survey in its ascertainment of change in caregiver work productivity over time. Before this measure is adopted in future studies, research will be needed to determine whether the measure responds to successful intervention. Furthermore, the patients and caregivers enrolled in the study had to be willing to be randomized into the GC study. Little is known about the 14% of caregivers of randomized patients who refused to participate. Despite these limitations, our results are consistent with data from surveys of employers nationally. In a recent survey of employees in several companies, 60% of respondents reported a high-to-moderate degree of productivity loss as a result of workday interruptions caused by caregiving [25].
The WPAI:CG possesses several advantages relative to other measures which have been used to study caregiving-related work productivity loss. The WPAI:CG measure of productivity loss accounts for both hours lost due to being absent from work (absenteeism) and the impact of caregiving on overall work productivity while at work (presenteeism). Together, these two measures provide a more complete picture of the impact of caregiving on productivity than measures that exclusively ascertain hours lost from work. The WPAI:CG further advances the field by measuring the direct impact of caring for a chronically ill older adult on productivity. A previous study using the WLQ examined the secondary effects of caregiver’s mood and emotional state on productivity [20] which limits the inferences that can be made about caregiving alone. By directly measuring the effect of caregiving, the measure takes into account many aspects of caregiving, which may include financial concerns, conflict with other family members, and time spent managing health-care services, as well as the care-recipient’s illness and emotional state. The WPAI:CG therefore provides a more accurate representation of productivity loss measurement by asking individuals to directly assess how caregiving for a chronically ill older adult has affected their productivity.
Conclusion
The results indicate a high convergent validity of the WPAI:CG questionnaire. This measure could facilitate research on the cost-effectiveness of workplace caregiver interventions, and provide employers and policy experts with a more accurate and comprehensive estimate of the costs to employers and society associated with informal caregiving.
Acknowledgments
The authors acknowledge the invaluable contributions to this study made by Johns Hopkins Community Physicians, MedStar, Battelle Centers for Public Health Research, the Centers for Medicare & Medicaid Services, and all of the participating patients, caregivers, physicians, and GC nurses. Aspects of this article were presented at the 2007 annual meeting of the Gerontological Society of America.
Source of financial support: This study was supported by the Jacob and Valeria Langeloth Foundation, The John A Hartford Foundation, the Agency for Healthcare Research and Quality, the National Institute on Aging, Kaiser-Permanente Mid-Atlantic, Johns Hopkins HealthCare, and the Roger C. Lipitz Center for Integrated Health Care.
Footnotes
Supporting information for this article can be found at: http://www.ispor.org/publications/value/ViHsupplementary.asp
References
- 1.Johnson R, Wiener J. A Profile of Frail Older Americans and Their Caregivers. Washington, DC: The Urban Institute; 2006. [Google Scholar]
- 2.Wolff JL, Kasper JD. Caregivers of frail elders: updating a national profile. Gerontologist. 2006;46:344–56. doi: 10.1093/geront/46.3.344. [DOI] [PubMed] [Google Scholar]
- 3.Schultz AB, Edington DW. Employee health and presenteeism: a systematic review. J Occup Rehabil. 2007;17:547–79. doi: 10.1007/s10926-007-9096-x. [DOI] [PubMed] [Google Scholar]
- 4.Pitsenberger D. Juggling work and elder caregiving: work-life balance for aging American workers. AAOHN J. 2006;54:181–5. doi: 10.1177/216507990605400408. [DOI] [PubMed] [Google Scholar]
- 5.Wagner D. Families, work, and an aging population: developing a formula that works for workers. J Aging Soc Policy. 2006;18:115–25. doi: 10.1300/J031v18n03_08. [DOI] [PubMed] [Google Scholar]
- 6.Lilly M, Laporte A, Coyte P. Labor market work and home care’s unpaid caregivers: a systematic review of labor force participation rates, predictors of labor market withdrawal, and hours of work. Milbank Q. 2007;85:641–90. doi: 10.1111/j.1468-0009.2007.00504.x. [DOI] [PMC free article] [PubMed] [Google Scholar]
- 7.Convinsky K, Eng C, Lui L, et al. Reduced employment in caregivers of frail elders: impact of ethnicity, patient clinical characteristics and caregiver characteristics. J Gerontol B Psychol Sci Soc Sci. 2001;56:M707–13. doi: 10.1093/gerona/56.11.m707. [DOI] [PubMed] [Google Scholar]
- 8.Pohl J, Collins C, Given C. Longitudinal employment decisions of daughters and daughters-in-law after assuming parent care. J Women Aging. 1998;10:59–74. doi: 10.1300/j074v10n01_05. [DOI] [PubMed] [Google Scholar]
- 9.FAWI. The 1998 Business and Worklife Study. New York: Families and Work Institute; 1998. [Google Scholar]
- 10.Kneipp S, Castleman J, Gailor N. Informal caregiving burden: an overlooked aspect of the lives and health of women transitioning from welfare to employment. Public Health Nurs. 2004;21:24–31. doi: 10.1111/j.1525-1446.2004.21104.x. [DOI] [PubMed] [Google Scholar]
- 11.Charmichael F, Charles S. The opportunity costs of informal care: does gender matter? J Health Econ. 2003;22:781–803. doi: 10.1016/S0167-6296(03)00044-4. [DOI] [PubMed] [Google Scholar]
- 12.Johnson R, Lo Sasso A. The impact of elder care on women’s labor supply. Inquiry. 2006;43:195–210. doi: 10.5034/inquiryjrnl_43.3.195. [DOI] [PubMed] [Google Scholar]
- 13.Pavalko E, Henderson K. Combining care work and paid work: do workplace policies make a difference? Res Aging. 2006;28:359–74. [Google Scholar]
- 14.Pavalko E, Artis J. Women’s caregiving and paid work: casual relationships in late midlife. J Gerontol B Psychol Sci Soc Sci. 1997;52B(Suppl):S170–9. doi: 10.1093/geronb/52b.4.s170. [DOI] [PubMed] [Google Scholar]
- 15.Van Pelt D, Milbrandt E, Qin L, et al. Informal caregiver burden among survivors of prolonged mechanical ventilation. Am J Respir Crit Care Med. 2007;175:167–73. doi: 10.1164/rccm.200604-493OC. [DOI] [PMC free article] [PubMed] [Google Scholar]
- 16.Neal M, Wagner D. Working Caregivers: Issues, Challenges and Opportunities for the Aging Network (National Family Caregivers Support Program Selected Issue Brief) Washington, DC: Administration on Aging; 2001. [Google Scholar]
- 17.Hepburn C, Barling J. Eldercare responsibilities, inter-role conflict and employee absence: a daily study. J Occup Health Psychol. 1996;1:311–8. doi: 10.1037//1076-8998.1.3.311. [DOI] [PubMed] [Google Scholar]
- 18.Krach P, Brooks J. Identifying the responsibilities & needs of working adults who are primary caregivers. J Gerontol Nurs. 1995;21:41–50. doi: 10.3928/0098-9134-19951001-09. [DOI] [PubMed] [Google Scholar]
- 19.Wilson M, Van Houtven C, Stearns S, Clipp EC. Depression and missed work among informal caregivers of older individuals with dementia. J Fam Econ Iss. 2007;28:684–98. [Google Scholar]
- 20.Burton W, Chen C, Conti D, et al. Caregiving for ill dependents and its association with employee health risks and productivity. J Occup Environ Med. 2004;46:1048–56. doi: 10.1097/01.jom.0000141830.72507.32. [DOI] [PubMed] [Google Scholar]
- 21.Burton L, Newsom J, Schulz R, et al. Preventive health behaviors among spousal caregivers. Prev Med. 1997;26:162–9. doi: 10.1006/pmed.1996.0129. [DOI] [PubMed] [Google Scholar]
- 22.Gallagher D, Rose J, Rivera P, et al. Prevalence of depression in family caregivers. Gerontologist. 1989;29:449–56. doi: 10.1093/geront/29.4.449. [DOI] [PubMed] [Google Scholar]
- 23.Schulz R, Beach S. Caregiving as a risk factor for mortality: the Caregiver Health Effects Study. JAMA. 1999;282:2215–19. doi: 10.1001/jama.282.23.2215. [DOI] [PubMed] [Google Scholar]
- 24.Stephens M, Franks M, Atienza A. Where two roles intersect: spillover between parent care and employment. Psychol Aging. 1997;12:30–7. doi: 10.1037//0882-7974.12.1.30. [DOI] [PubMed] [Google Scholar]
- 25.HRI. Measuring the Impact of Caregiving Responsibilities in the Labor Force: Employer Perspective. St. Petersburg, FL: Human Resource Institute; 2000. [Google Scholar]
- 26.NAC. Caregiving in the US. Washington, DC: National Alliance for Caregiving; 2004. [Google Scholar]
- 27.MetLife. The MetLife Caregiving Cost Study: Productivity Losses to U.S. Businesses. Washington, DC: MetLife Mature Market Institute; 2006. [Google Scholar]
- 28.Jacobs RJ, Davidson JR, Gupta S, et al. The effects of clonazepam on quality of life and work productivity in panic disorder. Am J Manag Care. 1997;3:1187–96. [PubMed] [Google Scholar]
- 29.Bousquet J, Neukirch F, Bousquet P, et al. Severity and impairment of allergic rhinitis in patients consulting in primary care. J Allergy Clin Immunol. 2006;117:158–62. doi: 10.1016/j.jaci.2005.09.047. [DOI] [PubMed] [Google Scholar]
- 30.Fowler JF, Ghosh A, Sung J, et al. Impact of chronic hand dermatitis on quality of life, work productivity, activity impairment, and medical costs. J Am Acad Dermatol. 2006;54:448–57. doi: 10.1016/j.jaad.2005.11.1053. [DOI] [PubMed] [Google Scholar]
- 31.Reilly MC, Lavin PT, Kahler KH, et al. Validation of the Dermatology Life Quality Index and the Work Productivity and Activity Impairment-Chronic Hand Dermatitis questionnaire in chronic hand dermatitis. J Am Acad Dermatol. 2003;48:128–30. doi: 10.1067/mjd.2003.128. [DOI] [PubMed] [Google Scholar]
- 32.Chen H, Blanc PD, Hayden ML, et al. Assessing productivity loss and activity impairment in severe or difficult-to-treat asthma. Value Health. 2008;11:231–9. doi: 10.1111/j.1524-4733.2007.00229.x. [DOI] [PubMed] [Google Scholar]
- 33.Chen H, Gould MK, Blanc PD, et al. Asthma control, severity, and quality of life: quantifying the effect of uncontrolled disease. J Allergy Clin Immunol. 2007;120:396–402. doi: 10.1016/j.jaci.2007.04.040. [DOI] [PubMed] [Google Scholar]
- 34.Calleja JL, Bixquert M, Maldonado J. Impact of nocturnal heart-burn on quality of life, sleep, and productivity: the SINERGE study. Dig Dis Sci. 2007;52:2858–65. doi: 10.1007/s10620-006-9196-z. [DOI] [PubMed] [Google Scholar]
- 35.Wahlqvist P, Carlsson J, Stalhammer N, et al. Validity of a Work Producitivy and Activity Impairment Questionnaire for patients with symptoms of Gastro-Esophageal Reflux Disease (WPAI-GERD)—results from a cross-sectional study. Value Health. 2002;2:106–13. doi: 10.1046/j.1524-4733.2002.52101.x. [DOI] [PubMed] [Google Scholar]
- 36.Bushnell DM, Reilly MC, Galani C, et al. Validation of electronic data capture of the irritable bowel syndrome—quality of life measure, the work productivity and activity impairment questionnaire for irritable bowel syndrome and the EuroQol. Value Health. 2006;9:98–105. doi: 10.1111/j.1524-4733.2006.00087.x. [DOI] [PubMed] [Google Scholar]
- 37.Reilly MC, Bracco A, Ricci JF, et al. The validity and accuracy of the Work Productivity and Activity Impairment questionnaire—irritable bowel syndrome version (WPAI:IBS) Aliment Pharmacol Ther. 2004;20:459–67. doi: 10.1111/j.1365-2036.2004.02091.x. [DOI] [PubMed] [Google Scholar]
- 38.Reilly MC, Relkin NR, Zbrozek A. Development and testing of a new outcome measure of relationship between patients with Alzheimer’s disease and their partners. Am J Alzheimers Dis Other Demen. 2006;21:249–54. doi: 10.1177/1533317506290665. [DOI] [PMC free article] [PubMed] [Google Scholar]
- 39.Boyd C, Boult C, Shadmi E, et al. Guided Care for multi-morbid older adults. Gerontologist. 2007;47:697–704. doi: 10.1093/geront/47.5.697. [DOI] [PubMed] [Google Scholar]
- 40.Boult C, Reider L, Frey K, et al. The early effects of “Guided Care” on the quality of health care for multi-morbid older persons: a cluster-randomized controlled trial. J Gerontol A Biol Sci Med Sci. 2008;63A:321–7. doi: 10.1093/gerona/63.3.321. [DOI] [PubMed] [Google Scholar]
- 41.Wolff J, Rand-Giovannetti E, Palmer S, et al. Caregiving and chronic care: the guided care program for family and friends. J Gerontol A Biol Sci Med Sci. doi: 10.1093/gerona/glp030. in press. [DOI] [PMC free article] [PubMed] [Google Scholar]
- 42.Pope G, Kautter J, Ellis R, et al. Risk adjustment of Medicare capitation payments using the CMS-HCC model. Health Care Financ Rev. 2004;25:119–41. [PMC free article] [PubMed] [Google Scholar]
- 43.Prasad M, Wahlqvist P, Shikiar R, et al. A review of self-reported instruments measuring health-related work productivity. Pharmacoeconomics. 2004;22:225–44. doi: 10.2165/00019053-200422040-00002. [DOI] [PubMed] [Google Scholar]
- 44.Robinson B. Validation of a Caregiver Strain Index. J Gerontol. 1983;38:344–8. doi: 10.1093/geronj/38.3.344. [DOI] [PubMed] [Google Scholar]
- 45.Thornton M, Travis S. Analysis of the reliability of the modified Caregiver Strain Index. J Gerontol B Psychol Sci Soc Sci. 2003;58B(Suppl):S127–32. doi: 10.1093/geronb/58.2.s127. [DOI] [PubMed] [Google Scholar]
- 46.Weissman MM, Sholomskas D, Pottenger M, et al. Assessing depressive symptoms in five psychiatric populations: a validation study. Am J Epidemiol. 1977;106:203–14. doi: 10.1093/oxfordjournals.aje.a112455. [DOI] [PubMed] [Google Scholar]
- 47.Katz S, Ford AB, Moskowitz RW, et al. Studies of illness in the aged. the index of Adl: a standardized measure of biological and psychosocial function. JAMA. 1963;185:914–19. doi: 10.1001/jama.1963.03060120024016. [DOI] [PubMed] [Google Scholar]
- 48.Netemeyer RG, Bearden WO, Sharma S. Scaling Procedures: Issues and Applications. Thousand Oaks, CA: Sage Publications; 2003. [Google Scholar]
- 49.Reilly M, Zbrozek A, Dukes E. The validity and reproducibility of a work productivity and activity impairment instrument. Pharmacoeconomics. 1993;4:353–65. doi: 10.2165/00019053-199304050-00006. [DOI] [PubMed] [Google Scholar]
- 50.Dean B, Aguilar D, Barghout V, et al. Impairment in work productivity and health-related quality of life in patients with IBS. Am J Manag Care. 2005;1(Suppl):S17–26. [PubMed] [Google Scholar]