Abstract
Rosmarinic acid (RA) is an ester of caffeic acid and 3, 4‐dihydroxyphenyllacticacid. It is commonly found in Coleus blumei, Salvia officinalis, Melissa officinalis and Rosmarinus officinalis. The biosynthesis of RA starts with precursor molecules L‐phenylalanine and L‐tyrosine. Simulation of RA biosynthetic pathway was done using Gepasi Software, includes the reaction kinetics of each step of the pathway and different integration methods such as Euler's method. Optimization of the significant parameters responsible for RA biosynthesis was carried out. As the goal of the work was to increase the productivity of i.e. to maximize the concentration of the RA, the final concentration of RA ([RA]t) was selected as an objective function and selected initial concentration of the Caffeoyl‐3’‐4’hydroxyphenyllactic acid (3’C4HPLA) as parameter constraint and varied its initial concentration as: 0≤ [3’C4HPLA]i ≤ 0.025. Several optimization methods such as Simulated annealing, Evolutionary algorithms and Genetic algorithms were used to optimize the objective function. After optimization the final concentration of RA was slightly higher (4.566132e‐002 mM) than before optimization (4.047119e‐ 002 mM). On the basis of results obtained, it is clear that 4‐hydroxyphenyllactic acid and 3’C4HPLA play major role in the high productivity of the RA.
Keywords: Metabolic modeling, Rosmarinic acid, Simulation, Simulated annealing
Background
A model is a representation of some observable natural phenomenon. To model a particular phenomenon on the basis of some observations, first a conceptual part is developed, then (but not always) a mathematical part and finally (also not always) an experimental part. The process of making the model work is called simulation. Simulation can be carried out for at least two distinct purposes: one might be interested in using it to test the theory that the model is based upon, or, if the theory seems to be satisfactory, to predict situations that might occur (be observed) in ‘reality’. Simulation can be carried out in biological systems also. One can simulate any biological molecule (protein) or any biological process such as any metabolic pathway that may be for synthesis or degradation of particular metabolite.
Modeling Kinetics
Traditionally, kinetics has been defined in biochemistry in terms of enzyme steady‐state kinetics. This corresponds to a detailed study of the local properties of the individual enzymes. However, one can go further and create kinetic models of whole pathways. Such models are composed of coupled ordinary differential (for time courses) or algebraic (for steady states) equations. These equations are non‐linear and most often without analytical solution. This means that they can only be studied through numerical algorithms, such as the Newton method for solving non-linear equations and numerical integrators. Kinetic modeling of metabolic pathways may be carried out by computer software that simulates the behavior of a real pathway. Simulation then resembles a true experiment: one sets the initial concentration of the metabolites and the software then produces the time evolution and/or the steady state of these concentrations. There is, however, an additional amount of information to be supplied in the case of simulation: the differential equations describing the kinetics of the pathway and values for all the parameters involved in these equations. [1].
Biochemical dynamics
Biochemical dynamics addresses questions such as ‘How do reactions in closed system reach equilibrium?’, In open systems, do reactions approach a steady state?’, 'In which conditions do metabolite concentrations oscillate?’ or Can some simultaneous reactions display complex behavior? The main philosophical difference between biochemical dynamics and traditional enzyme kinetics is then reflected on the latter putting a great emphasis on the determination of mechanisms and estimation of kinetic parameters while the former is primarily concerned with temporal behavior, or trajectories. For this reason, it is frequently possible to ignore mechanistic arguments in biochemical dynamics and use phenomenological descriptions of rates of single enzymes, simplifying the lower level step significantly [2].
Optimization
Optimization problems are concerned with locating optima (maxima or minima) of the function. Finding a maximum of a function f(x) is equivalent to finding the minimum of the function ‐f(x). The problem can be stated in the general term as follows:
Given a real valued scalar function f(x) of n variables, x = (x1 …xn), problem is to find the optimum of function f(x) such that gi (x)>=0 with i = 1 …m (inequality constraint) and hj(x) = 0 with j = 1… m (equality constraint).
In general, the objective function f(x) and the constraints gi(x) and hj(x) are non linear, although frequently the only constraints are linear boundaries of the form ai≫=xi≫=bi (these actually translate into two separate constraints: xi‐ai>=0 and bi‐xi>=0), where ai and bi are often positive constants [3].
Methodology
Pathway of the Rosmarinic acid biosynthesis
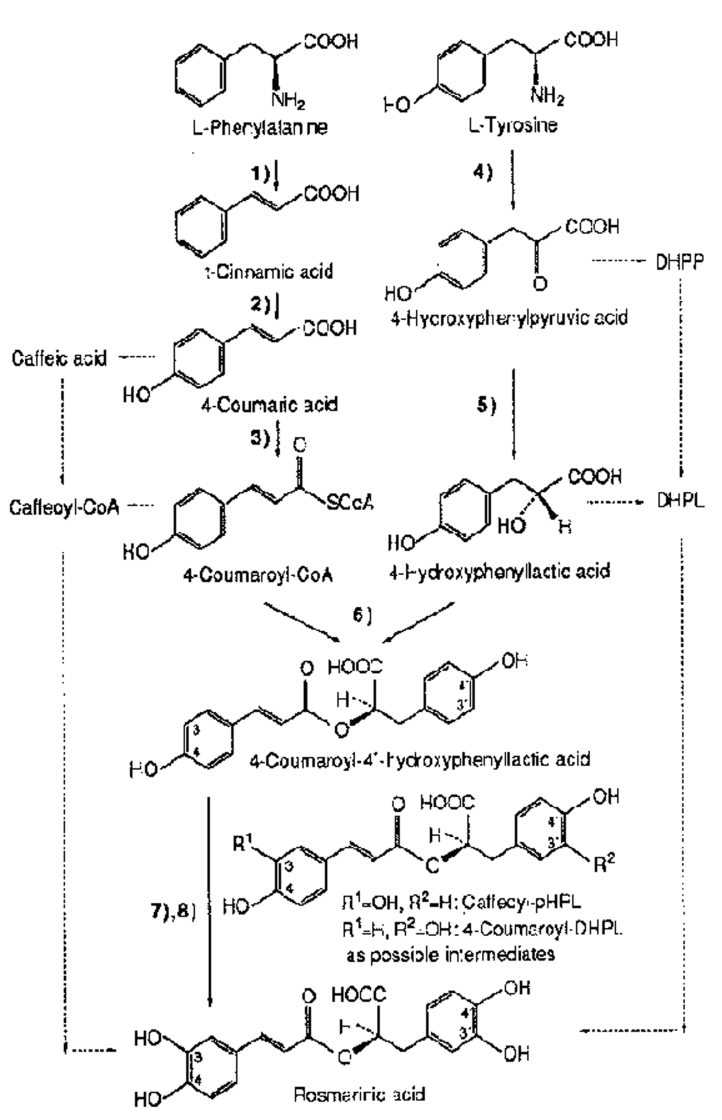
Chemical synthesis of Rosmarinic acid was long sought after and was finally achieved in 1991 by Albrecht [8] (Figure 1). Since then a number of chemical syntheses of Rosmarinic acid and derivatives, e.g. the methylester, different stereoisomers or the less hydroxylated isorinic acid [6] have been described.
Figure 1.
Biosynthetic pathway of Rosmarinic acid (M.Petersan et al. 1993) [8]
Metabolic simulation software
Gepasi 3.3 is a Microsoft Windows program intended for the simulation of the kinetics of systems of chemical and biochemical reactions. Gepasi simulates the steady‐state and time‐course behaviour of reactions in several compartments of different volumes [2].
Modeling of the Rosmarinic acid biosynthesis pathway
To run the simulation of the biosynthetic pathway of Rosmarinic acid on Gepasi, the primary task is to input the pathway into the Gepasi. This process is known as defining the model. (Table1 see supplementary material). Gepasi takes the reaction in the form of ODEs as mentioned in (Table 2 see supplementary material). In the Metabolites field, the initial concentration of all metabolites in the pathway is defined as in (Table 3 see supplementary material). In this simulation, we were interested in the study of the time course behaviour of the metabolite concentration and the increase of the Rosmarinic acid productivity. The main objective of the simulation was to test the relative change in the concentrations of the metabolites during the course of the simulation. For this purpose, we defined 50 sample points for each iteration and end time was set at 500. Metabolites for the analysis of time course behaviour were set in the Time Course menu. This menu provides the interactive plot facility to examine the relative change in the concentration of the metabolites with time. Optimization parameters such as objective function and parametersconstraints were selected in the Optimization tab. The method of optimization must be specified in the Methods option. The process of the optimization involves following steps:
Set initial values for the adjustable parameters.
Evaluate the objective function by simulation.
Finish if stopping criterion satisfied.
Generate new guess for the adjustable parameters.
Go back to step 2.
First, the simulation was run without assigning optimization parameters. The need of this step was to evaluate the objective function in the simulation. Once the objective function is determined, the optimization is carried out. Objective function was set into the “Objective function” tab in the optimization page of Gepasi. After this, parameters were included in the optimization simulation which may be responsible for the maximization or minimization of the objective function. We used Genetic Algorithm (Stochastic method) method for optimization at 10 population and 200 iterations.
Discussion
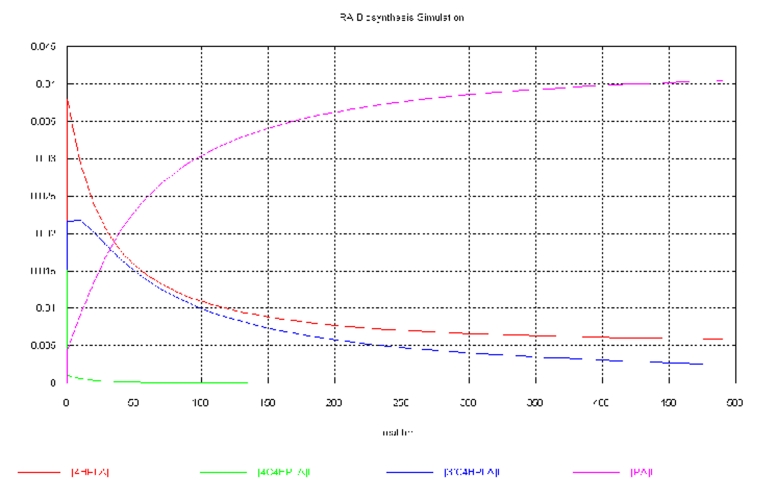
Our goal was to study the dynamics (time course behaviour) of the simulation. During the course of simulation, initial concentration of the metabolites changes with time. Gepasi evaluates these concentrations by integrating the ordinary differential equations (Table 4 see supplementary material). At t = 0, the initial concentration of Rosmarinic acid was zero, but, as the reaction proceeds, the concentration of the Rosmarinic acid increases with time. Simultaneously the concentration of the other metabolites decreases with time as they had been consumed during the course of the simulation. We could not get the steady state of the simulation. Integration of ODEs states that concentration of only few metabolites shows remarkable change which can be observed by Figure 2 and Table 5 see supplementary material. On the basis of the results, we can conclude that certain parameters such as 4HPLA and 3’‐C‐4HPLA show remarkable change. So to maximize the production of the Rosmarinic acid, one should adjust the concentration of the 4HPLA and 3’‐C‐4HPLA.
Figure 2.
Change in concentration of the metabolites with time
In the optimization step, we tried to optimize (maximize) the transient concentration (concentration at time t) of Rosmarinic acid [RA]t as an objective function. We selected initial concentration of the Caffeoyl‐3’‐ 4’hydroxyphenyllactic acid (3’C4HPLA) as parameter constraint and varied its concentration between 0 and 0.025 such that: 0 ≤ [3’C4HPLA]i ≤ 0.025
We used Genetic algorithm methodology to optimize the objection function that is [RA]t, and carried out 200 iterations of optimization. For results (see supplementary material)
In 200 iterations, 2048 simulations were carried out in 31 sec. at the rate of 66.0323 simulations /sec. The best concentration of Rosmarinic acid at time t was found as [RA]t = 0.006323031(6.32031e‐002) when the initial concentration of Caffeoyl‐3’‐4’hydroxyphenyllactic acid (3’C4HPLA) was 0.025.
There was a slight increase in the productivity of the Rosmarinic acid after the optimization step (Figure 2). Before optimization: 4.047119e‐002 mM; After optimization: 4.566132e‐ 002 mM; Change in concentration:0.519013e‐002 mM
Conclusion
If one desires to increase the productivity of any biochemical product in the pathway, a long process of biochemical analysis and researches needs to be carried out. This takes much amount of money and human effort and there was no guarantee of positive result. But, the concept of metabolic modeling has solved the problem up to much extent. Computer evaluates the pathway in the mathematical language by using ordinary differential equations and many numerical integration methods. On the basis of simulation of the pathway, approximation can be done about the pathway and productivity can be predicted. Optimization of the metabolic pathway determines the significant parameters, on which one can optimize (maximize or minimize) the yield as per requirement. Here, we used Rosmarinic acid and tried to optimize its biosynthetic pathway to obtain higher yield. On the basis of results obtained, it is clear that 4‐ hydroxyllactic acid and Caffeoyl‐3’‐4‐hydroxyphenyllactic acid play major role in the high productivity of the Rosmarinic acid. On the basis of these approximations, wet lab experiments can be carried out and high yield of the product can be obtained. Thus, in silico analysis of metabolic pathways provides an opportunity to find out the step, which affects the end product, consequently making it easy to design our wet lab experiments with respect to time and economic gains.
Supplementary material
Acknowledgments
We thank to The Coordinator, Centre for Bioinformatics, University of Allahabad for providing us necessary infrastructure facilities.
Footnotes
Citation:Sundaram et al Bioinformation 5(4): 168-172 (2010)
References
- 1.Snoep J, et al. The Biochemist. 1999 February 25. [Google Scholar]
- 2.Mendes P, et al. Comput Appl Biosci. 1993;9(5):563. doi: 10.1093/bioinformatics/9.5.563. [DOI] [PubMed] [Google Scholar]
- 3.Mendes P, Kell DB. Bioinformatics. 1998;14(10):869. doi: 10.1093/bioinformatics/14.10.869. [DOI] [PubMed] [Google Scholar]
- 4.Petersen M, Simmonds MSJ. Phytochemistry. 2003;62:121. doi: 10.1016/s0031-9422(02)00513-7. [DOI] [PubMed] [Google Scholar]
- 5.William Zinsmeister J, et al. J Paleontology. 1989;63(6):731. [Google Scholar]
- 6.Michiyo Matsuno, et al. Science. 2009;325(5948):1688. doi: 10.1126/science.1174095. [DOI] [PubMed] [Google Scholar]
- 7.Petersen M, et al. Planta. 1993;189:10. [Google Scholar]
- 8.Zinsmeister AR, et al. Journal of the National Cancer Institute. 1991;83(23):1734. doi: 10.1093/jnci/83.23.1734. [DOI] [PubMed] [Google Scholar]
Associated Data
This section collects any data citations, data availability statements, or supplementary materials included in this article.


