Abstract
Background
Cancer biomarker studies utilizing the combination of tissue microarray and automated quantitative assessment of immunofluorescence (TMA-AQUA) have been successfully performed for various types of human carcinoma, but its performance characteristics have yet to be evaluated in human lymphoma.
Methods
A pilot TMA was constructed containing duplicate 1.5 mm cores from 15 cases of mantle cell lymphoma (MCL), 3 cases low-grade B-cell lymphoma, and 3 cases of benign lymphoid tissue. Protein expression of c-Myc, Cdc2, Cyclin D1, Ki-67, Mcm2, and p27 by immunofluorescence and chromagenic staining were evaluated by AQUA and visual scoring, respectively. Gene expression of cMYC, CDC2, and CCND1 was determined by quantitative nuclease protection assay (qNPA™).
Results
Protein expression between duplicate cores determined by AQUA showed excellent correlation for all markers (R = 0.79 to 0.94) and Cyclin D1 expression was significantly higher in MCL cases compared to non-MCL cases (p = 0.00019). Overall correlation of AQUA with scoring of chromagenic staining by two pathologists was good for all markers (R = 0.56 to 0.90), except Cdc2 (R = 0.25). Localization of expression to cytoplasmic and/or nuclear compartments was comparable to chromagenic staining patterns for all markers except Ki-67 and Mcm2, where a significant difference between nuclear and cytoplasmic expression could not be appreciated by AQUA, despite clear nuclear localization by chromagenic staining. Correlation of gene expression with protein expression was variable for CDC2, cMYC, and CCND1 (R = 0.32, 0.35, and 0.69).
Conclusions
TMA-AQUA has the potential to be successfully utilized as a high-throughput protein biomarker screening platform for MCL, however, appropriate target protein selection and antibody performance validation are factors that need to be considered.
INTRODUCTION
Tissue microarrays (TMAs) are now commonly used in the identification and validation of cancer biomarkers, largely because of their inherent efficiency and consistency in processing hundreds of tumor specimens at one time. On TMAs, tissue antigens are typically detected by immunohistochemistry (IHC) through probes linked to fluorescent molecules or, more commonly, a chromagen such as diaminobenzidine (DAB). Scoring the stained TMA has traditionally been a tedious and subjective task performed manually by a pathologist that has inherent limitations in efficiency, continuous scale quantification, and reproducibility. To address this issue, several platforms capable of automated analysis of TMAs have recently been introduced.
Automated Quantitative Analysis (AQUA™) (HistoRx, New Haven, CT) is a commercially available software package that allows for rapid, high-throughput, continuous scale, automated analysis of target expression in large-scale cohorts on TMAs.1 This technology is unique from other platforms which assess optical density of chromagen detected antigens in that it instead utilizes immunofluorescence-based antigen detection, which generates a more linear output with wider dynamic range.2 In addition, two analytical algorithms called PLACE (pixel-based locale assignment for compartmentalization of expression) and RESA (rapid exponential subtraction algorithm) assign the continuous measurement of antigen expression to tissue specific locales (for example, tumor vs stroma) and subcellular locales (for example, nuclear vs cytoplasm). PLACE utilizes co-localization of distinct fluorescent tags to delineate whether target antigen expression is in tumor or stroma and in which subcellular compartment it is expressed, while RESA compensates for any overlapping of subcellular compartments that occurs as a consequence of the thickness of the tissue sections and improves the accuracy of compartment assignment. The combined use of TMA-AQUA to measure protein biomarker expression has been validated in several solid tumor cohorts including prostate cancer, breast cancer, and melanoma.3, 4, 4-6
To our knowledge, the performance of TMA-AQUA has yet to be assessed in lymphoid malignancies. Herein, we assess TMA-AQUA as a potential tool for biomarker identification and validation in mantle cell lymphoma (MCL), a typically aggressive malignancy, but whose response to treatment can vary considerably. Gene expression studies show that MCL is heterogeneous in its expression of genes that control cell proliferation, with as much as a six year survival difference between those that have high versus low expression.7 There is a pressing need to translate these findings to clinical practice. Accordingly, a platform capable of screening and validating potential risk-stratifying biomarkers quantifiable by IHC in diagnostic MCL specimens could address this urgent need.
MATERIALS AND METHODS
TMA Construction
The TMA was constructed using formalin-fixed paraffin-embedded (FFPE) specimens from the University of Wisconsin Pathology archive. Tissues included were 15 cases of MCL (12 lymph nodes and 3 spleen), 2 cases of small lymphocytic lymphoma / chronic lymphocytic leukemia, 1 follicular lymphoma (Grade 1-2), 2 lymph nodes with reactive follicular hyperplasia, one benign tonsil, 1 infiltrating ductal carcinoma of the breast and 1 colon adenocarcinoma. Areas of interest were marked on a representative hematoxylin and eosin (H & E) stained section and duplicate 1.5 mm cores from the corresponding paraffin block were punched out for the TMA.
Monoclonal Antibodies
For immunohistochemistry and immunofluorescence, the following antibodies were used: mouse anti-human CD20 (L26, Biocare Medical, Concord, CA 1:200), rabbit anti-human CD20 (Labvision, Fremont, CA 1:200), mouse anti-human Mcm2 (BM28, BD Biosciences, San Jose, CA 1:400), rabbit anti-human Cyclin D1 (clone SP4, Biocare Medical 1:100), mouse anti-human Cdc2 (p34[17], Santa Cruz Biotechnology, Santa Cruz, CA 1:2000), mouse anti-human Ki-67 (Invitrogen, Carlsbad, CA 1:200), mouse anti-human c-Myc (9E10, Santa Cruz Biotechnology 1:100), and mouse anti-human p27 (Biocare Medical 1:200).
Chromagenic Immunohistochemistry
TMA sections (4μM thick) were cut onto slides and deparaffinized via serial xylene, ethanol, and dH2O washes. Heat induced epitope retrieval was performed in a decloaking chamber (Biocare Medical) for 3 minutes at 120°C. Endogenous peroxidases were blocked with Peroxidazed (Biocare Medical) and non-specific binding was minimized with Background Terminator (Biocare Medical). Endogenous biotin was blocked using the Avidin and Biotin kit (Biocare Medical). Primary antibodies and biotinylated secondary antibodies were applied for 60 and 30 minutes respectively, and the enzymatic reaction completed using a streptavidin-horseradish peroxidase conjugate, the chromagen DAB, and hematoxylin counterstain. Protein expression was scored independently on an Olympus BX41 microscope at 20X objective magnification by two pathologists (DTY and PJQ). The intensity of DAB staining on a scale of 0 (no staining), 1 (weak staining), and 2 (strong staining) was multiplied by an estimation of the percentage of stained cells to give a score of 0 to 2. Scores were averaged between duplicate cores and between 2 pathologists.
Immunofluorescent Immunohistochemistry
TMA sections (4μM thick) were cut onto slides and deparaffinized via serial xylene, ethanol, and dH2O washes. Heat induced epitope retrieval was performed in a decloaking chamber (Biocare Medical) for 3 minutes at 120°C. Endogenous peroxidase and non-specific binding were attenuated with Peroxidaze and Sniper (Biocare Medical) respectively. A mixture of appropriately diluted primary antibodies targeting CD20 and the protein of interest were applied to the TMA and incubated for 1 hour at room temperature. For visualization of CD20, an appropriate secondary antibody conjugated to Alexa 555 (Invitrogen, 1:200) was applied for 1 hour. For visualization of the protein of interest, an appropriate biotinylated secondary antibody was applied to the slide for 15 minutes at room temperature followed by another 15 minute incubation with strepavidin-horseradish peroxidase, followed by Alexa Fluor 647-Tyramide (Invitrogen, 1:50) in amplification buffer for 10 minutes. After washing with saline, the slides were coverslipped with ProLong Gold Antifade Reagent with 4, 6-diamidino-2-phenylindole (DAPI) mounting medium (Invitrogen).
AQUA Analysis
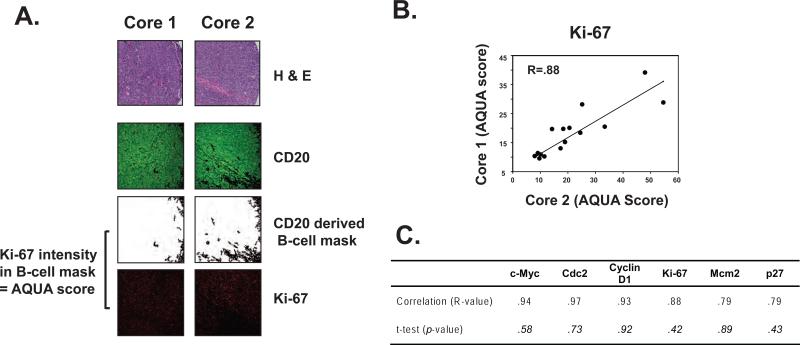
Staining quality on the TMA was ensured by incorporation and evaluation of positive control cores (comprised of reactive follicular hyperplasia, tonsil, colon carcinoma, and breast carcinoma, encompassing all the markers assessed) and a negative control TMA slide. Cores with poor staining quality due to section folding, loss of tissue, or excess trapping of fluorochrome were excluded from analysis. Image acquisition and algorithmic analysis of TMA using AQUA system (HistoRx, New Haven, CT) have been previously described extensively.1, 8 Briefly, B-cells within the tissue core selected for histologic involvement by MCL were identified by CD20 antibody tagged with Alexa Fluor 555 and used to delineate the membrane/cytoplasmic compartment within a B-cell tumor mask created through pixel-based locale assignment for compartmentalization of expression (PLACE) algorithm (Figure 1A) by subtracting out the non-B-cell background. DAPI was used to identify the nuclear compartment. In order to clearly delineate subcellular compartments, two images (1 in-focus and 1 out-of-focus) were taken of the compartment-specific tags and the target protein. A rapid exponential subtraction algorithm (RESA) was used to subtract the out-of-focus information in a uniform fashion from the entire microarray. The target proteins were visualized with Alexa Fluor 647 and pixels assigned to a specific subcellular compartment within the tumor mask via PLACE and the signal in each location is calculated an expressed as the average signal intensity per unit of compartment area expressed on a scale of 0 to 33333 as the AQUA score.
Figure 1. Correlation between target protein AQUA scores from duplicate cores of mantle cell lymphoma (MCL) cases on a tissue microarray.
(A) Automated quantitative analysis (AQUA) of target protein expression was performed by creating a B-cell mask delineating areas involved by MCL in each core, derived by CD20 immunofluorescence, followed by assessing fluorescence intensity of the target protein, Ki-67 in this example, within the B-cell mask, and is expressed as the AQUA score. (B) Example of core to core correlation of AQUA scores for Ki-67 by regression analysis and (C) correlation (R) of all target proteins assessed with no significant difference in mean AQUA scores between duplicate cores by unpaired t-test.
Quantitative nuclease protection assay
mRNA expression of target genes was determined by quantitative nuclease protection assay utilizing the qNPA™ (High Throughput Genomics, Tucson, AZ) assay. 5μm thick tissue sections from corresponding FFPE specimens utilized to construct the TMA were dissolved in lysis buffer and 50-mer probes specific for CDC2, CCND1, cMYC and the housekeeping genes TBP and B2M. Unhybridized probe was digested by S1 nuclease and alkaline hydrolysis destroyed mRNA of mRNA-probe duplexes, leaving intact probe with stoichiometric concentrations proportional to expressed mRNA. For detection, 50-mer linker oligonucleotides linked specific probes to specific anchor oligonucleotides embedded to the bottom of the wells, called array elements. Addition of a detection linker and detection probe followed by chemiluminescent substrate resulted in light emission from each array element proportional to the amount of probe bound at that position. Each case was run in triplicate and results averaged.
Statistical Analysis
Correlations were calculated by using a Pearson correlation coefficient on Sigmaplot software (Systat Software Inc., San Jose, CA). Paired t-test was used to compare nuclear versus cytoplasmic AQUA scores and unpaired t-test for all other comparison of means. A two-sided significance level of 0.05 was used for each statistical test.
RESULTS
Correlation between tissue cores
We compared the expression of six potential prognostic biomarkers in MCL (c-Myc, Cdc2, CyclinD1, Ki-67, Mcm2 and p27) between duplicate tissue cores punched from different representative areas of involvement in each specimen to assess whether heterogeneity of target antigen expression within the specimen would lead to sampling error, as each tissue core examines only a small fraction of the total tumor. Expression of target antigens in the B-cells, derived from PLACE based co-localization of target fluorescence with CD20 fluorescence and quantified as AQUA scores, correlated well between the cores with correlation coefficients ranging from 0.79 to 0.94 (Figure 1). Likewise, no significant difference in mean AQUA scores between cores was detected for any of the target antigens (Figure 1).
Validation of CyclinD1 expression in MCL cases
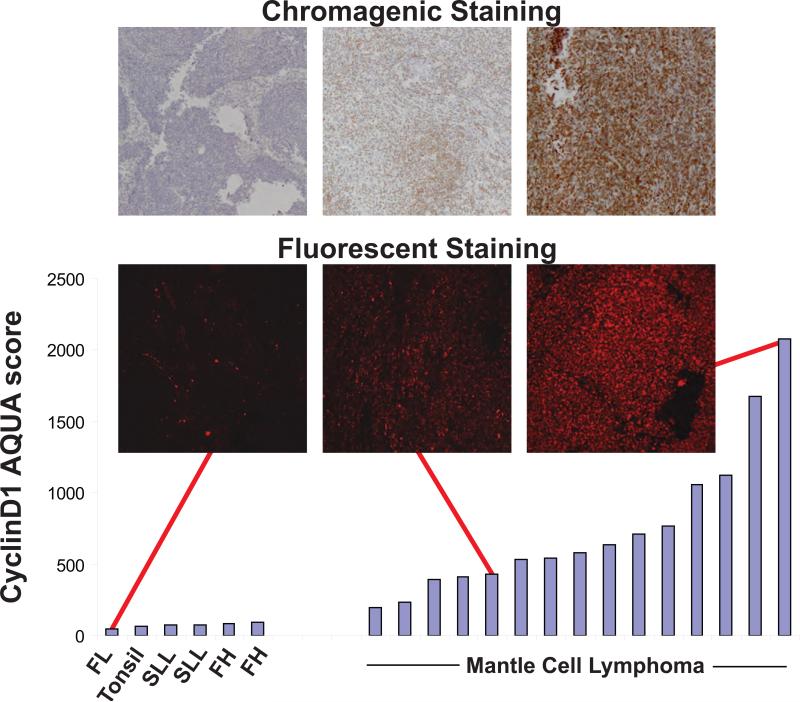
MCL is characterized by the t(11;14)(q13;q32) translocation which places the CCND1 gene under control of the immunoglobulin heavy chain enhancer and results in aberrant expression of CyclinD1 protein in the malignant B-cells. We assessed the ability of TMA-AQUA to quantify CyclinD1 expression within the B-cells by comparing AQUA scores for CyclinD1 in the B-cell compartment of six non-MCL cases with 15 MCL cases (Figure 2). AQUA scores were significantly higher (p= 0.00019) in the MCL cases.
Figure 2. Continuous quantitative assessment of Cyclin D1 expression in MCL and control cases represented on a tissue microarray by AQUA.
Mean immunofluorescence within the B-cell mask of duplicate tissue cores from MCL and non-MCL lymphoid tissues stained with anti-Cyclin D1 antibody expressed as AQUA scores. Unpaired t-test shows MCL cases have a significantly higher mean expression of Cyclin D1 compared to non-MCL cases (p = 0.00019). Chromagenic staining of corresponding cases are shown for comparison. FL indicates follicular lymphoma; SLL, small lymphocytic lymphoma; FH, follicular hyperplasia.
Quantification of target protein expression in subcellular compartments
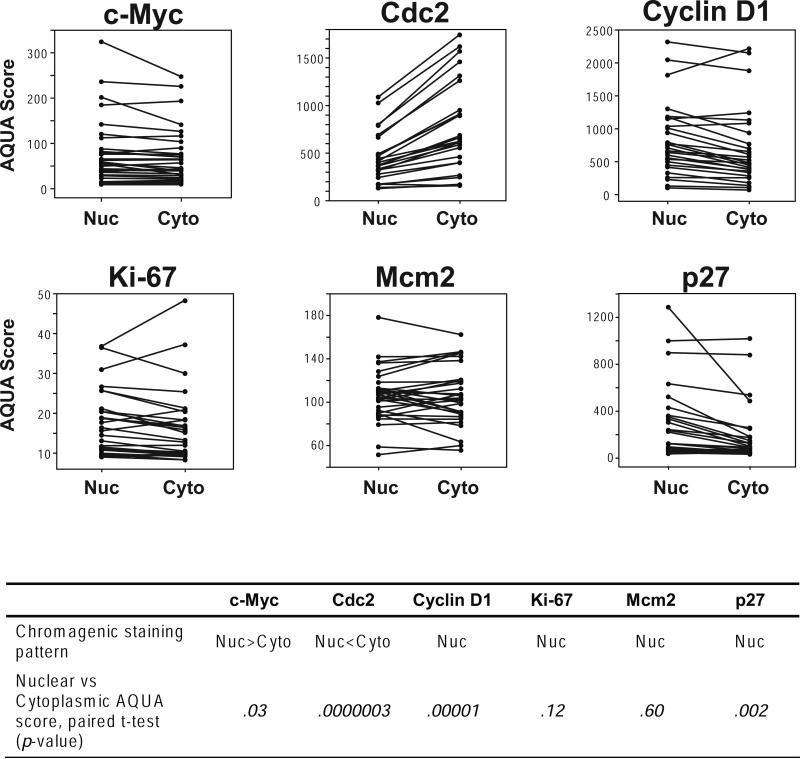
Relative to epithelial cells, lymphoid cells are typically smaller and have much less cytoplasm. With this in mind, we assessed the ability of AQUA to discriminate target protein expression in the nucleus versus cytoplasm of MCL cases represented on the TMA. DAB staining patterns of the respective target proteins were used as a reference. DAB staining of c-Myc in the MCL cases demonstrated weak cytoplamsmic staining in many lymphocytes and strong nuclear staining in other lymphocytes. This was accurately reflected in the AQUA results where, in the same tissue core, nuclear AQUA scores were significantly higher than paired cytoplasmic scores (p = 0.03) (Figure 3). Cdc2 is a cyclin dependent kinase that is expressed both in the cytoplasm and nucleus. We found that the higher cytoplasmic expression levels of Cdc2 determined by AQUA (p = 0.0000003) reflected the cytoplasmic predominant DAB staining pattern that was appreciated visually (Figure 3). The nuclear proteins CyclinD1, Ki-67, Mcm2, and p27 all demonstrated distinct nuclear staining by visual inspection of DAB staining. CyclinD1 and p27 showed significantly higher nuclear expression compared to cytoplasmic expression by AQUA (p =0.00001 and p = 0.002, respectively). However, the nuclear proliferation markers Ki-67 and Mcm2 both had the lowest expression levels by AQUA score (Ki-67 range = 8 – 48, Mcm2 range = 51 – 178) and did not demonstrate significant nuclear localization by AQUA (p = 0.12 and p = 0.60, respectively).
Figure 3. Comparison of target protein expression assessed by AQUA within the nuclear compartment and cytoplasmic compartment.
Target protein expression within the nuclear compartment and cytoplasmic compartments of B-cells of each MCL tissue core on the TMA were quantified as paired nuclear and cytoplasmic AQUA scores. Plots depict nuclear and cytoplasmic AQUA scores as dots with pairs from the same tissue core joined by a line. Nuc indicates nuclear; Cyto, cytoplasmic
Correlation of chromagenic staining with AQUA score
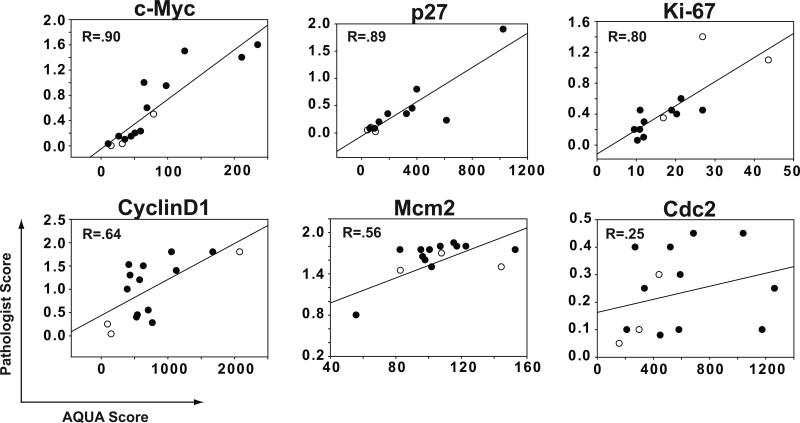
TMA-AQUA is a screening tool for potential biomarkers that, in most cases, will ultimately be assessed by a diagnostic pathologist via chromagenic staining. Accordingly, we assessed the correlation of target protein expression in B-cells represented by the AQUA score (without subcellular localization) with averaged scores of DAB staining assessed by two pathologists as described in Methods. Overall, the correlation between the methods assessed by regression analysis was excellent for c-Myc, p27, and Ki-67 with R = 0.90, 0.89, and 0.80 respectively (Figure 4). Correlation between methods for assessment of CyclinD1 and Mcm2 was good; R = 0.64 and 0.56 respectively, while Cdc2 was poor, R = 0.25. Of all markers tested, scores of DAB staining were the lowest for Cdc2, ranging from 0.05 to 0.45 on a 0 to 2 scale. In addition, three of the MCL cases represented on the TMA were spleen specimens. Spleen samples of MCL frequently render a less homogenous representation of tumor than lymph node samples and can be difficult to score visually. However, these cases (open circles) had a similar distribution on the regression plots as the lymph node cases.
Figure 4. Correlation of target protein expression in MCL assessed by visual scoring of chromagenic staining and by AQUA.
A semi-quantitative scoring system for DAB staining was used where 0 = no staining, 1 = weak staining, and 2 = strong staining. This value was multiplied by an estimation of the percent of stained cells to yield a score of 0 to 2. Scores from each pathologist were averaged between duplicate cores and then between the two pathologists. Correlation (R) was determined regression analysis of average pathologist scores plotted against corresponding AQUA scores. Open circles represent spleen tissue and closed circles represent lymph node tissue.
Correlation of target protein expression with gene expression
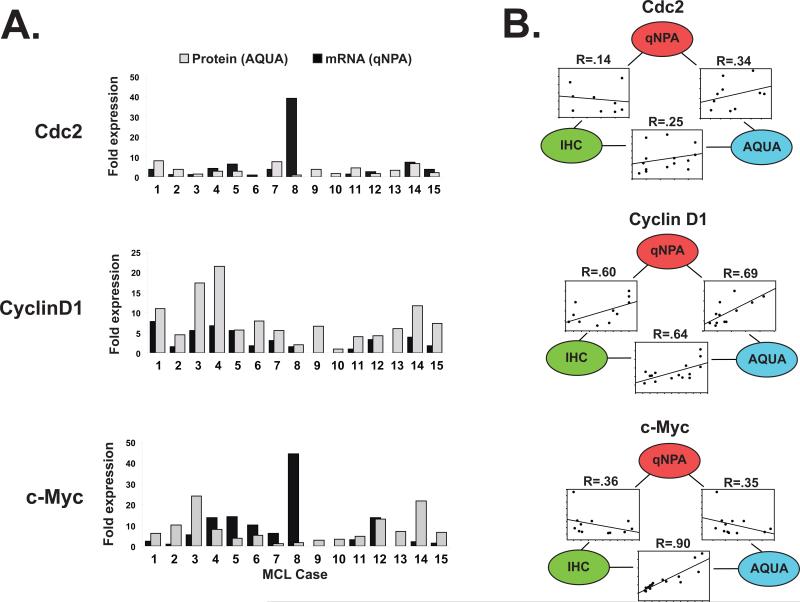
Cognizant that the strongest predictor of survival in patients with MCL is currently the mRNA expression levels of 20 proliferation-associated genes identified through gene expression profiling in a large series of MCL7, screening potential protein biomarkers will be at least in part, guided by the results of gene expression studies. Accordingly, we compared the relative mRNA expression levels of 3 potential biomarkers, CDC2, CCND1, and cMYC, determined by quantitative nuclease protection assay (qNPA™, High Throughput Genomics Inc) to their corresponding relative protein expression level determined by AQUA. Between the MCL cases, CDC2 mRNA and protein expression levels varied up to 40-fold and 8-fold, respectively and showed poor correlation between one another (R = 0.32, Figure 5A and B). cMYC mRNA and protein expression varied up to 44-fold and 24-fold, respectively and also showed poor correlation (R = 0.35). CCND1 mRNA and protein expression varied less between cases, up to 8-fold and 21-fold, respectively and correlated well with one another (R = 0.69). Assessment of target protein expression by semi-quantitative visual scoring demonstrated similar correlation to mRNA expression as AQUA for Cyclin D1 and c-Myc while there was poor correlation between all three methodologies for Cdc2 (Figure 5B).
Figure 5. Correlation of target protein expression with gene expression.
(A) Target protein expression determined by AQUA and represented as fold expression levels (grey bars) are paired with mRNA levels determined by quantitative nuclease protection assay (qNPA) performed on 5μm sections of the corresponding tissue formalin-fixed paraffin-embedded tissue, normalized to two housekeeping genes and represented as fold expression levels (black bars) for 15 cases of MCL. (B) Correlation between gene expression (qNPA) and corresponding protein expression determined by AQUA or visual evaluation of DAB staining (IHC) assessed by regression analysis.
DISCUSSION
The combined use of tissue microarray and automated quantitative assessment of immunofluorescence (TMA-AQUA) has potential to serve as a translational research tool by permitting high-throughput validation of potential protein targets identified in large profiling studies leading to development of these targets as routine immunohistochemical stains that are evaluated by diagnostic pathologists. TMA-AQUA has already demonstrated this capacity in a number of solid tumor cohorts3, 4, 4-6, but to our knowledge, its performance in lymphoid malignancies, whose cytologic and architectural distinction from carcinoma may manifest distinct challenges to TMA-AQUA, has yet to be established. Using a pilot scale TMA comprised of 15 MCL cases and appropriate control tissues, we demonstrate findings that can guide effective utilization of TMA-AQUA as a protein biomarker screening platform for non-Hodgkin lymphoma.
Heterogeneity of target protein expression becomes a concern when tumor is represented by a small core on a TMA. In MCL, expression of proliferation markers are of particular concern because not only can their expression be heterogeneous, they are also the genes whose expression is most predictive of outcome.7 We found that protein expression determined by AQUA score from duplicate cores drilled from different locations on MCL specimens correlated well with one another, including the proliferation marker Ki-67. This suggests that heterogeneity in expression may not be a significant issue in MCL, however, focal areas of increased expression may not have been adequately sampled by our methods. We do demonstrate that duplicate cores do not provide a significant advantage over a single core TMA in accounting for location-dependent expression of markers in MCL.
Using a known diagnostic biomarker for MCL, Cyclin D1, we validated both the TMA-AQUA platform and the MCL cases on the TMA by showing the AQUA score representing Cyclin D1 expression in the B-cells was significantly higher in the MCL cases than non-MCL controls. Figure 2 also demonstrates an advantage of continuous scale quantification. A clear difference between AQUA scores for Cyclin D1 in MCL and non-MCL cases is apparent, suggesting that for markers that need binary classification, a cut-off value for positive expression of a target can be established.
The ability to localize protein expression to the nuclear or cytoplasmic compartments is unique to AQUA and can yield particular advantages. Not only could effects of non-specific staining be reduced by confining analysis to the pertinent subcellular compartment only, but atypical localization patterns of target proteins can also be assessed for clinical significance. We found that TMA-AQUA performed on MCL cases could accurately quantify nuclear versus cytoplasmic expression for targets that have high levels of expression, but failed to do so for the targets that had low levels of expression (Ki-67 and Mcm2 in Figure 3). Accordingly, before initiating analysis of subcellular compartment specific protein expression levels, each marker, especially those with low levels of expression, needs to be validated for compartment specificity.
For most of the markers tested, AQUA scores correlated well with semi-quantitative scoring of DAB staining performed by two pathologists, supporting the idea that prognostic markers identified from TMA-AQUA screening can be successfully developed into DAB stains that are sufficiently quantifiable by diagnostic pathologists. Of the six proteins assessed, the only one that did not achieve a good correlation between AQUA score and DAB scoring was Cdc2, the protein that had the lowest range in DAB scoring (Figure 4). This case is illustrative of situations where the sensitivity of AQUA to small differences in protein expression levels could not be sufficiently reproduced by semi-quantitative scoring of DAB staining.
Not surprisingly, we found that the correlation of gene expression with protein expression varied considerably (Figure 5), underscoring the fact that selecting protein targets based on results of gene expression profiling studies carries few guarantees. However, without reliable protein profiling studies to turn to at the present time and left with long lists of prognostic mRNA targets that likely won’t translate into protein markers, TMA-AQUA at least offers a high-throughput approach to this problem.
In summary, we find that despite challenges posed by particular cytologic and architectural features of non-Hodgkin lymphoma, TMA-AQUA has the capability to serve as a high-throughput screening platform for the validation of potential protein biomarkers to advance their development as routine immunohistochemical stains, thereby addressing a large translational gap in risk-stratification of patients with lymphoma.
ACKNOWLEDGMENTS
The authors thank Thomas Pier and Michelle Waknitz for their technical assistance. This work was supported by funding from Forward Lymphoma / University of Wisconsin Carbone Cancer Center.
REFERENCES
- 1.Camp RL, Chung GG, Rimm DL. Automated subcellular localization and quantification of protein expression in tissue microarrays. Nat Med. 2002;8:1323–1327. doi: 10.1038/nm791. [DOI] [PubMed] [Google Scholar]
- 2.Jubb AM, Landon TH, Burwick J, et al. Quantitative analysis of colorectal tissue microarrays by immunofluorescence and in situ hybridization. J Pathol. 2003;200:577–588. doi: 10.1002/path.1371. [DOI] [PubMed] [Google Scholar]
- 3.Warren M, Twohig M, Pier T, et al. Protein expression of matriptase and its cognate inhibitor HAI-1 in human prostate cancer: a tissue microarray and automated quantitative analysis. Appl Immunohistochem Mol Morphol. 2009;17:23–30. doi: 10.1097/PAI.0b013e31817c3334. [DOI] [PubMed] [Google Scholar]
- 4.Rubin MA, Zerkowski MP, Camp RL, et al. Quantitative determination of expression of the prostate cancer protein alpha-methylacyl-CoA racemase using automated quantitative analysis (AQUA): a novel paradigm for automated and continuous biomarker measurements. Am J Pathol. 2004;164:831–840. doi: 10.1016/s0002-9440(10)63171-9. [DOI] [PMC free article] [PubMed] [Google Scholar]
- 5.Harigopal M, Heymann J, Ghosh S, Anagnostou V, Camp RL, Rimm DL. Estrogen receptor co-activator (AIB1) protein expression by automated quantitative analysis (AQUA) in a breast cancer tissue microarray and association with patient outcome. Breast Cancer Res Treat. 2009;115:77–85. doi: 10.1007/s10549-008-0063-9. [DOI] [PubMed] [Google Scholar]
- 6.Giltnane JM, Molinaro A, Cheng H, et al. Comparison of quantitative immunofluorescence with conventional methods for HER2/neu testing with respect to response to trastuzumab therapy in metastatic breast cancer. Arch Pathol Lab Med. 2008;132:1635–1647. doi: 10.5858/2008-132-1635-COQIWC. [DOI] [PubMed] [Google Scholar]
- 7.Rosenwald A, Wright G, Wiestner A, et al. The proliferation gene expression signature is a quantitative integrator of oncogenic events that predicts survival in mantle cell lymphoma. Cancer Cell. 2003;3:185–97. doi: 10.1016/s1535-6108(03)00028-x. [DOI] [PubMed] [Google Scholar]
- 8.Camp RL, Dolled-Filhart M, King BL, Rimm DL. Quantitative analysis of breast cancer tissue microarrays shows that both high and normal levels of HER2 expression are associated with poor outcome. Cancer Res. 2003;63:1445–1448. [PubMed] [Google Scholar]


