Abstract
The number of Diabetes patients has risen in both the developing and the developed nations. It is associated with lot complications retinopathy, nephropathy, neuropathy etc. Diabetic retinopathy is one of the leading causes of preventable blindness. Diabetic patients have to be monitored at regular intervals to detect any signs of retinopathy and deterioration of vision and timely intervention. This requires lot of time and cost both on the part of the patient and the specialist. Therefore there is a need to differentiate the ‘ high risk ’ patients from the ‘ low risk ’ patients, so that the high risk ones can be managed more rigorously while the low risk patients can be referred for less frequent screenings and checkups. Data of around 100 patients with Grade 1 retinopathy was collected. Their physiological parameters with their DR grading after 3 years was recorded. Physiological parameters which were having a higher impact on the course of Retinopathy were taken (e.g. Mild blood urea, Hypertension and Smoking in this case). Transition probabilities of going from one stage to other were calculated. Probability of having a single physiological parameter in a given stage of DR at a given point of time was calculated. Probability of various combinations of these physiological parameters in a given stage of disease was calculated. Then by knowing the present stage of that disease future stage (3 years later in this case) of the disease can be predicted. Based on these predictions, the ‘ high risk ’ patients are differentiated from the ‘ low risk ’ patients and are accordingly referred for screenings and interventions.
Keywords: Diabetic Retinopathy (DR), Probability, physiological parameters, prediction, high risk
Background
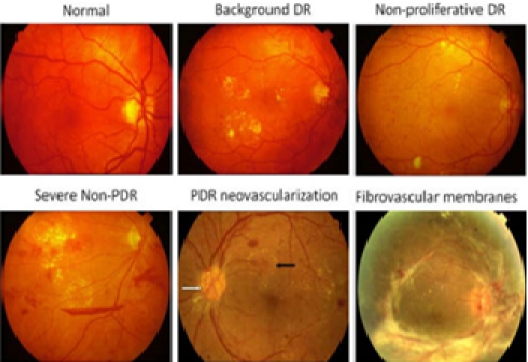
Diabetic Retinopathy (see Figure 1) is the leading cause of preventable blindness. Owing to increased number of diabetes cases in the country, there is an increased burden on the specialists for screening and treating such patients. Since the course of the disease is affected by the existing physiological parameters of the patients, hence there is a need to make a prediction to differentiate the high risk cases from the low risk patients so that the specialist can prioritize there treatment and hence divert the limited resources to the treatment of those who need them more urgently
Figure 1.

Different Stages of Diabetic Retinopathy1
Following are the physiological factors which have been reported to affect the course of Diabetic Retinopathy, [9]. (1) Blood urea levels [2], (2) Blood hemoglobin level [3], (3) Hypertension [2] [4], (4) Antihypertensive drugs [5], (5) Smoking [3] [6], (6) Obesity (Body Mass Index) [4], (7) Blood sugar levels [5] [8], (8) Blood lipid levels [9], (9) Lipid lowering therapy, (10) Cardiovascular strokes history, yes OR no, (11) Chronic inflammation history, yes OR no, (12) Renal dysfunction-blood creatinine levels, (13) Duration of disease [6], (14) Age [7].
Various studies have shown that modification of risk factors (e.g., increased physical activity, reduction in weight) or some institution of treatment (e.g., diabetes and antihypertensive medications) may improve retinal vascular measures and might lower risks of diabetes, hypertension, and their associated complications [8]. Tight glycemic and blood pressure control remains the cornerstone in the primary prevention of DR. Pan- retinal and focal retinal laser photocoagulation reduces the risk of visual loss in patients with severe DR and macular edema, respectively [9].
In this case we have considered 3 factors, namely Blood urea levels, Hypertension, and Smoking. These factors have been highly reported to affect the progress of Diabetic Retinopathy.
Methodology
Data Acquisition
Collection of medical data/history of patients like Age, Duration disease, Hypertension, Antihypertensive drugs, Smoking, Obesity (BMI), Blood sugar levels, Blood lipid levels, Lipid lowering therapy, Cardiovascular strokes history y/n, Chronic inflammation history, y/n, Renal dysfunction Blood creatinine levels, Blood urea levels, Blood hemoglobin levels from an authentic medical institute(A private eye clinic in our case).
Classification of the patients into four stages of disease (categories) like 1 for mild, 2 for moderate, 3 for severe, 4 for proliferative (Standard classification by the Ophthalmologists was followed)
Data Cleaning, Normalization, category Identification
Data for around 100 patients were taken; All the patients were starting with Grade 1 DR; Their physiological parameters were recorded; Their DR grading after 3 years were recorded; DR Gradings were followed as per the Specialists evaluation.
Prediction
Probability based approach was taken and probabilities of the selected physiological parameters (Raised Blood Urea Levels, Hypertension and Smoking) were calculated at a given time and based on that Grade of DR was predicted(after 3 years in this case). Platform used : Windows; Technology used : MATLAB 2008b , C++.
Results and Discussion
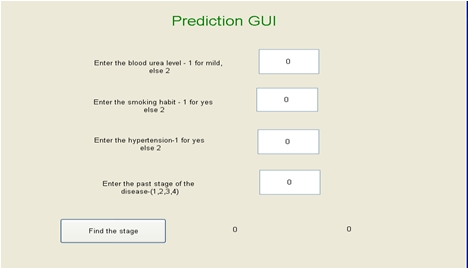
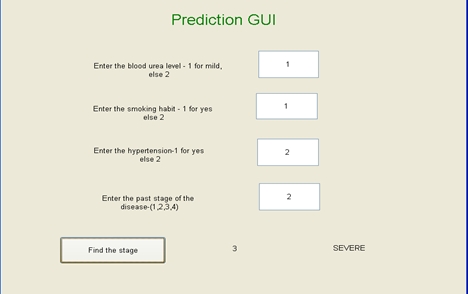
[1]An approach of probability is being used. [2] 1st matrix consists of the transition probability (see Table1) of going from one stage of Diabetic Retinopathy to another to other (calculated from the recorded data). [3]The probability of having a particular physiological parameter is considered e.g. blood urea level which is taken into consideration here (Table 2, seesupplementary material): So, another matrix consists of Probability P (x i | q i) of having Raised blood urea level (x i = true) based on the stage q i on some day I - Probabilities of combinations of the different physiological parameters at different Stages of Diabetic Retinopathy were calculated (see Table 3). [4] Probability of all 3 physiological parameters coexisting in a given stage of Diabetic Retinopathy was calculated (see Table 4). [5] Then by knowing the observations of the patient and his present stage, future stage of the disease can be calculated (see supplementary material). [6] Stage having the maximum likelihood will be the result. Example: If the observation is blood urea level (p) = yes(1) and let say stage (s) is 1. L (s 2 = 1 | s 1 =1, p=1) = P (s 2 =1 | s 1 =1) * P (p=1 | s 2 =1); Similarly we can calculate likelihood for other 3 stages, whichever is greater will be the result.
If the observation is blood urea level(p)=no(2) and smoking(q)=yes and let say stage (s) is 1 then L (s 2 = 1 | s 1 =1, p=2, q= 1) = P (s 2 =1 | s 1 =1) * [P (p=2 | s 2 =1) + P (q=1 | s 2 =1)], And the process will be same as before. [7] A Graphical User Interface has been created where the presence or absence of a particular parameter can be entered and the probability of the stage of DR after 3 years can be predicted (see Figure 2&Figure 3 ). [8] Results obtained when tested on a known data had an accuracy of 70%.
Figure 2.

Graphical User Interface for predicting the Stage of DR with the given Physiological parameters
Figure 3.

GUI showing the predicted stage
Conclusion
Diabetic Retinopathy is a leading cause of preventable blindness. Regular screenings and timely interventions can go a long way in controlling DR related blindness. Differentiating ‘ High Risk ’ (Grade3&4) patients from ‘Low Risk ’ (Grade1&2) patients can go a long way in reducing time and cost both on the part of the Specialist and the patient.
Here a probability based approach to predict the high risk patients depending on their associated physiological parameters has been discussed. The prediction had an accuracy of 70%. There is however scope to further improve the prediction: [1]Results can be further improved by increasing the size of dataset. [2]Some more physiological parameters can be considered. [3]Some other approach like SVM_HMM or Artificial Neural Network can be applied. [4] Time span of the data can be increased (>3 years) to observe a wider range of the course of the disease.
Author ' s Contribution
Prediction of the stage of Diabetic Retinopathy of the patient based on the given associated physiological parameters, thus differentiating high risk patients from the low risk ones. Hence the High risk patients can be kept under a close supervision and the low risk patients can be called for less frequent screenings thus prioritizing treatment and also reducing cost and burden on the specialists.
Supplementary material
Acknowledgments
I would like to thank the Director of IIIT for providing me the financial support to carry on my research work and Netra Eye Centre, Lucknow for sharing their data to make this work feasible.
Footnotes
Citation:Tripathi et al; Bioinformation 5(5): 198-201 (2010)
References
- 1. www.ocular-angiogenesis.nl.
- 2.Longo- Mbenza b, et al. Int J Diabetes&Metabolism. 2008;16:17. [Google Scholar]
- 3.Hjollund. E, Nielsen MM. Lancet. 1978;2:533. doi: 10.1016/s0140-6736(78)92267-5. [DOI] [PubMed] [Google Scholar]
- 4.El-Hifnawy MAM, et al. Saudi J Ophthalmol. 1992;6:3. [Google Scholar]
- 5.Wong TY, et al. Lancet. 2008;371(9614):736. doi: 10.1016/S0140-6736(08)60343-8. [DOI] [PMC free article] [PubMed] [Google Scholar]
- 6.Erasmus RTI, et al. East Afr Med J. 1989;66:248. [PubMed] [Google Scholar]
- 7.Agardh E, et al. Diabet Med. 1994;11:273. doi: 10.1111/j.1464-5491.1994.tb00271.x. [DOI] [PubMed] [Google Scholar]
- 8.Klein BK, et al. Arch Ophthalmol. 1995;113:601. doi: 10.1001/archopht.1995.01100050069033. [DOI] [PubMed] [Google Scholar]
- 9. Mohamed Q, et al. JAMA. 2007;298(8):902. doi: 10.1001/jama.298.8.902. [DOI] [PubMed] [Google Scholar]
Associated Data
This section collects any data citations, data availability statements, or supplementary materials included in this article.


