

Abstract
Purpose
Fundus autofluorescence (FAF) imaging has been shown to be helpful in predicting progression of geographic atrophy (GA) secondary to age-related macular degeneration (AMD). We assess the ability of FAF imaging to predict rate of GA progression using a simple categorical scheme.
Methods
Subjects with GA secondary to AMD with FAF imaging acquired at least 12 months apart were included. Rim area focal hyperautofluorescence (RAFH) was defined as percentage of the 500 µm-wide margin bordering the GA that contained increased autofluorescence. RAFH on baseline FAF images was assessed and categorized depending on the extent of RAFH (category 1: ≤33%, category 2: between 33% and 67%, category 3: ≥67%). Total GA areas at baseline and follow-up were measured to calculate change in GA progression.
Results
Forty-five eyes of 45 subjects were included; average duration of follow-up was 18.5 months. Median growth rates differed among categories of baseline RAFH (p = 0.01 among categories 1,2,3; p = 0.008 for category 1 compared with category 3, Jonckheere-Terpstra Test).
Conclusion
A simple categorical scheme which stratifies amount of increased autofluorescence in the 500 µm margin bordering GA may be used to differentiate faster and slower progressors.
Keywords: Geographic atrophy, fundus autofluorescence, age-related macular degeneration
Introduction
Geographic atrophy (GA), the advanced form of non-neovascular age-related macular degeneration (NNVAMD), is a leading cause of irreversible vision loss in the United States. GA is characterized by loss of the retinal pigment epithelium (RPE), overlying photoreceptors and underlying choriocapillaris. A progressive increase in the amount of lipofuscin in the RPE is a major pathological characteristic associated with NNVAMD. Although some lipofuscin accumulation is a normal age-associated process, accelerated accumulation of RPE lipofuscin has been reported in NNVAMD and in Stargardt’s disease. The primary fluorescent and toxic compound identified in RPE lipofuscin is N-retinylidene-N-retinylethanolamine (A2E), which is derived from retinoid byproducts. 1 There is evidence that A2E is responsible for significant phototoxicity via singlet oxygen generation,1 an increase in RPE plasma membrane permeability,1 complement activation,2 as well as alterations in cholesterol metabolism.3
Fundus autofluorescence (FAF) imaging allows for monitoring of lipofuscin in vivo. Delori and colleague used in vivo and ex vivo spectrophotometric analysis to demonstrate that the dominant fundus fluorophore is RPE lipofuscin.4 Fundus fluorescence has a peak emission at 630 nm, with optimal excitation at 510 nm.4 Loss of autofluorescence of the RPE can be used to precisely identify atrophic areas in the macula, and increased FAF may precede the enlargement of preexisting atrophy and the development of new atrophy over time.5 FAF has recently emerged as an alternative to color fundus photos (CFP) for evaluating the extent of GA secondary to NNVAMD. Several investigators have documented the utility of FAF for measuring GA growth.5–7 Past studies have correlated qualitative patterns of increased autofluorescence on FAF imaging with risk of disease progression.7–9 However, the previous classification schemes were given descriptive terms, and there was some overlap among the separate categories; this made grading difficult to replicate. A simplified scale is greatly needed.
The large number of new clinical trials evaluating therapies for GA has increased the need for accurate means of monitoring and predicting GA progression. By evaluating risk for disease progression, FAF imaging could help differentiate eyes that progress slowly from those that progress rapidly, and thus enable smaller trials with shorter duration and enhanced power. In this study, we assess the ability of FAF imaging to predict the rate of GA progression by using a simple categorical scheme.
Materials and Methods
Data Source
This study was approved by the Duke University Medical Center Institutional Review Board and was compliant with the Health Insurance Portability and Accountability Act (HIPAA). Subjects with GA secondary to NNVAMD with baseline and follow-up FAF images acquired at least 12 months apart at the Duke Eye Center between 1/1/2005 and 1/14/2008 were identified. Eyes were included if they had no previous history of choroidal neovascularization or other macular disease. Image quality was determined based on visibility of vascular detail and documented as poor, fair, or good (SB). Eyes were excluded if the images were of poor quality, if the GA extended beyond the margins of the image, or there was a history of myopia greater than 6 diopters spherical equivalent. Demographic data such as age, gender, smoking status (past/current vs. none) and use of antioxidant supplementation was recorded. Data was recorded as missing if not noted in the subject’s medical record.
Image Acquisition
The HRA2 (Heidelberg Retina Angiograph 2, Heidelberg Engineering, Germany) was used to acquire the FAF images. Standard protocol for image acquisition involved excitation at 488 nm with an optically pumped solid-state laser, and emission detected above 500 nm with a barrier filter. Typically 9–15 images are averaged to acquire a mean image at our institution. Either the Automatic Real Time (ART) mode or the mean image mode was used for all FAF image acquisition. These modes allow for an amplified signal with reduced noise for each image.
Grading Technique
Two graders (SB, SWC) categorized the extent of increased autofluorescence [termed rim area focal hyperautofluorescence (RAFH)] in the 500 µm perimeter bordering the GA into 3 categories (Figure 1). The rationale for using a 500 µm rim was this allowed for adequate assessment of increased autofluorescence in the margin around the GA without resulting in much overlap between adjacent areas of GA. Eyes with RAFH less than 33% of the 500 µm margin surrounding the GA were assigned to category 1. Eyes with RAFH greater than 33% but less than 67% were assigned to category 2, and eyes with RAFH greater or equal to 67% were assigned to category 3. If there were multiple patches of GA, the overall amount was taken into consideration for classification. This technique of estimating RAFH was intended to simulate image evaluation in a clinical setting prior to enrollment in a study. This was performed for baseline and follow-up images with graders masked to the corresponding (baseline or follow-up) image for each eye.
Figure 1.

Examples of the 3 categories of rim area focal hyperautofluorescence (RAFH) used in our study. In category 1 (a), ≤ 1/3 of the 500 µm zone bordering the geographic atrophy (GA) had increased autofluorescence. For category 2 eyes (b), between 1/3 and 2/3, and in category 3 (c), ≥ 2/3 of this area had increased autofluorescence.
Two separate graders (DEL, AAK) calculated total GA area on the digital images using the Heidelberg imaging analysis software (Figures 2 and 3). Each grader used a computer mouse to manually trace all areas of GA within the vascular arcades. GA was recognized as well-demarcated black areas corresponding to dead or absent retinal pigment epithelium (RPE). Peripapillary atrophy was included in the tracing only if it was confluent with macular GA. Areas of intact autofluorescence within GA were also traced, but with a different color to signify sparing of RPE. Areas of atrophy smaller than 0.02 mm2 were excluded. Graders assessing total GA area were masked to each other. The Heidelberg imaging analysis software automates conversion of pixels to mm2 based on the magnification factors of the imaging device. Total GA for each baseline and follow-up image was calculated by summing all the areas of GA and subtracting demarcated areas of sparing.
Figure 2.

Example of fundus autofluorescence (FAF) grading in eye with geographic atrophy (GA) in category 1 of rim area hyperautofluorescence (RAFH) followed for 26 months. The top row has baseline images, and the bottom row has follow-up images. The left column contains non-graded images, the middle column is grader 1, and the right column is grader 2. The area of GA is outlined in green. The calculated growth of GA area was small: 0.80 mm2 and 0.86 mm2, for graders 1 and 2 respectively.
Figure 3.

Example of using fundus autofluorescence (FAF) imaging in eye with geographic atrophy (GA) in a category 3 eye followed for 21 months. The top row has baseline images, and the bottom row has follow-up images. The left column contains non-graded images, the middle column is grader 1, and the right column is grader 2. The area of GA is outlined in green, and spared areas within GA are outlined in magenta. The calculated growth of GA area was large: 6.2 mm2, and 4.79 mm2, for graders 1 and 2 respectively.
Data Analysis
All descriptive, frequency, and correlation statistics were performed using SAS (version 8.1, Cary, NC).
Results
Of 65 patients that had a diagnosis of GA secondary to NNVAMD and FAF acquired at least 12 months apart, 6 medical records could not be located. Fourteen were eliminated based on poor image quality at either baseline or follow-up. The reasons for limited quality included dry eyes, lens opacity, and photographer error in acquisition. Forty-five eyes of 45 subjects met the inclusion criteria of the study. Of the total 90 baseline and follow-up images, 13 (14%) were taken in the ART mode, and 77 (86%) were acquired in the mean image mode. Baseline demographics are listed in Table 1. The mean duration of follow-up was 18.5 months (minimum 12 months, maximum 26 months). Number of exams during the study period varied from 0–16 follow-ups, with varying intervals depending on status of non-study eye. Average age was 77.4 years. Agreement between graders measuring extent of GA on FAF was high (baseline images 0.99, follow-up images 0.98; intraclass correlation). Median increase in GA size for all eyes was 1.49 mm2/year [range 0.01 mm2/year – 7.35 mm2/year, standard deviation (SD) 1.49 mm2/year].
Table 1.
Baseline demographic and descriptive data
| Variable | Frequency | Percent |
|---|---|---|
| Female | 24 | 53% |
| Eye (OS) | 23 | 51% |
| Smoker (past or current) | 20 | 44% |
| AREDS supplementation (baseline) | 38 / 44 | 86% |
| Pseudophakic (baseline) | 30 | 67% |
| Good FAF image quality at baseline | 30 | 67% |
| Good FAF image quality at follow-up | 30 | 67% |
OS = left eye; AREDS = Age-related Eye Disease Study; FAF = fundus autofluorescence
Percentages are based on 45 patients unless otherwise noted.
The number of eyes in categories 1, 2, and 3 was 21, 13, and 11, respectively. The median GA growth rate for categories 1, 2, and 3 of RAFH was 0.064 mm2/month, 0.146 mm2/month, and 0.143 mm2/month, respectively (or per year, 0.77, 1.75, and 1.72 mm2/year respectively). Growth rates for each category are represented graphically in Figure 4. Median growth rates differed among categories of baseline RAFH (p = 0.01 among categories 1,2,3; p = 0.008 for category 1 compared with category 3, Jonckheere-Terpstra Test).
Figure 4.
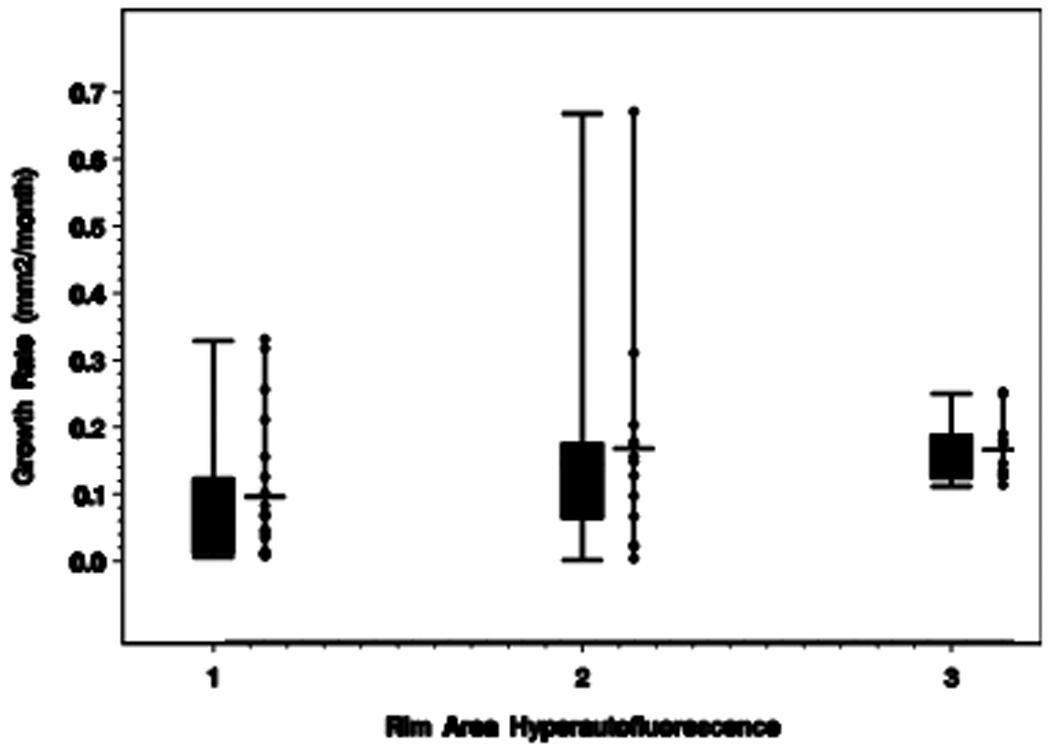
Box plot and adjacent scatterplot of median growth rates for each category of rim area focal hyperautofluorescence (RAFH).
In a subset analysis, category 1 (21 eyes) was subdivided into eyes without any RAFH (12 eyes, 57%) and those with some RAFH (9 eyes, 43%). Those eyes without any RAFH (0.03 mm2/month) had significantly slower progression compared to those with some RAFH (0.10 mm2/month; p = 0.02, Jonckheere-Terpstra Test). Table 2 summarizes progression rates for each category.
Table 2.
Growth rates of geographic atrophy (GA) by category of rim area focal hyperautofluorescence (RAFH)
| Category RAFH |
N | Mean Growth Rates (mm2/month) |
Median Growth Rates (mm2/month) |
Standard Deviation (mm2/month) |
|---|---|---|---|---|
| 1a: none | 12 | 0.05 | 0.03 | 0.07 |
| 1b: some | 9 | 0.15 | 0.10 | 0.11 |
| 1: total | 21 | 0.094 | 0.064 | 0.101 |
| 2 | 13 | 0.165 | 0.146 | 0.173 |
| 3 | 11 | 0.164 | 0.143 | 0.049 |
N = number of eyes.
Category 1 is subdivided into eyes with none (1a) versus some (1b) increased autofluorescence.
Smoking (past/current versus never) did not influence median growth rates (p = 0.63, Wilcoxon Rank Sum Test), nor did use of antioxidant supplementation per the Age-Related Eye Disease Study [AREDS, p = 0.41, Wilcoxon Rank Sum Test]. 30 of 45 eyes (67%) had the same category of RAFH noted at follow-up as at baseline. 44 of 45 eyes (98 %) were within 1 category of RAFH at follow-up compared with baseline (ie, only 1 eye was category 3 at baseline and category 1 at follow-up).
Comment
Using a simple categorical scheme to group eyes with varying amounts of RAFH, we demonstrated that eyes with a larger area of initial rim hyperautofluorescence (categories 2 and 3) had a faster increase in size of GA during the follow-up interval compared to eyes with a smaller amount of baseline rim hyperautofluorescence (category 1). The subset analysis within category 1 compared eyes without any RAFH to those with minimal RAFH, and indicated a significantly slower growth rate in eyes without any RAFH. For this reason, in future trials a specific cutoff for amount of increased autofluorescence may be considered (ie, presence of increased FAF in margin, or > 5% of margin with increased FAF). Given however that this is a relatively small sample size (45 eyes), further studies are needed.
Since increased autofluorescence in the margin around GA is believed to reflect increased lipofuscin content, our observations are physiologically plausible.4 Another plausible explanation for increased autofluorescence signal includes hypertrophy of RPE cells, demonstrated by thickening at the level of the RPE by spectral domain optical coherence tomography (SDOCT).10 Histologic studies also support the engorgement of RPE cells with lipofuscin and melanolipofuscin, and phagocytosis of neighboring RPE cells.11
Previous researchers have reported various factors are associated with increased rate of GA progression.6–7,12–13 Schmitz-Valckenberg et al suggested that eyes with more hyperautofluorescence bordering the GA had more rapid enlargement of GA.6 Using qualitative patterns on FAF, Holz demonstrated faster median rates of progression for diffuse patterns (1.77 mm2/year) of autofluorescence and slower rates for eyes with focal patterns (0.81 mm2/year) or eyes without any hyperautofluorescence (0.38 mm2/year).7 Interestingly, using a semiautomated technique in 8 eyes, Hwang et al reported no association between location of increased FAF and location of GA enlargement (ie, increased FAF does not correspond with exact location of GA enlargement.)14 While the exact location of increased FAF may not correspond with location of GA enlargement, our study has a larger sample size and does suggest that an overall increase in the amount of FAF relates to rate of progression.
Another factor that has been reported to be associated with rate of GA progression is baseline GA area. Sunness et al suggested that GA growth rates is dependent on baseline GA area,12–13 however Holz did not confirm this.7 The AREDS study group demonstrated with retrospective analysis that GA often follows a specific sequence of events: drusen formation, hyperpigmentation, drusen regression, hypopigmentation, and development of GA.15 Although this sequence may help in predicting formation of GA, it does not help in predicting rate of GA progression.
Holz and colleagues reported a median growth rate of 1.52 mm2/year in 195 eyes using FAF imaging.7 Sunness et al reported a median GA enlargement rate of 2.1 mm2/year in 212 eyes of 131 subjects using CFP imaging.13 These previously documented growth rates are similar to median rates measured in our study.
Our study suggests that baseline RAFH could be a useful predictor of GA progression. When designing a clinical trial, selecting for patients with likely rapid progression would enable a smaller trial with shorter duration. Grouping eyes into a simple categorical scheme based on extent of RAFH may be more reproducible than determining pattern7,16 of autofluorescence.
Acknowledgments
This work has been supported by NEI 1K23 EY018895-01 and NIH P30-EY005722 Core Grant for Vision Research.
Footnotes
Publisher's Disclaimer: This is a PDF file of an unedited manuscript that has been accepted for publication. As a service to our customers we are providing this early version of the manuscript. The manuscript will undergo copyediting, typesetting, and review of the resulting proof before it is published in its final citable form. Please note that during the production process errors may be discovered which could affect the content, and all legal disclaimers that apply to the journal pertain.
Presented in part at: Retinal Degenerations Meeting, International Congress of Eye Research (ICER; Chengdu, China) September, 2008.
Competing Interests and Funding:
The authors have no proprietary interest in any aspect of this report.
References
- 1.Sparrow JR, Fishkin N, Zhou J, et al. A2E, a byproduct of the visual cycle. Vision Res. 2003;43:2983–2990. doi: 10.1016/s0042-6989(03)00475-9. [DOI] [PubMed] [Google Scholar]
- 2.Zhou J, Jang YP, Kim SR, Sparrow JR. Complement activation by photooxidation products of A2E, a lipofuscin constituent of the retinal pigment epithelium. Proc Natl Acad Sci USA. 2006;103:16182–16187. doi: 10.1073/pnas.0604255103. [DOI] [PMC free article] [PubMed] [Google Scholar]
- 3.Lakkaraju A, Finnemann SC, Rodriguez-Boulan E. The lipofuscin fluorophore A2E perturbs cholesterol metabolism in the retinal pigment epithelial cells. Proc Natl Acad Sci USA. 2007;104:11026–11031. doi: 10.1073/pnas.0702504104. [DOI] [PMC free article] [PubMed] [Google Scholar]
- 4.Delori FC, Dorey CK, Staurenghi G, et al. In vivo fluorescence of the ocular fundus exhibits retinal pigment lipofuscin characteristics. Invest Ophthalmol Vis Sci. 1995;36:718–729. [PubMed] [Google Scholar]
- 5.Holz FG, Bellman C, Staudt S, et al. Fundus autofluorescence and development of geographic atrophy in age-related macular degeneration. Invest Ophthalmol Vis Sci. 2001;42:1051–1056. [PubMed] [Google Scholar]
- 6.Schmitz-Valckenberg S, Bindewald-Wittich A, Dolar-Szczasny J, et al. Correlation between the area of increased autofluorescence surrounding geographic atrophy and disease progression in patients with AMD. Invest Ophthalmol Vis Sci. 2006;47:2648–2654. doi: 10.1167/iovs.05-0892. [DOI] [PubMed] [Google Scholar]
- 7.Holz FG, Bindewald-Wittich A, Fleckenstein M, et al. FAM Study Group. Progression of geographic atrophy and impact of fundus autofluorescence patterns in age-related macular degeneration. Am J Ophthalmol. 2007;143:463–472. doi: 10.1016/j.ajo.2006.11.041. [DOI] [PubMed] [Google Scholar]
- 8.Lois N, Owens SL, Coco R, et al. Fundus autofluorescence in patients with age-related macular degeneration and high risk of vision loss. Am J Ophthalmol. 2002;133:341–349. doi: 10.1016/s0002-9394(01)01404-0. [DOI] [PubMed] [Google Scholar]
- 9.Einbock W, Moessner A, Schnurrbusch UE, et al. Changes in fundus autofluorescence in patients with age-related maculopathy. Correlation to visual function: a prospective study. Graefes Arch Clin Exp Ophthalmol. 2005;243:300–305. doi: 10.1007/s00417-004-1027-3. [DOI] [PubMed] [Google Scholar]
- 10.Brar M, Kozak I, Cheng L, et al. Correlation between spectral domain optical coherence tomography and fundus autofluorescence at the margins of geographic atrophy. Am J Ophthalmol. 2009;148:439–444. doi: 10.1016/j.ajo.2009.04.022. [DOI] [PMC free article] [PubMed] [Google Scholar]
- 11.Sarks JP, Sarks SH, Killingsworth MC. Evolution of geographic atrophy of the retinal pigment epithelium. Eye. 1988;2:552–577. doi: 10.1038/eye.1988.106. [DOI] [PubMed] [Google Scholar]
- 12.Sunness JS, Gonzalez-Brown J, Applegate CA, et al. Enlargement of atrophy and visual acuity loss in the geographic atrophy form of age-related macular degeneration. Ophthalmology. 1999;106:1768–1779. doi: 10.1016/S0161-6420(99)90340-8. [DOI] [PubMed] [Google Scholar]
- 13.Sunness JS, Margalit E, Srikumaran D, et al. The long-term natural history of geographic atrophy from age-related macular degeneration. Enlargement of atrophy and implications for interventional clinical trials. Ophthalmology. 2007;114:271–277. doi: 10.1016/j.ophtha.2006.09.016. [DOI] [PMC free article] [PubMed] [Google Scholar]
- 14.Hwang JC, Chan JWK, Chang S, Smith RT. Predictive value of fundus autofluorescence for development of geographic atrophy in age-related macular degeneration. Invest Ophthalmol Vis Sci. 2006;47:2655–2661. doi: 10.1167/iovs.05-1027. [DOI] [PMC free article] [PubMed] [Google Scholar]
- 15.Klein ML, Ferris FL, Armstrong J, et al. Retinal precursors and the development of geographic atrophy in age-related macular degeneration. Ophthalmology. 2008;115:1026–1031. doi: 10.1016/j.ophtha.2007.08.030. [DOI] [PubMed] [Google Scholar]
- 16.Bindewald A, Schmitz-Valckenberg S, Jorzik JJ, et al. Classification of abnormal fundus autofluorescence patterns in the junctional zone of geographic atrophy in patients with age related macular degeneration. Br J Ophthalmol. 2005;89:874–878. doi: 10.1136/bjo.2004.057794. [DOI] [PMC free article] [PubMed] [Google Scholar]