Abstract
Stark absorption spectra of peridinin (Per) and five allene-modified analogues and their angular dependence as a function of an externally applied electric field were measured in methyl methacrylate polymer at 77K. In all cases, the energetically lowest absorption band has a significant change of static dipole moment upon photoexcitation (Δμ). In particular, Per has the largest value of |Δμ|. The angles between Δμ and the transition dipole moment of all the analogues were determined. It is suggested that the allene group in Per plays a key role as the electron donor in the charge transfer process following photoexcitation. The results of MNDO-PSDCI calculations support this idea.
Keywords: Stark absorption, angular dependence, intramolecular charge-transfer state, peridinin, allene modified peridinin analogues
1. Introduction
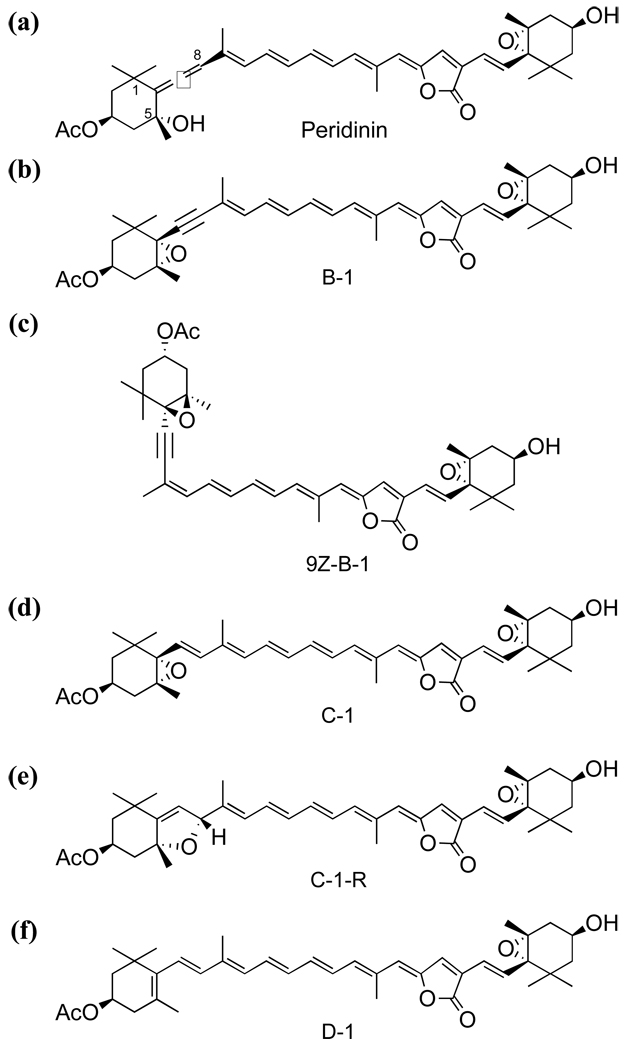
Peridinin (Per) is found in the water-soluble peripheral peridinin-chlorophyll a-protein (PCP), the membrane-associated intrinsic light-harvesting complex of dinoflagellates [1]. In PCP, the efficiency of energy-transfer from Per to chlorophyll a is reported to be higher than 90% [2]. A recent report suggests that this high efficiency may be related to the presence of an intramolecular charge transfer (ICT) state of Per [3]. This state is thought to be associated with the intricate structure of Per (see Fig.1), which has an allene group and a lactone ring within its polyene backbone. Historically, based on the same concept used for polyenes, the singlet excited states of Per have been characterized assuming C2h symmetry [4]. The lowest excited singlet (S1) state is assigned to the 21Ag− state, and the second lowest singlet (S2) state is assigned to the 11Bu+ state. A one-photon induced transition to the S1 state is symmetry forbidden while that to the S2 state is allowed because the ground (S0) state has Ag− character. Frank et al. investigated the solvent dependence of femtosecond transient absorption spectra of carbonyl-containing carotenoids and found the presence of an ICT state (S1-ICT) near in energy to the S1 state [5]. The precise nature of the S1-ICT state remains to be elucidated. According to quantum chemical calculations using time-dependent density functional theory (TDDFT), it is suggested that the S1-ICT state is an electronic state distinct from S1 [6]. On the other hand, the results of semi-empirical molecular orbital calculations using MNDO-PSDCI (Modified Neglect of Differential Overlap with Partial Single- and Double-Configuration Interaction) methods suggest that the ICT and the S1 states are coherently mixed [7]. Some experimental studies using both two-photon absorption spectroscopy and the excitation energy dependence of the pump-probe femtosecond transient absorption spectra support this idea [5,7]. However, other results measuring the solvent dependence of the pump-probe femtosecond transient absorption spectroscopy and the pump-dump-probe spectroscopy support the idea that the states are distinct [8].
Fig. 1.
Chemical structures of (a) Peridinin (Per), (b) 9E-acetylene peridinin (B-1), (c) 9Z-acetylene peridinin (9Z-B-1), (d) epoxyolefin peridinin (C-1), (e) dihydrofuran peridinin (C-1-R), and (f) diolefin peridinin (D-1)
There has also been a suggestion that an S2-ICT state exists. Premvardhan et al. have reported the Stark absorption spectra of Per in organic solvents and found that the S0 → S2 absorption band has large (20 – 30 Debye) static dipole-moment change, |Δμ| [9]. Based on this observation they have suggested that there may be strong dipole-dipole coupling between Per and chlorophyll a in PCP. They believe this is one of the origins of efficient energy-transfer from the S2 state of Per to chlorophyll a. Linden et al. carried out experimental [10] and theoretical [6] studies and found the S2-ICT state close in energy to the one-photon allowed 11Bu+ state. Zigmantas et al. showed that excitation of peridinin to the very red edge of its S0 → S2 absorption generates excited-state dynamics different from that produced after excitation at the absorption maximum [11]. This effect was assigned to excitation of the S2 state of a specific ‘red’ peridinin having a CT character.
The aim of the present study is to investigate the relationship between the chemical structure of Per and its ICT character. We measured the Stark absorption spectra of Per and five allene-modified analogues. The angular dependence of the Stark spectra as a function of the direction of an externally applied electric field was investigated in order to determine the angle between the static dipole-moment change (Δμ) formed upon photoexcitation and the transition dipole moment (M). The experimental observations were compared with the results of theoretical calculations using the MNDO-PSDCI method. The ICT character of Per is found to depend critically on the presence of the allene moiety.
2. Materials and Methods
2.1 Preparation of samples
Fig. 1 shows the chemical structures of Per and analogues. Hereafter, we call these analogues as B-1, 9Z-B-1, C-1, C-1-R, and D-1 for convenience. 9Z-B-1 is a 9Z-isomer of B-1. Both B-1 and 9Z-B-1 are the analogues of Per in which the hydroxyl group attached to C5 was modified to 5,6-epoxide and the allene group was substituted with an acetylene group. C-1 is the analogue of Per in which the hydroxyl group attached to C5 was modified to a 5,6-epoxide and the allene group was substituted with a C=C bond so that this new C=C bond extends the length of conjugation of the conjugated backbone. C-1 has been modified so that the 5,6-epoxide was shifted to form 5,8-position to give C-1-R. D-1 is the analogue of C-1 in which 5,6-epoxide in C-1 was removed.
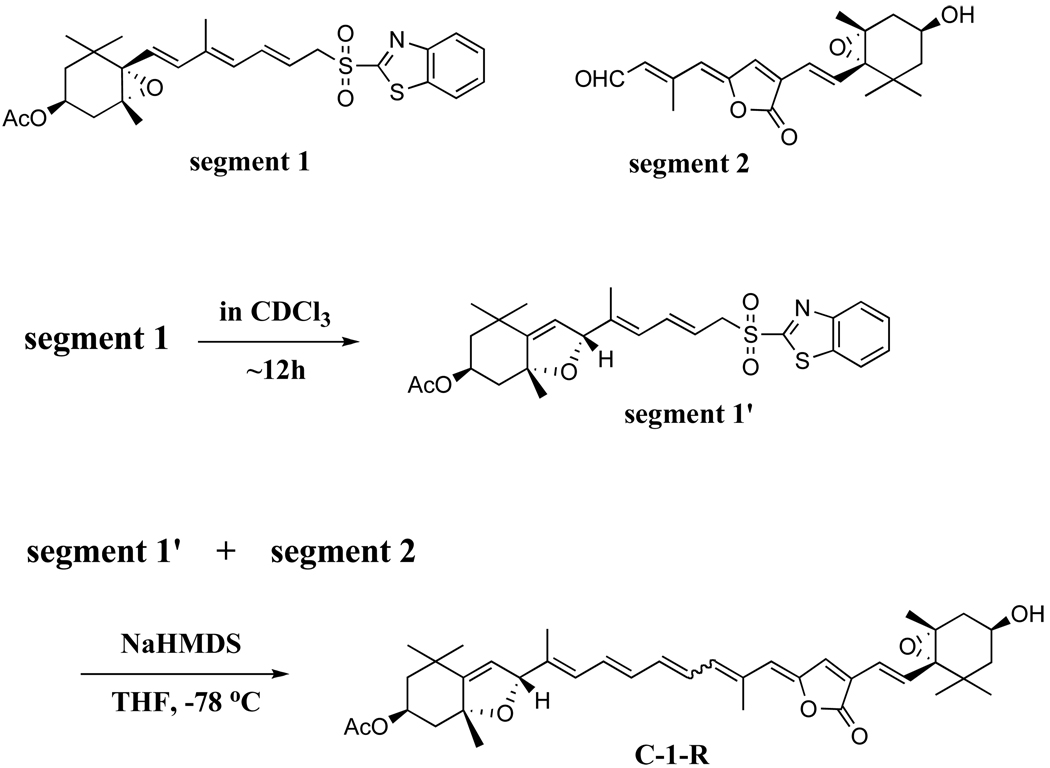
Per and analogues were synthesized according to previously reported methods with slight modifications [12–14]. 9Z-B-1 was purified, following isomerization of B-1, by HPLC [14]. The isomerization was performed by incubating a benzene solution of B-1 for 14 days in an argon atmosphere under room light at room temperature. C-1-R was obtained using the protocol described in Scheme 1. Segment 1 and 2 were synthesized as described in Ref. [14]. Segment 1’ was obtained by the isomerization of Segment 1. The conditions of this isomerization were similar to those described for 9Z-B-1 except that Segment 1 was dissolved in CDCl3. Segment 1’ and Segment 2 were then coupled to produce C-1-R. C-1-R was purified from the synthetic mixture using HPLC. In order to increase the content of the all-trans isomer of C-1-R a similar photoisomerization protocol was applied before the purification.
Scheme 1.
These Per analogues were dispersed isotropically in a methyl methacrylate polymer (PMMA, Wako Pure Chemical Industries Ltd.) at a concentration of 1.3 wt% of PMMA and then subjected to the Stark measurements.
2.2 Stark absorption spectroscopy
Stark absorption spectra were recorded using a setup described previously [15,16]. Briefly, light from a 150-W Xe short-arc lamp (Hamamatsu, L2274) was passed through a monochromator (Acton Research, SpectraPro 150) and used to irradiate the sample cell. The incident radiation was linearly polarized using a Gran-Thompson prism and was guided to the gap between the electrodes on the sample cell. The angle between the electric vector of the incident light and the externally applied electric field was set to 0°, 30°, 54.7° (a magic angle), 70° and 90°. A sinusoidal AC voltage signal with a frequency f = 500 Hz was generated using a function generator (NF, E-1201A). This AC signal was amplified using a bi-polar power amplifier (NF, 4305). The electric field applied between the electrodes could be varied from 60 to 100 kV/cm. The light intensity transmitted through the sample cell was detected using a silicon photodiode (Hamamatsu, S1336-8BQ). The output signal of the photodiode was I/V converted using a preamplifier (NF, LI-76). The DC component of the preamplified signal was recorded on a digital multimeter (Fluke, 45), while the AC component was amplified by using a dual-phase lock-in amplifier (NF, 5610B). Only the changes (ΔI) of the transmitted light intensity (I) with which varied with 2f frequency were selectively amplified by the lock-in amplifier. Since we used a dual-phase (in-phase and quadrature-phase) lock-in detection system, the ΔI signals due to the different origins of the Kerr effect could be distinguished. The monochromator, multimeter, and lock-in amplifier were all computer controlled. The absorbance changes (ΔA) induced by the applied electric field were calculated by using the following equation:
All the Stark measurements were carried out at 77K using a liquid nitrogen cooled cryostat (Oxford, Optistat DN).
2.3 Method of Analysis for Stark absorption spectra
The change of the absorption spectrum, ΔA(ν), where ν is the frequency of incident light, upon application of an externally applied electric field, Eext, can be described as a linear combination of the zero-, first-, and second-order derivatives of the absorption spectrum, A(ν) [17]:
| (1) |
| (2) |
| (3) |
| (4) |
| (5) |
| (6) |
| (7) |
| (8) |
| (9) |
| (10) |
| (11) |
where χ is the angle between the externally applied electric field and the electric vector of incident light at frequency ν, h is Planck’s constant. Symbol M is the transition dipole-moment vector and m is its unit vector. X and Y are the transition dipole-moment polarizability and hyperpolarizability tensors, respectively. Δα and Δμ, respectively, are the changes of polarizability and static dipole-moment upon photoexcitation. Eint and Eext, are the internal and external electric field, respectively. Symbol floc is a local electric field correction factor (Lorentz factor). In this study we used the value of floc ≈ 1.1 for PMMA [18].
2.4 Quantum Chemical Calculations
The ground-state equilibrium geometries and properties of all the Per analogues were calculated using Gaussian 03, B3LYP density functional methods, and a 6-31G(d) basis set [19], followed by a geometry optimization using MOPAC 2002 ver.1.5 with the AM1 Hamiltonian. The excited-state electronic properties of all these samples were calculated using MNDO-PSDCI molecular orbital theory [7,20–25] using AM1 Hamiltonian. We carried out full single and double CI calculations within the eight highest energy filled π orbitals and the eight lowest energy unfilled π orbitals. The output from the molecular orbital calculations was analyzed using the ANAMOL program. The MNDO-PSDCI and ANAMOL programs can be made available by contacting R. R. Birge (rbirge@uconn.edu).
3. Results and Discussion
3.1 Stark absorption spectroscopy
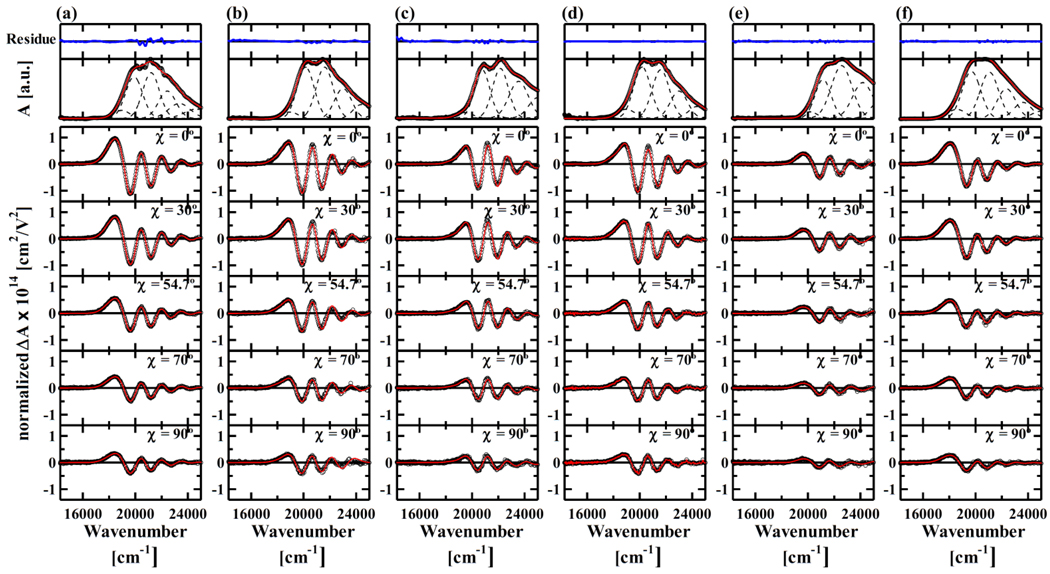
Fig. 2 shows the absorption spectra and Stark spectra, detected at different χ values, of Per and analogues in PMMA at 77K. Per and analogues show structure-less absorption bands at room temperature (data not shown). But by cooling down the temperature to 77 K their vibrational structures can be seen due to suppression of inhomogeneous band broadening at lower temperature. For the purpose of further analysis of Stark absorption spectra, each absorption spectrum was deconvoluted into six Gaussian profiles (see Table 1). This procedure is similar to that has already been reported by Premvardhan et al. [9]. In order to accurately reproduce the absorption band shape, the presence of a small Gaussian profile at the lowest energy position is required in every case (see the residues in Fig. 2). The need to include this small absorption band has also been noted previously [9]. However, when a similar curve fitting procedure is carried out on the absorption spectrum of carotenoids such as β-carotene, which do not have significant CT states, this low-energy small absorption band is not required to fit experimental spectrum [18]. The energy separations of the Gaussian bands 2, 3, 4, 5, and 6 can be readily accounted for by the vibrational progression of the S0 to S2 absorption (see Table 1).
Fig. 2.
Absorption spectra (top) and the χ-dependence of Stark absorption spectra (bottom) of (a) Per, (b) B-1, (c) 9Z-B-1, (d) C-1, (e) C-1-R and (f) D-1 in PMMA at 77K. Open circles show the results of experimental observation. The Stark absorption spectra were normalized against the concentration of the samples in a PMMA film as well as the intensity of applied electric field. Red solid lines show the results of spectral fitting. The absorption spectra of Per and analogues were successfully reproduced with 6 components with Gaussian profile (broken lines in the top panel). Residuals (blue solid lines) after spectral fitting of absorption spectra were also shown in the top panel. The ordinate scale of the residuals is the same with that of absorption spectra. Stark absorption spectra observed at each χ value were fitted using Eq. (1). In order to achieve the best fit it was assumed that each Gaussian component in the corresponding absorption spectrum of the analogues has different Aχ, Bχ, and Cχ values.
Table 1.
Peak energy [cm−1], FWHM (full-width at half maximum) [cm−1], [Å3], |Δμ| [Debye], (m · Δμ)/|Δμ|, θΔμ [degree] of each Gaussian profile of (a) Per, (b) B-1, (c) 9Z-B-1, (d) C-1, (e) C-1-R, and (f) D-1.
| band 1 | band 2 | band 3 | band 4 | band 5 | band 6 | |||
|---|---|---|---|---|---|---|---|---|
| (a) | Peak Energy | 18850 | 19960 | 21370 | 22680 | 24100 | 25470 | |
| FWHM | 1300 | 1400 | 1400 | 1400 | 1400 | 1400 | ||
| −4703 | −2166 | −808 | −551 | −1000 | 0 | |||
| |Δμ| | 20.8 | 0 | 0 | 0 | 0 | 0 | ||
| (m · Δμ)/|Δμ| | 0.999 | / | / | 0.980 | / | / | ||
| θΔμ | 2.6 | / | / | 12 | / | / | ||
| (b) | Peak Energy | 18800 | 21150 | 21600 | 23000 | 24400 | 25800 | |
| FWHM | 1400 | 1400 | 1400 | 1400 | 1400 | 1400 | ||
| −2172 | −1177 | −1181 | −846 | −350 | 0 | |||
| |Δμ| | 17.2 | 11.4 | 0 | 0 | 0 | 0 | ||
| (m · Δμ)/|Δμ| | 0.893 | 0.983 | / | / | / | / | ||
| θΔμ | 27 | 11 | / | / | / | / | ||
| (c) | Peak Energy | 19430 | 20770 | 22160 | 23550 | 25020 | 26350 | |
| FWHM | 1400 | 1400 | 1400 | 1400 | 1400 | 1400 | ||
| −921 | −680 | −767 | −649 | −482 | −162 | |||
| |Δμ| | 11.5 | 8.76 | 0 | 0 | 0 | 0 | ||
| (m · Δμ)/|Δμ| | 0.980 | 0.858 | / | / | / | / | ||
| θΔμ | 12 | 31 | / | / | / | / | ||
| (d) | Peak Energy | 18990 | 20190 | 21610 | 22990 | 24380 | 25900 | |
| FWHM | 1400 | 1400 | 1400 | 1400 | 1400 | 1400 | ||
| −2459 | −1225 | −951 | −691 | −327 | 0 | |||
| |Δμ| | 16.2 | 6.23 | 0 | 0 | 0 | 0 | ||
| (m · Δμ)/|Δμ| | 0.938 | 0.984 | / | / | / | / | ||
| θΔμ | 20 | 10 | / | / | / | / | ||
| (e) | Peak Energy | 20155 | 21147 | 22563 | 24170 | 25576 | 26883 | |
| FWHM | 1400 | 1400 | 1400 | 1400 | 1400 | 1400 | ||
| −1634 | −810 | −420 | −215 | 0 | 0 | |||
| |Δμ| | 13.8 | 0 | 0 | 0 | 0 | 0 | ||
| (m · Δμ)/|Δμ| | 0.956 | / | / | / | / | / | ||
| θΔμ | 17 | / | / | / | / | / | ||
| (f) | Peak Energy | 18570 | 19680 | 21050 | 22350 | 23611 | 24970 | |
| FWHM | 1600 | 1600 | 1600 | 1600 | 1600 | 1600 | ||
| −2000 | −1385 | −1021 | −679 | −454 | 0 | |||
| |Δμ| | 16.3 | 7.00 | 0 | 6.84 | 0 | 0 | ||
| (m · Δμ)/|Δμ| | 0.986 | 0.991 | / | 0.945 | / | / | ||
| θΔμ | 9.6 | 7.7 | / | 19 | / | / |
Stark absorption spectra of all the analogues show significant signals in the region of the lowest absorption band (band 1). This observation is consistent with the previous report for Per in solvent [9], suggesting that the lowest absorption band has the CT character and so can be distinguished from the other Gaussian profiles (see Fig. 2). The Stark absorption spectra were analyzed using Eq. (1). Here we assumed each Gaussian profile in a single absorption band has different Aχ, Bχ, and Cχ values and then performed the spectral fitting. In all cases this spectral fitting was successful as shown in Fig. 2. Table 1 summarizes the nonlinear optical parameters, such as polarizabilty change and the magnitude of static dipole-moment change (|Δμ|) upon photoexcitation, determined by this fitting procedure. The fitting was determined using spectral data where χ = 54.7° since at this point the angular dependent term is cancelled out (3cos2 χ − 1 = 0) [16]. The calculated |Δμ| value of band 1 for Per (20.8 Debye) is consistent with that reported previously measured in 2-methyl tetrahydrofuran (22±3 Debye) [9]. It should be noted that band 1 from all the analogues shows significant values for |Δμ|. This observation provides further support for the idea that band 1 of all the analogues has CT character. It is also to be noted that band 2 of B-1, 9Z-B-1, C-1, and D-1 and band 4 of Per, 9Z-B-1, and D-1 showed marked values of |Δμ|, suggesting that these bands also have CT character. In what follows, however, we will only focus our attention to band 1.
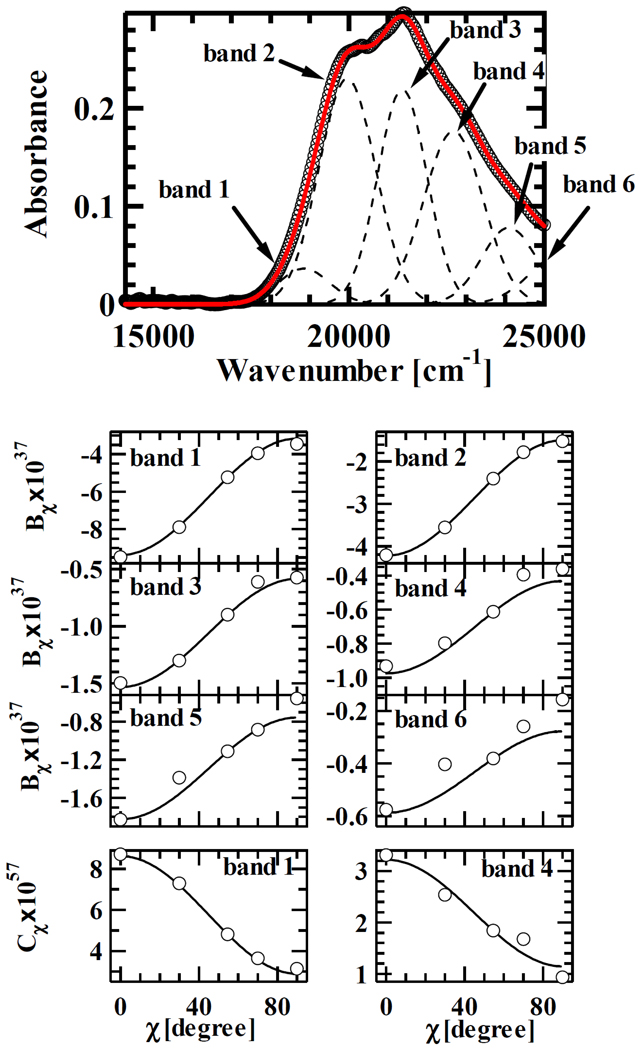
Fig. 3 shows the results of analysis of the χ dependence of the Stark absorption spectrum of Per. Here we only show the results of Per as an illustration because the other analogues all show similar results. Since the value of Aχ was negligibly small for all the cases studied here, angular dependence was only investigated for Bχ and Cχ. The χ dependence of Bχ and Cχ values can be expressed as shown in Eqs. (3) and (4). The lower panel of Fig. 3 shows the results of fitting for Bχ and Cχ of each Gaussian profile using these equations. Since the value of H has independently been determined at the magic angle measurements, according to this fitting protocol, the other coefficients F, G and I can be determined. Among these coefficients, the coefficient I has the significant meaning in the following analysis. This is because, according to Eq. (10), the value of can be determined when the value of I is known. gives the important information concerning the angle θΔμ between m (a unit vector of transition dipole moment of Per analogues) and Δμ described by the following equation.
| (12) |
From this equation, the value of θΔμ of band 1 is determined to be 2.6° for Per, 27° for B-1, 12° for 9Z-B-1, 20° for C-1, 17°for C-1-R, and 9.6° for D-1. θΔμ is an important parameter to discuss the direction of the intramolecular charge transfer in the ICT state as shown below.
Fig. 3.
Absorption spectrum (top panel) and the analyses of χ dependence of Bχ and Cχ for each Gaussian sub-band of Per (lower panels).
3.2 MNDO-PSDCI Calculation
In order to evaluate the properties of the singlet excited states, molecular orbital calculations were performed for all the Per analogues. Comparison of four methods of calculations (MNDO-PSDCI, MNDO-PSDCI+, SAC-CI (Symmetry Adapted Cluster/Configurational Interaction), and TDDFT) has been reported to characterize the excited-state electronic properties of fucoxanthin (another carbonyl containing carotenoid) [25]. None of these four methods predict the existence of a true ICT state in absorption, however, the results of each calculation satisfactorily explain the part of the experimental observations for Per and fucoxanthin [7,25]. SAC-CI is the highest-level theory applied to these molecules, beside the fact this method requires the highest computer resources and a certain length of computational time. Nevertheless, this method does not always adequately predict the Δμ values. TDDFT method is a better choice for the prediction of the Δμ values. It also explains the behaviors of difference Mulliken charges. But this method cannot accurately predict the state ordering of the excited singlet states of fucoxanthin. MNDO-PSDCI calculations are handy to use and in very good agreement with SAC-CI on the ordering of the S1 (21Ag−), S2 (11Bu+), and S3 (11Bu−) states. Therefore, this method was applied in this study.
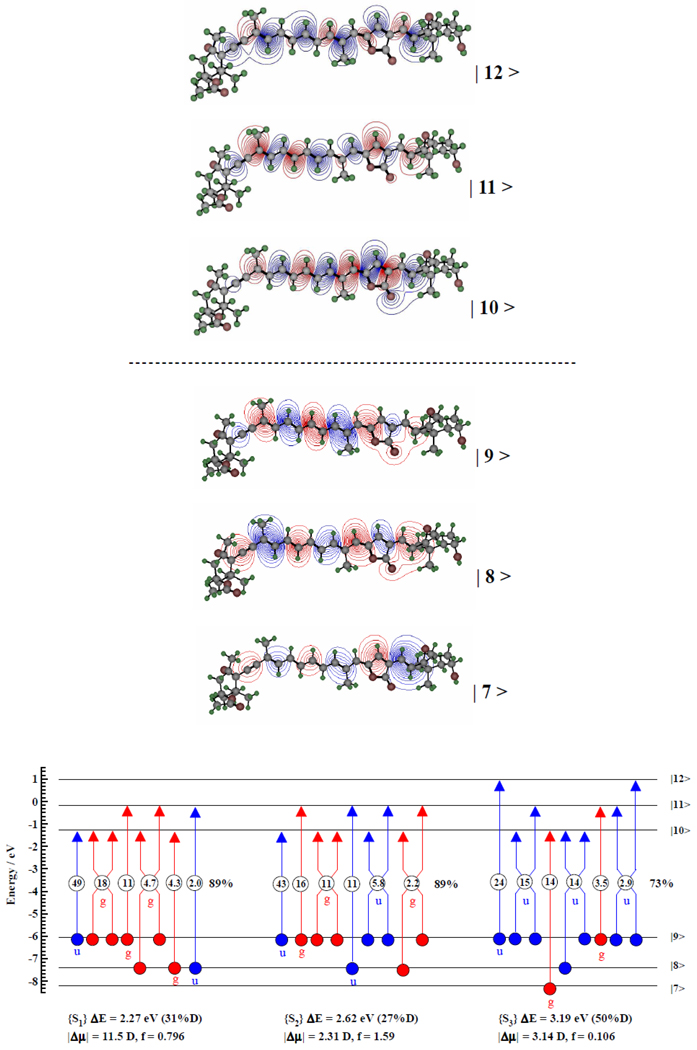
As an example of the MNDO-PSDCI computation Fig. 4 shows the results of B-1. By referring to the assignment that has already been reported for Per the S1, S2, and S3 states can be ascribable to the 21Ag*−-like, 11Bu*+-like, and 11Bu*−-like states [7], respectively. It is to be noted that the oscillator strength (f) of S1 (f = 0.796) is apparently smaller than S2 (f = 1.59) but the |Δμ| of S1 (11.5 Debye) shows significant value as compared to S2 (2.31 Debye). This is because that the MNDO-PSDCI calculation cannot clearly discriminate the S1 and SICT states, and the results of S1 involve the contribution of the CT character. Similar situation is happened also for the case of S2. In this sense the S1 and S2 states described here should be more precisely designated as the S1-ICT and S2-ICT states, respectively. This assignment is consistent with the previous results of Per [7] and fucoxanthin [25]. Table 2 summarizes the results of the MNDO-PSDCI calculations for all the Per analogues. The results of Per is rather deviated from the previous report [7]. This is solely due to the fact that we did not adjust the CI parameters and used default values in the present calculations. By inference based on the assignment for Per the S1, S2 and S3 states of all the other analogues can also be attributed to the 21Ag*−-like, 11Bu*+-like, and 11Bu*−-like states, respectively.
Fig. 4.
Configurational analysis of the three lowest-lying singlet excited states of B-1 based on MNDO-PSDCI calculations. Each excited state is described as a linear combination of single or double excitations with the percent contribution of configurations shown in the circle. Only configurations contributing 2% or more are shown. Configuration with gerade-like symmetry are labeled “g” and are shown in red, and those with ungerade-like symmetry are labeled “u” and are shown in blue. Doubly excited configurations have two source (hole circles) and destination (particle arrows) symbols. “%D” shows doubly excited character of each excited state.
Table 2.
Transition energy ΔE (cm−1), doubly excited character %D (%), oscillator strength f, and |Δμ| [Debye] of S0 → S1, S0 → S2 and S0 → S3 transitions of (a) per, (b) B-1, (c) 9Z-B-1, (d) C-1, (e) C-1-R, and (f) D-1 predicted by MNDO-PSDCI calculations.
| S0 → S1 | S0 → S2 | S0 → S3 | S0 → S1 | S0 → S2 | S0 → S3 | ||
|---|---|---|---|---|---|---|---|
| (a) | (b) | ||||||
| ΔE | 17730 | 20700 | 25300 | ΔE | 18310 | 21140 | 25750 |
| %D | 31 | 30 | 50 | %D | 31 | 27 | 50 |
| f | 0.782 | 1.616 | 0.108 | f | 0.795 | 1.594 | 0.106 |
| |Δμ| | 12.5 | 1.25 | 5.82 | |Δμ| | 11.5 | 2.31 | 3.14 |
| (c) | (d) | ||||||
| ΔE | 18162 | 20960 | 25440 | ΔE | 18100 | 20860 | 25750 |
| %D | 33 | 26 | 53 | %D | 32 | 28 | 49 |
| f | 0.639 | 1.543 | 0.086 | f | 0.779 | 1.653 | 0.129 |
| |Δμ| | 10.3 | 2.22 | 1.53 | |Δμ| | 12.1 | 1.52 | 4.85 |
| (e) | (f) | ||||||
| ΔE | 18360 | 21702 | 27530 | ΔE | 16950 | 19660 | 23650 |
| %D | 36 | 25 | 46 | %D | 43 | 21 | 52 |
| f | 0.505 | 1.467 | 0.092 | f | 0.425 | 1.946 | 0.118 |
| |Δμ| | 10.3 | 1.51 | 1.56 | |Δμ| | 10.8 | 1.37 | 4.98 |
According to the above results of MNDO-PSDCI calculations, the absorption bands that show remarkable Stark signals and hence having CT character can be assigned to either S0 → S1-ICT or S0 → S2-ICT transition. However, if we think about the small oscillator strength of the former transition in reality, there is a less possibility to detect the S0 → S1-ICT transition in the Stark absorption spectroscopy. This idea is supported by the study on Stark absorption spectroscopy of β-carotene homologues [18]. If we assign the band 1 that shows significant |Δμ| values of Per and analogues to the S0 → S1-ICT transition, there appears apparent contradiction in its energy. The S1 energy of Per is reported to be about 16200 cm−1 [7,26], while the energy of band 1 is around 17700 cm−1. The S1-ICT state was shown to give rise to a near-IR emission band centered at 10530 cm−1 [26]. In these regards, it might be rational to assign the origin of band 1 to the S0 → S2-ICT transition. This assignment is consistent with the previous reports [7,9,25] and supports the idea by Zigmantas et al. who suggested the presence of ‘red’ peridinin that has enhanced CT character [11]. A number of previous studies on peridinin showed importance of conformational disorder in explanation of excited-state properties. However, only the most stable conformations of Per and analogues that have been optimized by B3LYP density functional methods using a 6-31G(d) basis set were investigated in this study.
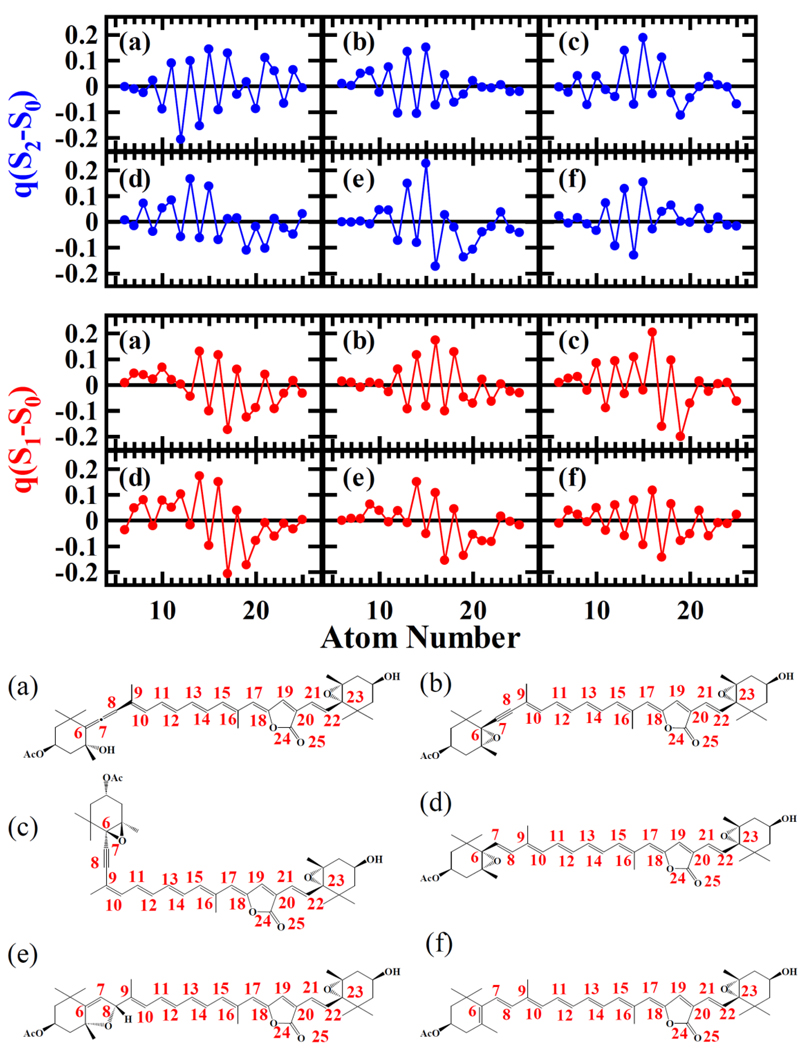
Fig. 5 shows the difference Mulliken charges of skeletal carbon and oxygen atoms between the ground S0 and the S1 states, q(S1−S0), and those between the S0 and S2 states, q(S2−S0), of the Per analogues calculated using MNDO-PSDCI method. q(S1−S0) of Per at O25 shows negative values while those of C6, C7, C8, C9, C10 and C11 show positives values. This is a good indication that the carbonyl group in lactone ring is an electron accepter and allene group is an electron donor in the S1-ICT state of Per. On the other hand q(S2−S0) does not show this kind of feature. Similar results have already been reported for fucoxanthin based on both MNDO-PSDCI and SAC-CI calculations [25]. In this report Premvardhan et al. have also compared the results of SAC-CI and TDDFT calculations (see supporting information of ref [25]). The TDDFT calculation shows completely opposite trend from the SAC-CI calculation for difference Mulliken charges of fucoxanthin. In the TDDFT calculation the electron accepting behavior of carbonyl group and electron donating behavior of allene group is pronounced in q(S2−S0) but q(S1−S0) does not show this trend. The result of TDDFT calculation seems to be adequate to interpret the dipolar property of the S2 (11Bu*+-like state). However, this particular calculation cannot predict the state ordering of the singlet excited-states and shows that the 1Bu*+-like state is the S1 state, a fact which clearly contradicts to the experimental observations that show the 21Ag*−-like state is the S1 state. Premvardhan suggested that the properties for the 11Bu*+-like state is likely not due to a failure of MNDOCI theory, but that the dipolar properties of the 11Bu*+-like state need to be interpreted in conjunction with that for the 21Ag*−-like state [25]. Therefore, in what follows we adopt this idea to interpret the theoretical predictions on Per analogues.
Fig. 5.
Difference Mulliken charge density between the S0 and S2 states (q(S2−S0)) and that between the S0 and S1 states (q(S1−S0)) of (a) Per, (b) B-1, (c) 9Z-B-1, (d) C-1, (e) C-1-R and (f) D-1 calculated by MNDO-PSDCI method. A numbering of carbon and oxygen atoms are shown with chemical structures of these molecules for clarity.
The results of MNDO-PSDCI calculations of Per analogues that do not have allene group show basically the similar electron-withdrawing behaviors for carbonyl group in lactone ring because carbon or oxygen atoms at this particular group always shows negative values of q(S1−S0). In this regard it can be assumed that carbonyl group in lactone ring can be an electron accepter in the S1-ICT state and hence in the S2-ICT state.
3.3 The origin of electron donor in the S2-ICT state of Per and analogues
Experimentally determined θΔμ value corresponds to the angle between Δμ and the direction of transition dipole moment (m) of Per analogues. Since the |Δμ| and θΔμ values have been determined experimentally, by referring to the theoretically predicted direction of m using MNDO-PSDCI calculations, it is possible to discuss the origin of the electron donating part of the Per analogues.
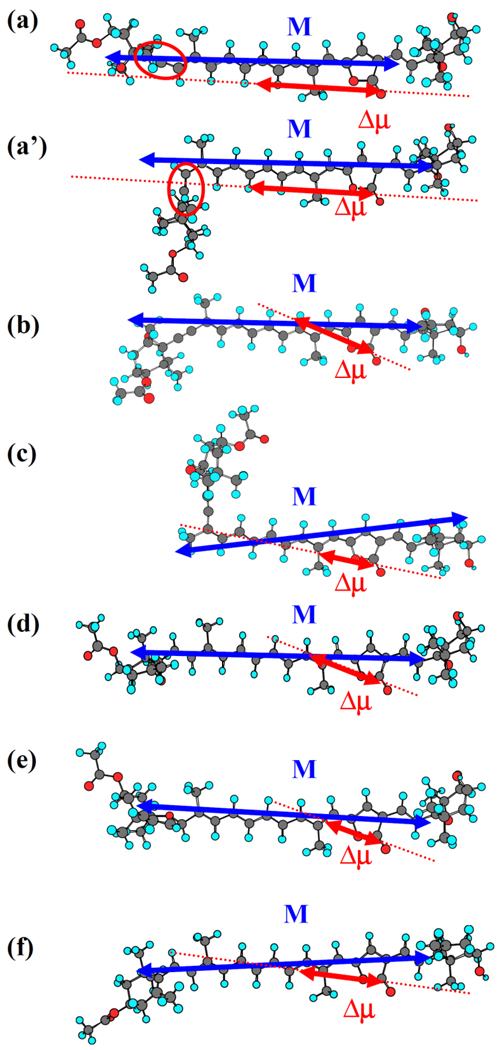
Fig. 6 shows the illustration of Δμ with reference to M. One of the end points of Δμ is set to the position between carbon and oxygen atoms of carbonyl group in all the cases. Assuming one electron transfer process in the CT state, length of Δμ can unequivocally determined using a simple relation of |Δμ| = e|r|, where e is electron charge and |r| is length of Δμ. It is interesting to note that the Δμ of all the analogues of Per (except Per itself) has the direction toward the π-conjugated electron part that supposed to have relatively high electron density in the S0 state. This is an indication that conjugated polyene chain acts as an electron donor in the S1-ICT state of the Per analogues. However, the situation of Per is apparently different from the other analogues. This can be readily realized because Per has the smallest θΔμ value among all the analogues studied here (see Table 1). As illustrated in Fig. 6(a) Δμ vector of Per points the allene group side, although its direction does not necessarily coincide with the exact position of the allene group. This result looks somewhat strange and is reminiscent of taking some other effect into consideration for more appropriate understanding of this discrepancy. This can relatively simply be done if we consider another possible structure of Per. According to semi-empirical molecular orbital calculations of Per (data not shown), it is suggested that Per has two stable conformations around C8–C9 single bond (8s-trans and 8s-cis). 8s-trans conformation corresponds to the illustration in Fig. 6(a) and 8s-cis conformation to that in Fig. 6(a’). The direction of Δμ in 8s-cis conformation successfully points the exact position of allene group (see Fig. 6(a’)). This finding further support the idea that allene group of Per can be electron donor in the S2-ICT state. Per has the largest |Δμ| value among the analogues studied here. This might be caused by the presence of allene group in Per.
Fig. 6.
Illustration of M and Δμ of (a) Per, (b) B-1, (c) 9Z-B-1, (d) C-1, (e) C-1-R and (f) D-1 superimposed on their ground-state optimized structures by DFT calculations. (a’) shows the 8s-cis conformation of Per. Red circles in (a) and (a’) show the position of allene group in Per.
4. Conclusions
Stark absorption spectra and their χ dependence of Per and five allene-modified analogues (B-1, 9Z-B-1, C-1, C-1-R, and D-1) were measured in PMMA at 77K. The energetically lowest absorption bands (band 1) of all the analogues showed the marked intensity in Stark absorption spectra, suggesting the presence of CT character of this particular band. All the analogues showed significant |Δμ| values in band 1, further supporting this idea. Based on the results of MNDO-PSDCI the origin of band 1 of Per and analogues was assigned to S0 → S2-ICT transition. It was also suggested that carbonyl group in the lactone ring can be a good candidate for electron acceptor in the S2-ICT state. Experimentally determined θΔμ values of band 1 enabled us to discuss the electron donating part in the S2-ICT state. In the analogues of Per that lack the allene group, the conjugated polyene part of the molecule is suggested to be electron donor, while allene can be considered the electron donor in Per. The allene group in Per is crucial and leads to the largest |Δμ| value among the analogues investigated in this study. This is the first experimental evidence that shows the allene group in Per enhances the ICT character.
Acknowledgements
HH thanks Nissan Science Foundation for financial support. RJC and HH thank HFSP for financial support. SK was supported by a Grant-in-Aid for Science Research on Priority Areas 16073222 from the Ministry of Education, Culture, Sports, Science and Technology, Japan and a Matching Fund Subsidy for a Kwansei Gakuin University. The work in the laboratory of HAF was supported by grants from the National Institutes of Health (GM-30353), the National Science Foundation, and the University of Connecticut Research Foundation. RRB acknowledges support from the National Institutes of Health (GM-34548).
References
- 1.Yoon HS, Hackett JD, Bhattacharya D. Proc. Natl. Acad. Sci. U.S.A. 2002;99:11724. doi: 10.1073/pnas.172234799. [DOI] [PMC free article] [PubMed] [Google Scholar]
- 2.Bautista JA, Hiller RG, Sharples FP, Gosztola D, Wasielewski M, Frank HA. J. Phys. Chem. A. 1999;103:2267. [Google Scholar]
- 3.Bautista JA, Chynwat V, Cua A, Jansen FJ, Lugtenburg J, Gosztola D, Wasielewski MR, Frank HA. Photosyn. Res. 1998;55:49. [Google Scholar]
- 4.Polívka T, Sundström V. Chem. Rev. 2004;104:2021. doi: 10.1021/cr020674n. [DOI] [PubMed] [Google Scholar]
- 5.Frank HA, Bautista JA, Josue J, Pendon Z, Hiller RG, Sharples FP, Gosztola D, Wasielewski MR. J. Phys. Chem. B. 2000;104:4569. [Google Scholar]
- 6.Vaswani HM, Hsu CP, Head-Gordon M, Fleming GR. J. Phys. Chem. B. 2003;107:7940. [Google Scholar]
- 7.Shima S, Ilagan RP, Gillespie N, Sommer BJ, Hiller RG, Sharples FP, Frank HA, Birge RR. J. Phys. Chem. A. 2003;107:8052. [Google Scholar]
- 8.Papagiannakis E, Larsen DS, van Stokkum IHM, Vengris M, Hiller RG, van Grondelle R. Biochemistry. 2004;43:15303. doi: 10.1021/bi047977r. [DOI] [PubMed] [Google Scholar]
- 9.Premvardhan L, Papagiannakis E, Hiller RG, van Grondelle R. J. Phys. Chem. B. 2005;109:15589. doi: 10.1021/jp052027g. [DOI] [PubMed] [Google Scholar]
- 10.Linden PA, Zimmermann J, Brixner T, Holt NE, Vaswani HM, Hiller RG, Fleming GR. J. Phys. Chem. B. 2004;108:10340. [Google Scholar]
- 11.Zigmantas D, Hiller RG, Yartsev A, Sundström V, Polívka T. J. Phys. Chem. B. 2003;107:5339. [Google Scholar]
- 12.Furuichi N, Hara H, Osaki T, Mori H, Katsumura S. Angew. Chem. Int. Ed. 2002;41:1023. doi: 10.1002/1521-3773(20020315)41:6<1023::aid-anie1023>3.0.co;2-a. [DOI] [PubMed] [Google Scholar]
- 13.Furuichi N, Hara H, Osaki T, Nakano M, Mori H, Katsumura S. J. Org. Chem. 2004;69:7949. doi: 10.1021/jo048852v. [DOI] [PubMed] [Google Scholar]
- 14.Kajikawa T, Aoki K, Singh RS, Iwashita T, Kusumoto T, Frank HA, Hashimoto H, Katsumura S. Org. Biomol. Chem. 2009;7:3723. doi: 10.1039/b907456b. [DOI] [PMC free article] [PubMed] [Google Scholar]
- 15.Hashimoto H, Nakashima T, Hattori K, Yamada T, Mizoguchi T, Koyama Y, Kobayashi T. Pure Appl. Chem. 1999;71:2225. [Google Scholar]
- 16.Yanagi K, Kobayashi T, Hashimoto H. Phys. Rev. B. 2003;67:115122. [Google Scholar]
- 17.Liptay W. In: Excited States. Lim EC, editor. New York/London: Academic Press; 1974. p. 129. [Google Scholar]
- 18.Yanagi K, Gardiner AT, Cogdell RJ, Hashimoto H. Phys. Rev. B. 2005;71:195118. [Google Scholar]
- 19.Frisch MJ, Trucks GW, Schlegel HB, Scuseria GE, Robb MA, Cheeseman JR, Montgomery JA, Jr, Vreven T, Kudin KN, Burant JC, Millam JM, Iyengar SS, Tomasi J, Barone V, Mennucci B, Cossi M, Scalmani G, Rega N, Petersson GA, Nakatsuji H, Hada M, Ehara M, Toyota K, Fukuda R, Hasegawa J, Ishida M, Nakajima T, Honda Y, Kitao O, Nakai H, Klene M, Li X, Knox JE, Hratchian HP, Cross JB, Bakken V, Adamo C, Jaramillo J, Gomperts R, Stratmann RE, Yazyev O, Austin AJ, Cammi R, Pomelli C, Ochterski JW, Ayala PY, Morokuma K, Voth GA, Salvador P, Dannenberg JJ, Zakrzewski VG, Dapprich S, Daniels AD, Strain MC, Farkas O, Malick DK, Rabuck AD, Raghavachari K, Foresman JB, Ortiz JV, Cui Q, Baboul AG, Clifford S, Cioslowski J, Stefanov BB, Liu G, Liashenko A, Piskorz P, Komaromi I, Martin RL, Fox DJ, Keith T, Al-Laham MA, Peng CY, Nanayakkara A, Challacombe M, Gill PMW, Johnson B, Chen W, Wong MW, Gonzalez C, Pople JA. Gaussian 03, Revision C.02. Wallingford CT: Gaussian, Inc.; 2004. [Google Scholar]
- 20.Martin CH, Birge RR. J. Phys. Chem. A. 1998;102:852. [Google Scholar]
- 21.Hudson BS, Birge RR. J. Phys. Chem. A. 1999;103:2274. [Google Scholar]
- 22.Ren L, Martin CH, Wise KJ, Gillespie NB, Luecke H, Lanyi JK, Spudich JL, Birge RR. Biochemistry. 2001;40:13906. doi: 10.1021/bi0116487. [DOI] [PubMed] [Google Scholar]
- 23.Kusnetzow AK, Dukkipati A, Babu KR, Ramos L, Knox BE, Birge RR. Proc. Natl. Acad. Sci. U. S. A. 2004;101:941. doi: 10.1073/pnas.0305206101. [DOI] [PMC free article] [PubMed] [Google Scholar]
- 24.Hillebrecht JR, Galan J, Rangarajan R, Ramos L, McCleary K, Ward DE, Stuart JA, Birge RR. Biochemistry. 2006;45:1579. doi: 10.1021/bi051851s. [DOI] [PubMed] [Google Scholar]
- 25.Premvardhan L, Sandberg DJ, Fey H, Birge RR, Büchel C, van Grondelle R. J. Phys. Chem. B. 2008;112:11838. doi: 10.1021/jp802689p. [DOI] [PMC free article] [PubMed] [Google Scholar]
- 26.Zigmantas D, Polívka T, Hiller RG, Yartsev A, Sundström V. J. Phys. Chem. A. 2001;105:10296. [Google Scholar]


