

Abstract
AIM
To develop a core list of 100 commonly prescribed drugs to support prescribing education.
METHODS
A retrospective analysis of prescribing data from primary care in England (2006 and 2008) and from two London Teaching Hospitals (2007 and 2009) was performed. A survey of prescribing by foundation year 1 (FY1) doctors in 39 NHS Trusts across London was carried out.
RESULTS
A core list of 100 commonly prescribed drugs comprising ≥0.1% prescriptions in primary and/or secondary care was developed in 2006/7. The core list remained stable over 2 years. FY1 doctors prescribed 65% drugs on the list at least monthly. Seventy-six% of FY1 doctors did not regularly prescribe any drugs not on the core list. There was a strong correlation between prescribing frequency (prescriptions for each drug class expressed as percentage of all prescriptions written) and error rate described in the EQUIP study (errors made when prescribing each drug class expressed as a percentage of all errors made), n= 39, r= 0.861, P= 0.000.
CONCLUSIONS
Our core drug list identifies drugs that are commonly used and associated with error and is stable over at least 2 years. This list can now be used to develop learning resources and training programmes to improve prescribing of drugs in regular use. Complementary skills required for prescribing less familiar drugs must be developed in parallel. Ongoing research is required to monitor the effect of new training initiatives on prescribing error and patient safety.
Keywords: clinical pharmacology, core drug list, formulary, medical students, newly-qualified doctor, prescribing
WHAT IS ALREADY KNOWN ABOUT THIS SUBJECT
8.9% medication orders written by doctors contain prescribing errors, which are made by all grades of doctor from foundation year 1 to consultant.
Recommendations to improve prescribing safety include continuing education from medical school to retirement, as well as improvement of NHS systems.
Priority areas for education in prescribing with potential to have impact on prescribing errors have not previously been identified.
WHAT THIS STUDY ADDS
This study has identified 100 drugs most commonly prescribed in primary and secondary care and shown that these drugs are those most frequently associated with prescribing errors.
This core drug list has potential to direct prescribing training for both undergraduate and postgraduate prescribers as part of a national strategy to reduce prescribing errors.
Introduction
Prescribing errors are common and have important implications for patient safety. In a recent study (EQUIP) commissioned by the General Medical Council, researchers in the North of England identified errors in 8.9% of medication orders written [1]. Errors were made by all grades of doctor, although less commonly by consultants (5.9%) than by foundation year 1 (FY1) (8.4%) or FY2 (10.3%) doctors. In an associated systematic review of 16 separate studies, error rates were 7% (interquartile range 2–14) of medication orders [2].
Factors determining prescribing errors are extremely complex. Characteristics of the clinical environment, prescribing culture, workload, time and support all have an important impact and need to be addressed to improve patient safety [1, 3]. On an individual level, prescribing errors are attributable to lack of training in practical prescribing and failures to link theory with practice [1]. Key recommendations to reduce prescribing errors include education in and summative assessment of practical prescribing, particularly with respect to commonly prescribed drugs [1].
Identification of ‘commonly-prescribed drugs’ to support prescribing training has proved controversial. The World Health Organization recommends that students themselves should identify drugs that they will use regularly in clinical practice and develop a core list of p (personal) drugs [4]. In practice this is difficult for junior students who are presented with a vast array of different medicines for the first time. De Fries and colleagues found that use of a core drug list and associated prescribing information (formulary) improved prescribing skills in medical students [5]. However, as long as students were studying in a problem-based curriculum, prescribing skills improved irrespective of whether the core drug list was tutor or student-led (personal). Previous ‘tutor-led’ core drug lists for medical students have been based on consensus of senior clinical pharmacologists [6] or created by a process of iteration between specialist consensus lists [6], local NHS formularies and local teachers [7]. These approaches tend to produce longer, more comprehensive drug lists, which may be less useful in focussing learning towards clinical practice.
In this paper we describe the development of a core drug list based on common use in clinical practice. The core list was compiled from primary care prescribing data, secondary care prescribing information from two London hospitals and drugs prescribed in the emergency situation according to acute care guidelines. The list was validated by determining stability over 2 years and by determining whether drugs on the list were prescribed by FY1 doctors. The relationship of prescribing frequency to error rate was established by comparing the core list with error rate from the EQUIP study [1].
Methods
Data collection
Primary care
Prescription cost analysis (PCA) data for England 2006 and 2008 were obtained [8, 9]. These data were based on information obtained from prescriptions sent to the Prescription Pricing Division of the Business Services Authority for payment. All prescriptions dispensed in the community were included, the majority of which were written by general practitioners.
Secondary care
Investigators systematically reviewed inpatient drug charts of unselected patients on medical and surgical wards at St George's Healthcare NHS Trust (2007 and 2009) and The London Hospital (2007). Wards were visited at least once. Where more than one visit was made, the second visit was at least 2 weeks after the first. Drug charts of patients present on the ward on both occasions were only included in the study at the first visit. Investigators noted all medication prescribed on each drug chart, including regular, as required, once only and intravenous prescriptions. Medications that had been stopped were also included. Blood and blood products not in the British National Formulary (BNF) and nutritional products (borderline substances) were excluded. No demographic or other information relating prescribing to individual patients was collected.
Emergency drugs
Hospital guidelines for the management of common medical emergencies [10] were reviewed to identify all drugs recommended for use in acute care.
Compiling the core list
Prescribing information was sorted to group individual drugs and preparations within classes according to the classification of the BNF [11]. The final core drug list included drugs or classes comprising ≥0.1% prescriptions in both primary and secondary care, drugs or classes comprising ≥0.1% prescriptions in EITHER primary but not secondary care OR secondary but not primary care and drugs or classes from emergency guidelines considered by two senior clinical pharmacologists to be those most commonly prescribed in the emergency situation.
Validating the core drug list
Stability over 2 years
Prescribing information from primary and secondary care was collected again 2 years after the initial study and sorted according to the BNF classification. Drugs or classes were ranked in original and follow-up lists according to prescribing frequency so that the most commonly prescribed drug was ranked 1. Ranks defined by prescribing frequency for drugs and classes were compared between original and follow-up studies in primary and secondary care using Bland Altman plots. Movement of drugs into or out of the core list of 100 most commonly prescribed was also determined.
Use of drugs on core list
Doctors at the end of their FY1 were contacted by email and asked to complete a prescribing survey. Doctors were asked to state whether they had prescribed each drug on the core list weekly, monthly, less than monthly or never. They were also asked to identify drugs not on the core list that they had prescribed regularly.
Association of prescribing frequency with incidence of prescribing errors
Frequency of prescription of each drug or class was expressed as proportion of all prescriptions written in either primary (2006) or secondary (2007) care settings and the mean frequency for both settings calculated. Information regarding errors made for each drug or class as a percentage of all errors made was obtained from the EQUIP study [1]. The two drug lists were aligned according to the classification in the BNF and prescribing frequency and error rate compared using Pearson's correlation.
Ethical approval
This study was not considered to require ethical approval. Only anonymized prescribing information was collected and no demographic or other identifiable patient information was obtained. FY1 doctors were approached by e-mail to take part in a voluntary anonymized survey. This part of the study was judged against published NRes guidelines to be a service evaluation and therefore not to require ethical approval [12].
Results
Core drug list
Seven hundred and fifty-two million prescriptions in primary care and 7705 prescriptions in secondary care were reviewed. The discrepancy in numbers reflects the easy availability of electronic prescribing information in primary care, whereas secondary care information was collected manually.
The core list of 100 drugs or classes included 73 drugs or classes comprising ≥0.1% prescriptions in both primary and secondary care (Table 1), nine drugs comprising ≥0.1% prescriptions in primary care alone (Table 2), 10 drugs or classes comprising ≥0.1% prescriptions in secondary care alone (Table 3) and eight drugs identified by emergency guidelines (Table 4).
Table 1.
Drugs comprising ≥0.1% of both hospital and primary care prescriptions
| Overall rank | Drug, class or BNF grouping | Most commonly prescribed example(s) | Hospital rank | PCA rank | Hospital (%) | PCA (%) |
|---|---|---|---|---|---|---|
| 1 | Proton pump inhibitors | Omeprazole Lansoprazole | 4 | 5 | 3.9 | 3.5 |
| 2 | Statins | Simvastatin | 8 | 1 | 3.1 | 5.4 |
| 3 | Angiotensin converting enzyme inhibitors | Ramipril | 11 | 2 | 2.1 | 4.1 |
| 4 | Aspirin | 9 | 4 | 2.9 | 3.9 | |
| 5 | Paracetamol | 1 | 14 | 6.7 | 2.1 | |
| 6 | β2-adrenoceptor agonists | Salbutamol Salmeterol | 12 | 8 | 2.1 | 2.7 |
| 7 | β-adrenoceptor blockers | Atenolol | 17 | 3 | 1.6 | 3.9 |
| 8 | Calcium channel blockers | Amlodipine | 15 | 6 | 1.9 | 3.4 |
| 9 | Broad spectrum penicillins | Amoxicillin Co-amoxiclav | 10 | 16 | 2.5 | 2.0 |
| 10 | Opioids for moderate pain | Tramadol | 3 | 24 | 4.2 | 1.3 |
| 11 | Combination analgesia | Co-codamol Co-dydramol | 20 | 9 | 1.3 | 2.5 |
| 12 | Non-steroidal anti-inflammatory drugs | Diclofenac | 21 | 10 | 1.3 | 2.4 |
| 13 | Loop diuretics | Furosemide | 14 | 19 | 1.9 | 1.6 |
| 14 | Osmotic laxatives | Lactulose Movicol | 6 | 32 | 3.3 | 0.9 |
| 15 | Benzodiazepines | Diazepam, temazepam | 19 | 22 | 1.4 | 1.5 |
| 16 | Stimulant laxatives | Senna | 5 | 36 | 3.6 | 0.7 |
| 17 | Serotonin-specific re-uptake inhibitors | Citalopram | 31 | 13 | 0.9 | 2.2 |
| 18 | Thiazide and related diuretics | Bendroflumethiazide | 37 | 7 | 0.8 | 2.9 |
| 19 | Vitamins | Thiamine Folic acid | 16 | 29 | 1.8 | 1.0 |
| 20 | Nitrates | Isosorbide mononitrate Glyceryl trinitrate | 23 | 28 | 1.2 | 1.1 |
| 21 | Calcium and vitamin D | 22 | 31 | 1.3 | 0.9 | |
| 22 | Inhaled corticosteroids | Beclometasone dipropionate | 43 | 15 | 0.6 | 2.0 |
| 23 | Glucocorticoid therapy | Prednisolone | 24 | 35 | 1.2 | 0.7 |
| 24 | α-adrenoceptor blockers | Doxazosin | 35 | 27 | 0.8 | 1.1 |
| 25 | Angiotensin-II receptor antagonists | Losartan | 42 | 20 | 0.6 | 1.6 |
| 26 | Thyroid hormones | Levothyroxine | 51 | 11 | 0.6 | 2.3 |
| 27 | Biguanides | Metformin | 38 | 25 | 0.8 | 1.3 |
| 28 | Insulins | 25 | 38 | 1.1 | 0.7 | |
| 29 | Warfarin | 34 | 30 | 0.8 | 0.9 | |
| 30 | Opioids for severe pain | Morphine sulphate | 7 | 61 | 3.2 | 0.4 |
| 31 | Emollients | Diprobase Dermol 500 | 48 | 21 | 0.6 | 1.6 |
| 32 | Iron | Ferrous sulphate | 32 | 42 | 0.9 | 0.6 |
| 33 | Tricyclics and related antidepressants | Amitriptyline | 52 | 23 | 0.5 | 1.4 |
| 34 | Antihistamines | Chlorphenamine Cetirizine | 50 | 26 | 0.6 | 1.3 |
| 35 | Sulphonylureas | Gliclazide | 44 | 33 | 0.6 | 0.8 |
| 36 | Cephalosporins and other beta-lactams | Cefradine Cefalexin Cefuroxime Imipenem | 27 | 52 | 1.1 | 0.4 |
| 37 | Bisphosphonates and other drugs affecting bone metabolism | Alendronic acid | 46 | 34 | 0.6 | 0.8 |
| 38 | Antimuscarinic bronchodilators | Ipratropium Tiotropium | 26 | 58 | 1.1 | 0.4 |
| 39 | Macrolides | Erythromycin, clarithromycin | 40 | 46 | 0.7 | 0.6 |
| 40 | Penicillinase-resistant penicillins | Flucloxacillin | 36 | 50 | 0.8 | 0.5 |
| 41 | Metronidazole | 18 | 72 | 1.6 | 0.3 | |
| 42 | Cardiac glycosides | Digoxin | 45 | 47 | 0.6 | 0.6 |
| 43 | Benzylpenicillin and phenoxymethylpenicillin | 30 | 64 | 0.9 | 0.3 | |
| 44 | H2-receptor antagonists | Ranitidine | 47 | 49 | 0.6 | 0.5 |
| 45 | Z-drugs | Zopiclone | 60 | 39 | 0.4 | 0.7 |
| 46 | Compound alginates and indigestion preparations | Gaviscon | 56 | 43 | 0.5 | 0.6 |
| 47 | Clopidogrel | 49 | 51 | 0.6 | 0.5 | |
| 48 | Anti-emetic dopamine receptor blockers | Metoclopramide, domperidone | 28 | 73 | 1.0 | 0.2 |
| 49 | Atypical antipsychotics | Quetiapine Olanzapine | 61 | 48 | 0.4 | 0.6 |
| 50 | Tear deficiency, ocular lubricants and astringents | Hypromellose | 68 | 44 | 0.3 | 0.6 |
| 51 | Trimethoprim | 57 | 57 | 0.5 | 0.4 | |
| 52 | Drugs used in substance dependence | Nicotine replacement Methadone | 78 | 37 | 0.2 | 0.7 |
| 53 | Antimuscarinics (antispasmodics) | Hyoscine Atropine Mebeverine | 62 | 55 | 0.3 | 0.4 |
| 54 | Compound bronchodilators | Seretide | 39 | 81 | 0.7 | 0.2 |
| 55 | Gout and hyperuricaemia | Allopurinol | 65 | 56 | 0.3 | 0.4 |
| 56 | Prostaglandin analogues (glaucoma) | Latanoprost | 70 | 54 | 0.2 | 0.4 |
| 57 | Antifungal drugs | Clotrimazole Nystatin | 59 | 66 | 0.4 | 0.2 |
| 58 | Antimuscarinics(bladder) | Oxybutynin Tolterodine | 67 | 60 | 0.3 | 0.4 |
| 59 | Other antidepressants | Venlafaxine Mirtazepine | 83 | 45 | 0.1 | 0.6 |
| 60 | Aldosterone antagonists | Spironolactone | 54 | 76 | 0.5 | 0.2 |
| 61 | Typical antipsychotics | Haloperidol Chlorpromazine | 64 | 67 | 0.3 | 0.3 |
| 62 | Quinine sulphate | 81 | 53 | 0.2 | 0.4 | |
| 63 | Phenothiazines and related drugs | Prochlorperazine | 69 | 74 | 0.2 | 0.2 |
| 64 | Gabapentin | 55 | 89 | 0.5 | 0.2 | |
| 65 | Nicorandil | 74 | 71 | 0.2 | 0.3 | |
| 66 | Quinolones | Ciprofloxacin | 58 | 88 | 0.4 | 0.2 |
| 67 | Dipyridimole | 63 | 90 | 0.3 | 0.2 | |
| 68 | Aminosalicylates | Mesalazine Sulphasalazine | 76 | 78 | 0.2 | 0.2 |
| 69 | Antimotility drugs | Loperamide | 73 | 82 | 0.2 | 0.2 |
| 70 | Sodium valproate | 89 | 69 | 0.1 | 0.3 | |
| 71 | Thiazolidinediones | Pioglitazone Rosiglitazone | 86 | 77 | 0.1 | 0.2 |
| 72 | 5-alpha reductase inhibitors | Finasteride | 77 | 87 | 0.2 | 0.2 |
| 73 | Phenytoin | 75 | 92 | 0.2 | 0.1 |
Table 2.
Drugs comprising ≥0.1% prescriptions in primary but not secondary care that were included in the core list
| Drug, class or BNF grouping | Most commonly prescribed example(s) | PCA rank | Prescribing frequency (%) | |
|---|---|---|---|---|
| 1 | Topical corticosteroids(skin, nasal) | Hydrocortisone Beclometasone dipropionate | 12 | 2.89 |
| 2 | Vaccines and antisera | Influenza vaccine | 17 | 1.87 |
| 3 | Female sex hormones including combined and progesterone only oral contraceptive pills | Ethinylestradiol | 18 | 1.68 |
| 4 | Tetracylines | Oxytetracycline | 62 | 0.35 |
| 5 | Potassium sparing diuretics with other diuretics | Co-amilofruse | 63 | 0.34 |
| 6 | Carbamazepine | 65 | 0.32 | |
| 7 | Bulk forming laxatives | Ispaghula husk | 68 | 0.28 |
| 8 | Dopaminergic parkinsonism drugs | Co-careldopa (carbidopa/levodopa) | 70 | 0.27 |
| 9 | Drugs for erectile dysfunction | Sildenafil | 75 | 0.23 |
Table 3.
Drugs comprising ≥0.1% prescriptions in secondary but not primary care that were included in the core list
| Drug, class or BNF grouping | Most commonly prescribed example(s) | Hospital rank | Prescribing frequency (%) | |
|---|---|---|---|---|
| 1 | Heparin | Enoxaparin, dalteparin | 2 | 5.4 |
| 2 | Antihistamine anti-emetics | Cyclizine | 13 | 1.9 |
| 3 | Anti-emetic 5HT3 antagonists | Ondansetron | 28 | 0.9 |
| 4 | Aminoglycosides | Gentamicin | 33 | 0.8 |
| 5 | Electrolytes | Potassium, magnesium | 41 | 0.7 |
| 6 | Vancomycin | 53 | 0.5 | |
| 7 | Amiodarone | 82 | 0.2 | |
| 8 | Antipseudomonal penicillins | Piperacillin-tazobactam | 80 | 0.2 |
| 9 | Nitrofurantoin | 87 | 0.1 | |
| 10 | Oxygen | 88 | 0.1 |
Table 4.
Drugs identified from emergency guidelines included in the core drug list
| Drug, class or BNF grouping | Most commonly recommended example | |
|---|---|---|
| 1 | Acetyl cysteine | |
| 2 | Activated charcoal | |
| 3 | Adenosine | |
| 4 | Calcium resonium | |
| 5 | Epinephrine | |
| 6 | Lidocaine | |
| 7 | Naloxone | |
| 8 | Thrombolytic agents | Streptokinase, rt-PA, tenecteplase |
Stability of core list over 2 years
Primary care
Eight hundred and nineteen million prescriptions from the Prescription Cost Analysis for England 2008 were included in the analysis and compared with 752 million prescriptions in 2006. Ninety-seven drugs were in the 100 most commonly prescribed drugs (‘top 100’) in primary care in both 2006 and 2008. The three drugs or classes that dropped out of the primary care ‘top 100’ in 2008 were benzyl/phenoxymethyl penicillin, compound bronchodilators and anti-motility drugs and their mean rank in 2006 was 80 ± 11. The three drugs that rose into the top 100 in 2008 were lamotrigine, leukotriene receptor antagonists and drugs for dementia and their mean rank in 2008 was 98 ± 2. Drugs or classes in the ‘top 100’ changed 3 ± 4 (mean ± SD) places in rank order between 2006 and 2008 (Figure 1).
Figure 1.
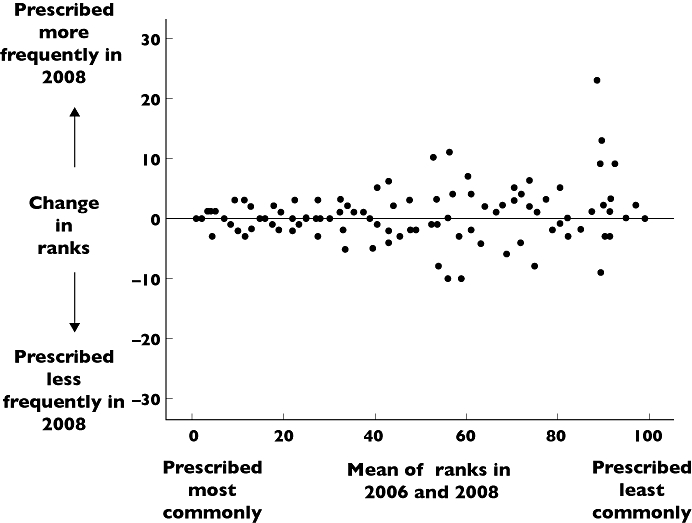
Bland Altman plot comparing rank order of drug prescribing in primary care in 2006 and 2008
Secondary care
Four thousand one hundred and fifty-four prescriptions in one hospital (St George's) from 2009 were compared with 4671 prescriptions from 2007 in the same hospital. Ninety drugs were in the 100 most commonly prescribed drugs (‘top 100’) in both 2007 and 2009. The 10 drugs or classes that dropped out of the hospital ‘top 100’ in 2009 were other beta lactams (aztreonam), drugs for tuberculosis, drugs for dementia, carbonic anhydrase inhibitors, fusidic acid, vaccines, artifical saliva, cough suppressants, thiazolidinediones and bulk laxatives and their mean rank in 2007 was 89 ± 10. The 10 drugs that rose into the top 100 in 2009 were tetracyclines, drugs affecting immune response (chronic bowel disorders), carbamazepine, clindamycin, drugs used as skeletal muscle relaxants, epinephrine, anti-muscarinic drugs used in parkinsonism, antivirals for herpes virus infections, levetiracetam and anti-thyroid drugs and their mean rank in 2009 was 85 ± 11. Drugs or classes in the ‘top 100’ changed 9 ± 9 (mean ± SD) places in rank order between 2007 and 2009 (Figure 2).
Figure 2.
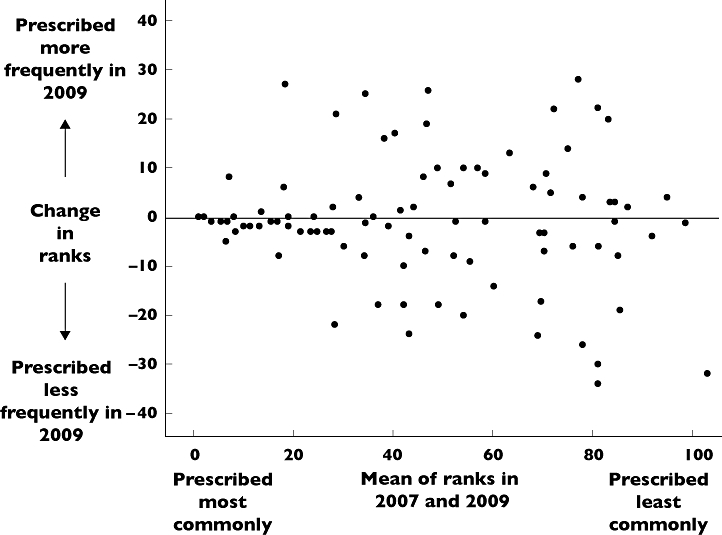
Bland Altman plot comparing rank order of drug prescribing in secondary care in 2007 and 2009
Use of drugs on core list by foundation year 1 (FY1) doctors
One hundred and seventy-nine FY1 doctors (62% female) from 39 hospitals in North East (15 hospitals), North West (14 hospitals), South East (six hospitals) and South West (four hospitals) London commenced the survey. One hundred and forty-eight out of 179 respondents (12% of those contacted) provided information about prescribing patterns. FY1 doctors had prescribed 41 ± 31% drugs on the core list at least weekly, 24 ± 12% at least monthly; 22 ± 17% less than monthly and had never prescribed 12 ± 18% drugs. Seventy-six% of FY1 doctors had not regularly prescribed any drugs outside the core drug list. Drugs prescribed least often were those selected from emergency guidelines for inclusion in the core list (e.g. activated charcoal, thrombolytic agents, class 1 anti-arrhythmics) and those mostly prescribed in primary care (e.g. vaccines, sildenafil).
Association of prescribing frequency with incidence of prescribing errors
There was a strong correlation between prescribing frequency (prescriptions for each drug class expressed as percentage of all prescriptions written) and error rate (errors made when prescribing each drug class expressed as a percentage of all errors made), n= 39 drug classes, r= 0.861, P= 0.000 (Figure 3).
Figure 3.
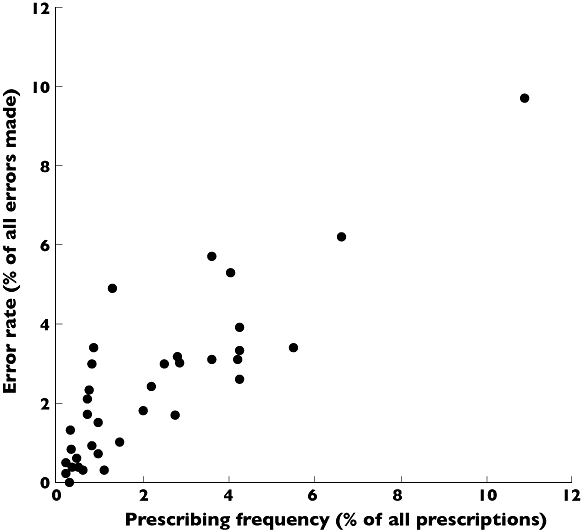
Comparison of frequency of prescribing of drugs or classes with incidence of prescribing errors Each point on the graph represents an individual drug class. The prescribing frequency for each drug class (expressed as percentage of all prescriptions written) is plotted against the error rate for that drug class (expressed as a percentage of all errors made) as described by the EQUIP study [1], n= 39, r= 0.861, P= 0.000
Discussion
We identified a core list of 100 drugs or classes commonly used in primary and secondary care which changed little over 2 years, and demonstrated a strong relationship with drugs most frequently associated with prescribing errors. The stability of the list over time indicates that use of this list to support prescribing training for senior medical students would be relevant for their practice as newly qualified doctors. In support of this, FY1 doctors prescribed 65% drugs on the list at least monthly and 76% FY1 doctors did not regularly prescribe any drugs that were not on the list. The FY1 prescribing survey was conducted 2 years after the original list was developed, providing further evidence for the enduring relevance of this core list.
There was a strong relationship between the frequency of drug prescribing in our study and error rate identified by the EQUIP study [1]. This indicates that error rate is related to workload and that learning focused on commonly-prescribed drugs could have the potential to minimize prescribing errors. The nature of prescribing training delivered around the core drug list requires as much attention as the core list itself.
Consideration of the dual process model of clinical reasoning developed in the cognitive psychology literature has potential to identify a role for the core drug list in prescribing training. The dual process model describes two modes/systems of decision making and judgement that depend on pattern recognition [13]. System 1 processes are intuitive, reflexive and fast and are triggered automatically when a pattern is recognized. These processes require little effort and clinicians spend most of their time in this mode. System 2 processes are triggered when a pattern is not recognized. In this situation analysis and deliberate, slow reasoning are required to make a judgement and considerable effort is required to work in this mode. Although separate, the two processes are linked. Learning and practice convert system 2 to system 1 processes. Feedback, reflection and assessment (system 2 processes) are required from time to time to review and improve system 1 processes. System 1 and system 2 processes require different skills and are associated with different types of error.
Neal Maskrey, Director of Evidence-based Therapeutics at the National Prescribing Centre, suggests that this model can be applied to prescribing. Prescription of familiar drugs uses rapid system 1 processes, e.g. reflex prescription of paracetamol for a patient with mild pain. Prescription of unfamiliar drugs requires more time-consuming system 2 processes such as reference to the BNF, local and national guidelines and consulting with colleagues and pharmacy. A potential role for our core drug list is to support doctors in developing robust system 1 processes for safe and effective prescribing of drugs that will make up the majority of their workload. This must be complemented by development of system 2 processes for dealing with prescribing of unfamiliar drugs.
We found that emergency drugs were not prescribed commonly and are likely to be unfamiliar to newly-qualified doctors. The dual process model indicates that system 2 processes should be used for unfamiliar drugs, but they are unlikely to be appropriate in the emergency situation. We have therefore included emergency drugs in the core list to encourage students and trainees to become familiar with these drugs as part of their learning. Other processes such as easy availability of emergency guidelines, simulation training and pharmacy support are essential to promote effective prescribing in the emergency situation.
Although the core list was essentially stable over 2 years, some drugs moved into and out of the ‘top 100’. Around one quarter of these mobile drugs were antibiotics. Antibiotic prescribing is likely to change more rapidly than prescribing of other drugs due to changing microbial resistance and to vary nationally due to diverse infection control strategies and local resistance patterns. Design of prescribing education needs to take this into account.
Our study does have some limitations. The core list was developed from 752 million prescriptions in primary care but only 7705 prescriptions in secondary care. This discrepancy in numbers reflects the easy availability of electronic prescribing information in primary care, whereas secondary care information was collected manually. However even though secondary care prescription numbers were low, the 100 drugs used most commonly in secondary care remained reasonably consistent over 2 years. Furthermore only 10 drugs on the list were derived from secondary care prescribing data alone.
Primary care prescribing information was collected from England, whereas secondary care prescribing information was collected from two London teaching hospitals. Despite this, the core list appears to have broad applicability. In our FY1 prescribing survey, doctors from 39 hospitals across London prescribed 65% drugs on the list at least monthly and seldom prescribed drugs that were not on the list. The rate of prescribing errors made by doctors in the North West of England [1] was closely related to frequency of prescribing of drugs on the core list. Although our core drug list is based on prescribing practice in England, the majority of drugs also appear on the World Health Organization List of essential medicines [14]. It is therefore likely that our core drug list would be useful and applicable to prescribing training in medical schools outside England, and that English graduates who have based their learning around this list would be equipped to prescribe elsewhere in the world.
Our core list contains 100 drugs, in line with British Pharmacological Society recommendations [6]. However it is likely that this is too many for students and newly-qualified doctors to develop robust system 1 prescribing processes. Figures 1 and 2 show that the lower a drug was ranked in order of prescribing frequency, the more unstable its position was in the rankings. The core list may therefore more appropriately contain 60 or even 40 of the most commonly prescribed drugs.
Implications and future work
We have identified 100 drugs most commonly used in clinical practice and developed an enduring core drug list to support prescribing training. We propose that prescribers should develop robust system 1 skills for prescribing drugs in this list, complemented by system 2 skills for dealing with less familiar drugs. Challenges for the future include developing training programmes and learning resources to support prescribing training in this model and evaluating the effect of such training on prescribing errors and patient safety.
Acknowledgments
Primary care prescribing information was obtained from the NHS Health and Social Care Information Centre and is included in this paper with their kind permission.‘Copyright © 2009, Re-used with the permission of The Health and Social Care Information Centre. All rights reserved’.
The authors thank Neal Maskrey, Director of Evidence-based Therapeutics at the National Prescribing Centre for introducing them to the dual process model of clinical reasoning.
Competing Interests
There are no competing interests to declare.
There was no funding for this study. The researchers were therefore completely independent of any funding body.
REFERENCES
- 1. Available at http://www.gmc-uk.org/about/research/research_commissioned_4.asp (last accessed 9 November 2010)
- 2.Lewis PJ, Dornan T, Taylor D, Tully MP, Wass V, Ashcroft DM. Prevalence, incidence and nature of prescribing errors in hospital inpatients: a systematic review. Drug Saf. 2009;32:379–89. doi: 10.2165/00002018-200932050-00002. [DOI] [PubMed] [Google Scholar]
- 3.Tully MP, Ashcroft DM, Dornan T, Lewis PJ, Taylor D, Wass V. The causes of and factors associated with prescribing errors in hospital inpatients: a systematic review. Drug Saf. 2009;32:819–36. doi: 10.2165/11316560-000000000-00000. [DOI] [PubMed] [Google Scholar]
- 4. Available at http://apps.who.int/medicinedocs/en/d/Jwhozip23e/4.html (last accessed 9 November 2010)
- 5.De Vries TP, Daniels JM, Mulder CW, Groot OA, Wewerinke L, Barnes KI, Bakathir HA, Hassan NA, Van Bortel L, Kriska M, Santoso B, Sanz EJ, Thomas M, Ziganshina LE, Bezemer PD, Van Kan C, Richir MC, Hogerzeil HV. Should medical students learn to develop a personal formulary? : An international, multicentre, randomised controlled study. Eur J Clin Pharmacol. 2008;64:641–6. doi: 10.1007/s00228-008-0465-y. [DOI] [PMC free article] [PubMed] [Google Scholar]
- 6.Maxwell S, Walley T. Teaching safe and effective prescribing in medical schools: a core curriculum for tomorrow's doctors. Br J Clin Pharmacol. 2003;55:496–503. doi: 10.1046/j.1365-2125.2003.01878.x. [DOI] [PMC free article] [PubMed] [Google Scholar]
- 7.Maxwell SR, McQueen DS, Ellaway R. eDrug: a dynamic interactive electronic drug formulary for medical students. Br J Clin Pharmacol. 2006;62:673–81. doi: 10.1111/j.1365-2125.2006.02777.x. [DOI] [PMC free article] [PubMed] [Google Scholar]
- 8. Available at http://www.ic.nhs.uk/statistics-and-data-collections/primary-care/prescriptions/prescription-cost-analysis-2006 (last accessed 9 November 2010)
- 9. Available at http://www.ic.nhs.uk/statistics-and-data-collections/primary-care/prescriptions/prescription-cost-analysis-2008 (last accessed 9 November 2010)
- 10. Available at http://www.sgul.ac.uk/services/library/e-books/grey-book-53rd-edition.pdf (last accessed 9 November 2010)
- 11.British National Formulary. September 2009.
- 12. Available at http://www.nres.npsa.nhs.uk (last accessed 9 November 2010)
- 13.Croskerry P. Clinical cognition and diagnostic error: applications of a dual process model of reasoning. Adv Health Sci Educ. 2009;14:27–35. doi: 10.1007/s10459-009-9182-2. [DOI] [PubMed] [Google Scholar]
- 14. Available at http://www.who.int/medicines/publications/essentialmeds_committeereports/TRS946_EMedLib.pdf (last accessed 9 November 2010)