Abstract
Background
Activating mutations of the epidermal growth factor receptor (EGFR) confer sensitivity to the tyrosine kinase inhibitors (TKi), gefitinib and erlotinib. We analysed EGFR expression, EGFR mutation status and gene expression profiles of prostate cancer (PC) to supply a rationale for EGFR targeted therapies in this disease.
Methods
Mutational analysis of EGFR TK domain (exons from 18 to 21) and immunohistochemistry for EGFR were performed on tumour tissues derived from radical prostatectomy from 100 PC patients. Gene expression profiling using oligo-microarrays was also carried out in 51 of the PC samples.
Results
EGFR protein overexpression (EGFRhigh) was found in 36% of the tumour samples, and mutations were found in 13% of samples. Patients with EGFRhigh tumours experienced a significantly increased risk of biochemical relapse (hazard ratio-HR 2.52, p=0.02) compared with patients with tumours expressing low levels of EGFR (EGFRlow). Microarray analysis did not reveal any differences in gene expression between EGFRhigh and EGFRlow tumours. Conversely, in EGFRhigh tumours, we were able to identify a 79 gene signature distinguishing mutated from non-mutated tumours. Additionally, 29 genes were found to be differentially expressed between mutated/EGFRhigh (n=3) and mutated/EGFRlow tumours (n=5). Four of the down-regulated genes, U19/EAF2, ABCC4, KLK3 and ANXA3 and one of the up-regulated genes, FOXC1, are involved in PC progression.
Conclusions
Based on our findings, we hypothesize that accurate definition of the EGFR status could improve prognostic stratification and we suggest a possible role for EGFR-directed therapies in PC patients. Having been generated in a relatively small sample of patients, our results warrant confirmation in larger series.
Background
Prostate cancer (PC) is among the most frequently diagnosed solid tumours in men, and the metastatic forms still represent the second leading cause of cancer-related death [1,2]. Treatment of PC by radical prostatectomy, radiotherapy and anti-androgen therapy results in long term survival in patients with localized and androgen-dependent PC. By contrast, hormone-refractory prostate cancer (HRPC) forms are associated with disease relapse and poor patient survival [3,4]. At present, increasing serum prostate-specific antigen (PSA) levels following treatment of primary PC is used to identify PC biochemical relapse, a condition that anticipates clinically detectable tumour progression. The identification of novel biomarkers that predict the risk of relapse or that could be used as therapeutic targets is needed.
The molecular mechanisms responsible for PC development, progression and hormone-independence are not clear yet. Several findings suggest that alterations of different pathways involving growth factor receptors play a role in this multistep process [5,6]. In particular, the Epidermal Growth Factor Receptor (EGFR) is frequently overexpressed in PC and this is associated with a more aggressive clinical outcome. EGFR overexpression has also been linked to the transition from androgen-responsiveness to the androgen-independent/hormone-refractory phenotype [7,8]. Furthermore, preclinical data have suggested that the EGFR signalling pathway can activate the androgen receptor under conditions of clinical androgen deprivation [9]. EGFR has thus assumed considerable importance, due to overexpression in different tumour types and to its role as a drug target. A variety of anti-EGFR drugs are currently Food and Drug Administration-approved or under evaluation in clinical trials. These drugs include small inhibitory molecules such as gefitinib or erlotinib, as well as antibodies such as cetuximab and panitumumab. Gefitinib is an oral anilinoquinazolone compound that blocks the EGFR tyrosine kinase (TK) activity [10] resulting in the inhibition of downstream signalling pathways. Clinical evidence, mostly deriving from non small cell lung cancer (NSCLC) patients, demonstrated that activating mutations in the EGFR TK domain (exons from 18 to 21) predict response to gefitinib [11].
A recent study identified 4 novel missense mutations in exons 19, 20 and 21 of the EGFR TK domain in Korean and Caucasian PC patients. Three of them, G735S, G796S and E804G, led to an oncogenic activation promoting cell proliferation and invasion [12].
Preclinical studies have shown activity of gefitinib against PC cell lines and xenografts [13]. In a phase I clinical trial, 252 patients with different solid tumours, including 28 patients with HRPC, received oral gefitinib [14]. One patient with HRPC had a measurable reduction of disease in a lymph node metastasis, palliation of disease-related pain, and a reduction in PSA [15]. In another randomized phase II clinical trial 82 HRPC patients were treated with prednisone plus gefitinib or prednisone plus placebo [16]. This study showed limited antitumour activity of gefitinib in HRPC patients. However, patients were not selected on the basis of EGFR status. At present, no clinical data are available on EGFR-mutated PC patients treated with gefitinib.
In an effort to provide a rationale for further studies of targeted therapies in PC, we set out to analyze EGFR protein expression, EGFR mutations and their possible correlations with clinical parameters and outcomes. For 51 of these samples we also carried out gene expression profiling with oligo-microarrays.
Methods
Samples
One hundred glyofixx-fixed, paraffin-embedded PC specimens were retrieved after radical prostatectomy in 100 PC patients. According to the availability of fresh frozen tumour material, different subsets of the initial 100 patients selected for this analysis were studied. Immunohistochemistry and mutational analysis were performed in all the samples from 100 patients.
Fifty patients had tumour samples stored at -80°C and were submitted to gene profiling. For one of these patients, two different tumour samples were available. Therefore, the total number of samples submitted to gene profiling was 51.
The patients were of Italian origin and were diagnosed at ASL (Azienda Sanitaria Locale) 12, Hospital of Biella. To classify tumours according to grade, we used the definition proposed by Franiel et al [17]. Tumours with a Gleason Score from 4 to 6 were considered low grade and those with a Gleason Score from 7 to 9 were considered high grade.
DNA extraction and direct sequencing
For all the specimens, it was possible to select tumour areas and extract DNA for EGFR mutational analysis. Genomic DNA was extracted from deparaffinised tumour tissue using the QIAamp DNA Mini Kit (Qiagen, Milan, Italy) following the manufacturer's instructions. The TK domain of EGFR coding sequence, from exon 18 to 21, was amplified by using primers and nested PCR conditions as previously described by Lynch et al [18]. PCR products were purified by QIAquick PCR purification kit (Qiagen) and sense and antisense sequences were obtained by using forward and reverse internal primers, respectively. Each exon was sequenced using the BigDye Terminator Cycle sequence following the PE Applied Biosystem strategy and Applied Biosystems ABI PRISM3100 DNA Sequencer (Applied Biosystem, Forster City, CA). All mutations were confirmed by performing two independent PCR amplifications.
Immunohistochemistry
EGFR protein expression was evaluated on the entire cohort. Tissue sections (3 μm thick) were mounted on pre-coated slides, deparaffinised with xylene and rehydrated with graded ethanol. Endogenous peroxidase was blocked with Peroxidase Blocking Solution (DAKO, CA, USA) for 5 minutes. Sections were then incubated with primary antibody for EGFR (1:200, Clone: 31G7, Mouse anti-Human, Zymed) for one hour at room temperature. The reaction was visualised using EnVision staining kit (DAKO). Sections were counterstained with hemallume. About 100 cells were counted in three different fields. All slides were independently evaluated by two pathologists (L.M. and B.T.). Discordant cases were reviewed a third time and a consensus was reached. Basal EGFR expression (EGFRlow) was defined as 10-49% of tumour cells staining positively for EGFR. High EGFR expression (EGFRhigh) was defined as ≥50% of tumour cells staining positively for EGFR.
Microarray analysis
Gene expression profiling was evaluated for 51 samples from 50 patients (two specimens were analysed for one patient) as previously described [19]. Briefly, total RNA was isolated from sections of frozen tissues obtained from 50 radical prostatectomies collected between 2003-2005, using TriReagent (Sigma, St. Louis, MO, USA). A commercially available RNA sample from 32 normal prostates pooled from Caucasian males (ages: 21-50), constituted the prostate RNA Reference (Clontech, Mountain View, CA, USA). RNA quantity was evaluated by Bioanalyzer 2100 (Agilent Technologies, Palo Alto, CA, USA). Following the isolation procedure, mRNA was amplified starting from 5 μg of total RNA using MessageAmp aRNA Amplification kit (Ambion Inc. Austin TX, USA). Amino-allyl modified nucleotides were incorporated during the overnight in vitro transcription step according to the manufacturer's protocol. Labeling was performed using NHS (N-hydroxysuccinimidyl) ester Cy3 or Cy5 dyes (GE Healthcare Europe GMBH, Upsala-Sweden) able to react with the modified RNA. At least 5 μg of aaRNA for each sample were labeled and then purified with columns; 0.75 μg of labeled aaRNA for each sample were then hybridised. The Dye-Swap replication procedure was applied, in order to increase accuracy. Samples were hybridised on 22K human oligo-glass arrays, (Agilent Technologies). Arrays were scanned by Agilent scanner. Images obtained were analysed by the Feature Extraction software Agilent (version 9.5) and the text files were then processed using the Bioconductor package Limma (Linear models for microarray analysis). Class comparison and unsupervised hierarchical clustering were carried out using MeV (Multi Experiment Viewer) version 4.1 (http://www.tm4.org). In particular, non parametric testing (Wilcoxon, Rank Sum) was adopted for feature selection. Gene Ontology analysis was performed using the Database for Annotation, Visualization and Integrated Discovery (DAVID tool), (http://david.abcc.ncifcrf.gov).
Real time quantitative PCR (qRT-PCR)
RNA was extracted and transcribed into cDNA using High capacity cDNA reverse transcription kit (PE Applied Biosystem). cDNA was then used for amplification of ABCC4, ANXA3, FOXC1, KLK3, U19 genes and PGK gene (housekeeping gene) with the following specific primers: FW ABCC4 5'-AGAGGGTGTCAGAGGCAATC-3', RV ABCC4 5'-CATCAAGTAGCAAAAAGGTCT-3'; FW ANXA3 5'- GTTGGACACCGAGGAACAGT, RV ANXA3 5'- GCTGTGCATTTGACCTCTCA-3'; FW FOXC1 5'- TAGCTGTCAAATGGCCTTC, RV FOXC1 5' - TAGTTCGGCTTTGAGGGTGT - 3'; FW KLK3 5'-TCCCAGACGTGGATTGGT-3', RV KLK3 5'-CAGGGTTGGGAATGGTTCT-3'; FW U19 5'- CAGGGAATTGTGTCTCAGGAC-3', RV U19 5'- GGCCACTGTTGTCTCGAAAT - 3'. Real-time PCR was carried out in triplicate in optical grade 96-well plates with 5 μl SYBR Green Master mix (PE Applied Biosystems), 12.5 μM of each primer, and 35 ng of cDNA in a volume of 60 μl. Thermal cycling was performed using the Applied Biosystems 7300 real-time PCR system with the following conditions: 95°C for 10 min, 40 cycles at 95°C for 15 sec, 60°C for 1 min. Relative quantitation of target genes was obtained by using the comparative cycle threshold (Ct) methods as previously described [20]. Briefly, to calculate the relative expression of the target gene mRNA normalized to PGK, the average of target Ct was subtracted from the average of PGK Ct (ΔCt). The amount of target, normalized to an endogenous reference and relative to a calibrator (fold-change) is given by 2-ΔΔCt where the calculation of ΔΔCt involves subtraction by the ΔCt calibrator value (EGFRlow). Assuming that ΔCt = 3.3 corresponds to a 10-fold difference of expression between PGK and the target, as calculated from log 10, ΔCt results were divided by 3.3 and represented on a logarithmic scale.
Statistics
Comparisons between dichotomous variables were performed by the Fisher's exact test.
Time to biochemical relapse (TTBR) was calculated from the date of prostate cancer surgery to that of biochemical relapse, defined as a serum PSA level > 0.2 ng/ml in at least 2 subsequent measurements performed ≥3 months from prostatectomy [21]. Univariate comparisons of time to biochemical relapse (TTBR) according to EGFR immunohistochemical status, mutational status, disease stage and Gleason Score group were performed by Cox Proportional Hazards analysis and by drawing Kaplan-Meier curves, which were compared by the log-rank test. If more than one factor resulted significantly associated with TTBR at the p < 0.10 level, a multivariate Cox Proportional Hazards model including the significant factors was studied.
Results
Clinical parameters and EGFR expression on PC specimens
The characteristics of 100 patients with tumours available for analysis of EGFR expression and mutations are summarized in table1 and in additional file1, table S1.
Table 1.
Patient characteristics
| Variable | Value (%) n = 100 |
|---|---|
| Median age, years (range) | 66 (53-74) |
| T status | n = 98 |
| T2 | 71 (72.44) |
| T3 | 26 (26.54) |
| T4 | 1 (1.02) |
| Gleason Score | n=100 |
| G 4 | 1 (1) |
| G 5 | 5 (5) |
| G 6 | 12 (12) |
| G 7 | 52 (52) |
| G 8 | 22 (22) |
| G 9 | 8 (8) |
One hundred PC samples were evaluated for EGFR protein expression by immunohistochemistry. EGFR immunostaining was predominantly found in the membrane and the cytoplasm. EGFR was expressed at low levels in normal glands in 90 out of 100 samples (90%), and in 36 out of 100 cases (36%), tumour areas were classified as overexpressing EGFR (EGFRhigh) (additional file 1, table S1). Figure1 provides an example of the immunohistochemical pattern of EGFR protein expression in normal and tumour tissues. The impact of clinical and pathological variables on biochemical relapse was studied in a subgroup of 59 patients who underwent regular visits at the same Institution where they had undergone surgery, and for whom we had detailed follow-up information. The median follow-up for these patients was 207 months (range 16-366 months). The other 41 patients, who underwent follow-up visits at different Institutions after surgery, were excluded from this analysis because of incomplete or missing follow-up information. Twenty-eight out of 59 patients experienced biochemical relapse (overall median TTBR 84 months). Univariate analyses revealed a significant effect of EGFR immunohistochemical status on TTBR (figure2). Median TTBR was 104 and 30 months for patients with EGFRlow and EGFRhigh tumours, respectively (hazard ratio-HR 2.53, p= 0.02). Furthermore, a strong trend towards a worse median TTBR was observed in patients with high vs low Gleason Score tumours (63 months vs not reached respectively, HR 2.80, p= 0.10) (figure3). Neither median age nor tumour stage at diagnosis correlated significantly with TTBR. When EGFR immunohistochemical status and Gleason Score were entered together in a Cox Proportional Hazards model, results did not change significantly, suggesting that EGFR immunohistochemical status (multivariate HR 2.67, p = 0.01) and Gleason Score (multivariate HR 3.04, p = 0.08) were independent predictors of TTBR.
Figure 1.
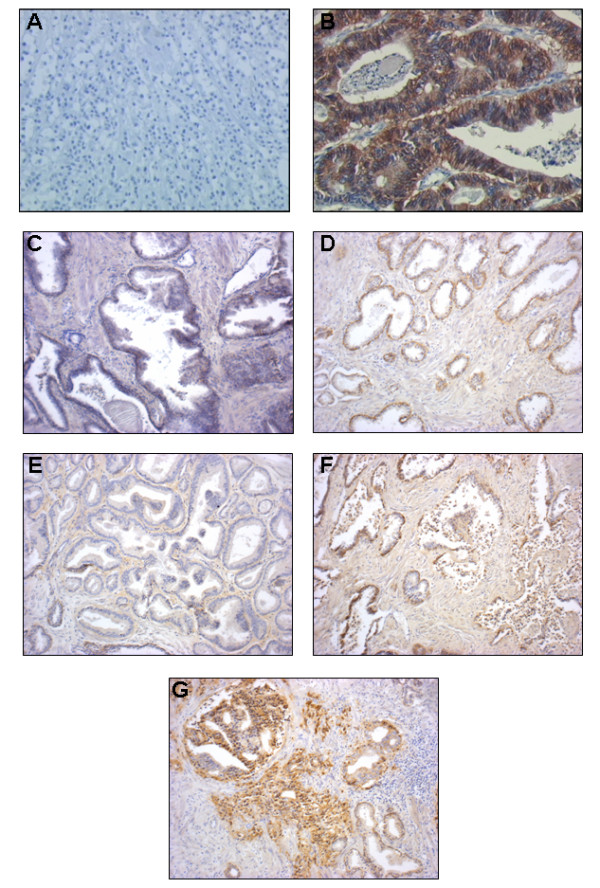
Different EGFR pattern of expression in normal and PCs tissues revealed by immunohistochemistry. A: negative control: lobular breast carcinoma not expressing EGFR. B: positive control: colon carcinoma expressing high levels of EGFR. C: normal prostate tissue not expressing EGFR. D: normal prostate tissue expressing EGFR. E: PC tissue not expressing EGFR. F-G: PC tissues expressing different pattern of EGFR. (Magnification 10X).
Figure 2.
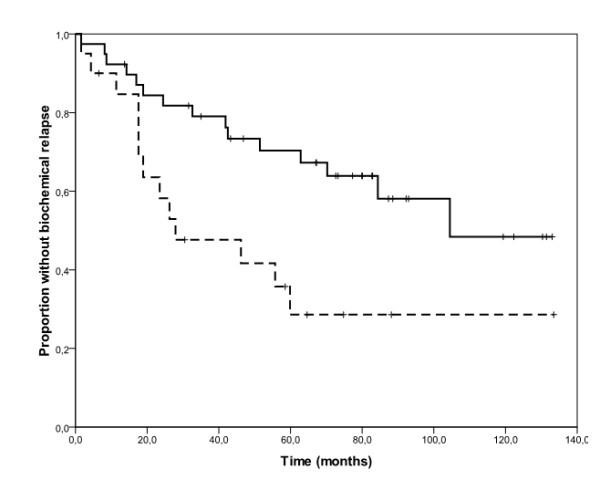
Kaplan-Meier estimates of time to biochemical relapse according to EGFR immunohistochemical status. The solid line represents patients with EGFRlow tumours and the dashed line represents those with EGFRhigh tumours. Median time to biochemical relapse was 104 and 30 months for patients with EGFRlow and EGFRhigh tumours, respectively (log-rank test, p=0.01).
Figure 3.
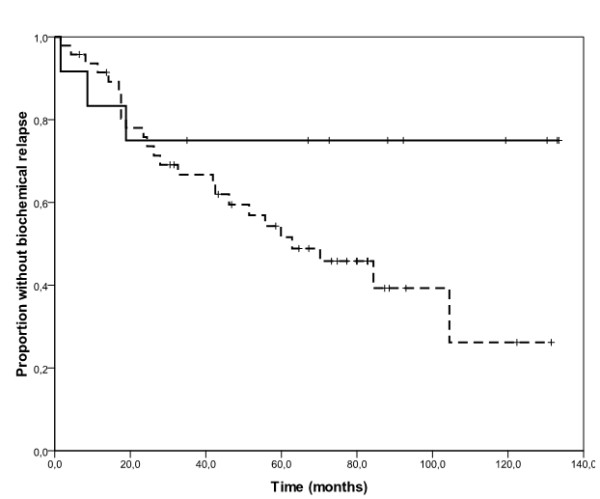
Kaplan-Meier estimates of time to biochemical relapse according to Gleason Score category. The solid line represents patients with low score tumours and the dashed line represents those with high score tumours. Median time to biochemical relapse was not reached for patients with low score tumours and was 63 months for those with high score tumours (log-rank test, p=0.08).
Mutational analysis
Of 100 patients who underwent surgical resection of their tumours, 13 presented point mutations (13%) in the TK domain of EGFR (Table 1). Specifically, we detected 2 point mutations in exon 19: T751I, previously described in erlotinib responsive NSCLC patients [22] and R748K, described in soft tissue sarcomas [23]. In exon 20, we found 5 point mutations: E804G, already described in PC [12], Q820R, G796V, P782L, F788L, not previously described. In exon 21, 4 novel missense mutations were revealed: L828M, F856Y, F856L, A839V, and 2 previously described, G863D, in partial gefitinib responsive NSCLC patients [24], and V851I, described in gefitinib-unresponsive NSCLC patients [25]. No point mutations were identified in exon 18. Table2 summarised all mutations found. Fifty-eight out of 100 specimens had the same silent mutation, both in heterozygotic and in homozygotic status, on the codon 787 in exon 20. No mutations were found in the normal counterpart. The frequency of mutations was not significantly different in EGFRhigh vs EGFRlow tumours (6% vs 7%, respectively, p=0.50); all mutated samples had a high Gleason Score (13%), but no statistically significant association was revealed (p= 0.12). Finally, the mutation status had no significant impact on TTBR, although it should be noted that only 5 patients with mutated tumours were included in this analysis.
Table 2.
Summary of EGFR mutations found in our work and respective references if previously described.
| EXON 19 | ||
|---|---|---|
| Patient 50 | T751I | Described by Tsao et al |
| Patient 63 (P51) | R748K | Described by Dobashi et al |
| EXON 20 | ||
| Patient 12 | E804G | Described by Cai et al |
| Patient 64 (AA65) | Q820R | Novel mutation |
| Patient 72 (CC62) | P872L | Novel mutation |
| Patient 73 (CC75) | F788L | Novel mutation |
| Patient 99 | G796V | Novel mutation |
| EXON 21 | ||
| Patient 2 | V851I | Described by Cappuzzo et al |
| Patient 8 | G863D | Described by Bell et al |
| Patient 11 | A839V | Novel mutation |
| Patient 40 | L828M | Novel mutation |
| Patient 56 | F856Y | Novel mutation |
| Patient 88 | F856L | Novel mutation |
Gene profiling
Gene expression profile analysis was performed in 51 fresh frozen samples from 50 patients.
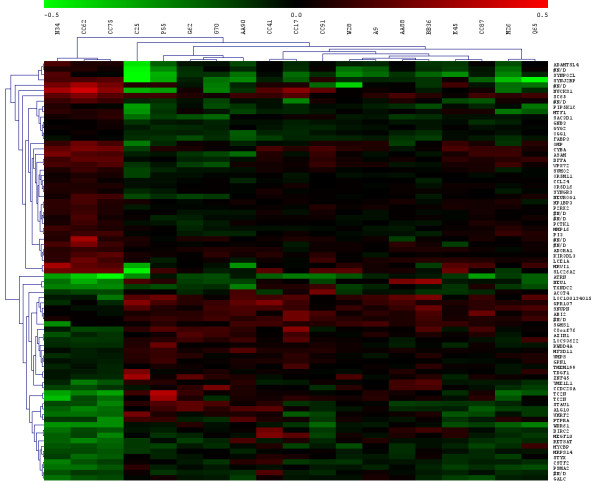
Nineteen samples were EGFRhigh and 32 displayed a basal expression of EGFR. Comparison between these two classes did not give significant results in terms of differentially expressed genes. Analysing only the EGFRhigh samples, a 79-gene signature (40 up-regulated and 39 down-regulated) distinguished EGFRhigh/mutated samples from EGFRhigh/WT samples (figure 4 and additional file 2, table S2). In order to identify in which processes these genes are implicated, a Gene Ontology analysis was performed. Three biological processes are involved, namely cellular lipid metabolism, primary metabolism and the inflammatory response (Table 3).
Figure 4.
Cluster analysis applied to EGFRhigh: a 79-gene signature separated EGFRhigh/mutated samples(N34, CC62, CC75)from EGFRhigh/WT samples. (G70, C25, A9, E45, M26, AA88, AA90, BB36, CC17, CC41, CC87, CC91, G62, P55, Q65, W28). (N34, CC62, CC75, G70, C25, A9, E45, M26, AA88, AA90, BB36, CC17, CC41, CC87, CC91, G62, P55, Q65, W28 referred to patients code as in additional file 1, table S1)
Table 3.
Gene Ontology of the 79 modulated probes in EGFRhigh/mutated compared to EGFRhigh/WT.
| Category | Term | P-value | Genes (Entrez ID |
|---|---|---|---|
| GOTERM_BP_ALL | GO:0044255~cellular lipid metabolic process | 0.03 | 122970, 2581, 54884, 23396, 2170, 259230 |
| GOTERM_BP_ALL | GO:0044238~primary metabolic process | 0.07 | 134, 122970, 5127, 1478, 4520, 2581, 7596, 54884, 115426, 10730, 4968, 4762, 7372, 6944, 26292, 23396, 84203, 8908, 6613, 2170, 4325, 259230, 51582, 6815, 63931, 6997, 10073, 5689, 1676, 5786 |
| GOTERM_BP_ALL | GO:0006954~inflammatory response | 0.09 | 134, 8455, 6369, 259230 |
For 8 of the 13 cases harbouring an EGFR TK mutation fresh frozen tissue was available for gene expression analysis. In these samples we could identify a panel of 29 genes which were differentially expressed between EGFRhigh and EGFRlow tumours (Table4). Figure5 shows the significant distinction of the two classes obtained from this 29-gene signature.
Table 4.
Differentially expressed genes selected in samples mutated for EGFR TK domain.
| EntrezGene | Gene Name | Description | Log10Ratio * |
|---|---|---|---|
| 2952 | GSTT1 | Glutathione S-transferase theta-1 | ↓ |
| 10257 | ABCC4 | Multidrug resistance-associated protein 4 | ↓ |
| 1657 | DMXL1 | DmX-like protein 1 | ↓ |
| 25800 | SLC39A6 | Zinc transporter ZIP6 Precursor | ↓ |
| 55840 | EAF2 | ELL-associated factor 2 | ↓ |
| 354 | KLK3 | Prostate-specific antigen Precursor (PSA) | ↓ |
| 81035 | COLEC12 | Collectin-12 (Collectin placenta protein 1) | ↓ |
| 10788 | IQGAP2 | Ras GTPase-activating-like protein | ↓ |
| 123036 | MTAC2D1 | Tandem C2 domains nuclear protein | ↓ |
| 3150 | HMGN1 | Non-histone chromosomal protein HMG-14 | ↓ |
| 55359 | STYK1 | Tyrosine protein-kinase | ↓ |
| 64757 | MOSC1 | MOSC domain-containing protein 1, mitochondrial Precursor | ↓ |
| 5269 | SERPINB6 | Serpin B6 (Placental thrombin inhibitor) | ↓ |
| 1066 | ANXA3 | Annexin A3 | ↓ |
| 652708 | CES1 | Liver carboxylesterase 1 Precursor | ↑ |
| 220164 | DOK6 | Docking protein 6 (Downstream of tyrosine kinase 6) | ↑ |
| 2296 | FOXC1 | Forkhead box protein C1 | ↑ |
| 219699 | UNC5B | etrin receptor UNC5B Precursor | ↑ |
| 2070 | EYA4 | Eyes absent homolog 4 | ↑ |
| 10964 | IFI44L | Interferon-induced protein 44-like | ↑ |
| 678 | ZFP36L2 | Butyrate response factor 2 | ↑ |
| 64710 | NUCKS1 | Nuclear ubiquitous casein and cyclin-dependent kinases substrate (P1) | ↑ |
| 10365 | KLF2 | Krueppel-like factor 2 | ↑ |
| 1783 | DYNC1LI2 | Cytoplasmic dynein 1 light intermediate chain 2 | ↑ |
| 79884 | MAP9 | Microtubule-associated protein 9 | ↑ |
| 2813 | GP2 | Pancreatic secretory granule membrane major glycoprotein GP2 Precursor | ↑ |
| 22888 | UBOX5 | RING finger protein 37 | ↑ |
* Log10Ratio: logarithm (base 10) of the ratio between PC sample and prostate reference expression values. ↑: up regulated gene. ↓: down-regulated gene
Figure 5.
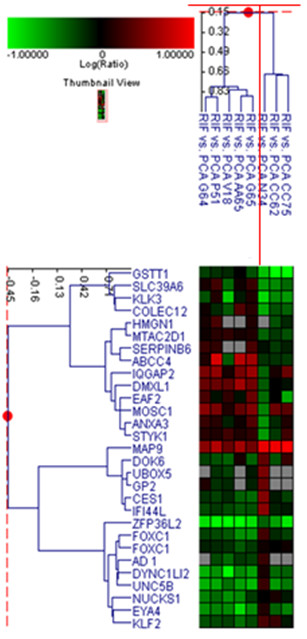
Cluster analysis applied to 8 EGFR-mutated samples using the 29-gene signature distinguished two classes. On the left branch, EGFRlow samples and on the right branch EGFRhigh samples.
In particular, 5 of these genes are involved in prostate cancer progression and most of them are AR (androgen receptor) regulated. Among them, U19, ABCC4, ANXA3 and KLK3 are less expressed in EGFRhigh samples. One of the more expressed genes in EGFRhigh samples is FOXC1, a member of forkhead transcription factors (FOX) (figure6).
Figure 6.
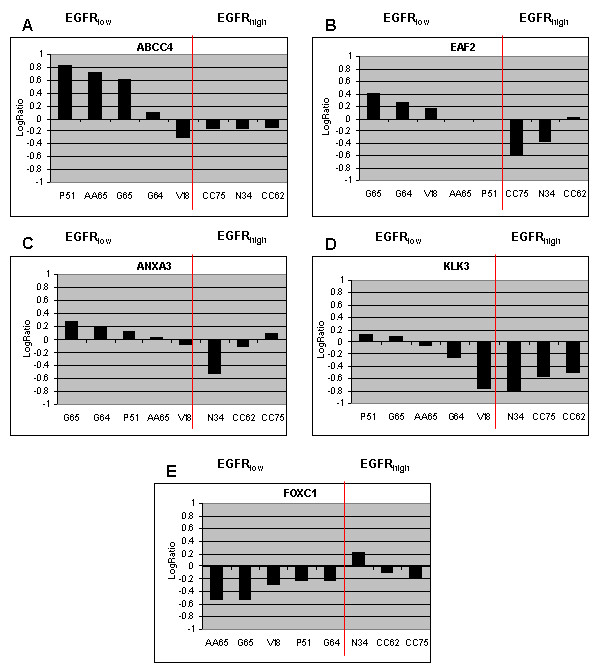
Different modulation of selected genes between mutated and EGFRlow (AA65, G64, G65, V18, P51) and mutated and EGFRhigh samples (N34, CC62, CC75) obtained by microarray analysis. A significant distinction between EGFRhigh samples and EGFRlow samples was found. (AA65, G64, G65, V18, P51, N34, CC62, CC75 referred to patients code as in additional file 1, table S1)
Quantitative RT-PCR on 8 EGFR mutated samples confirmed results obtained by microarray analysis on the five differentially expressed genes discussed above (figure 7).
Figure 7.
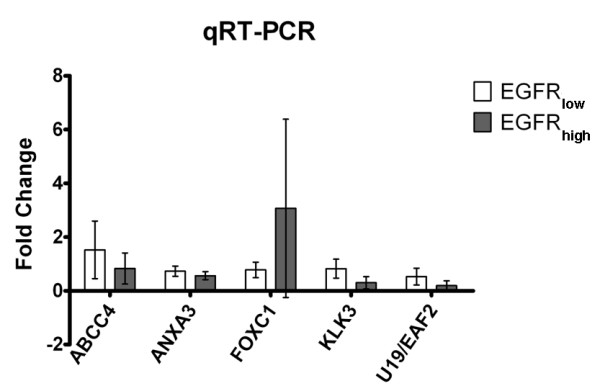
Differentially expressed genes identified by microarray analysis were validated by relative qRT-PCR. White bars represent the average mRNA levels of each gene in EGFRlow class; gray bars represent the average mRNA levels of each gene in EGFRhigh class. Fold-change was calculated as described in "methods" section.
Discussion
In this study, we were interested in analysing EGFR expression and somatic mutations of its TK domain in prostatectomy specimens from patients with operable PC. Metastatic PC represents a challenge for the oncologist and novel therapeutic strategies are therefore warranted, especially when it evolves into the hormone-refractory status. Previous observations have pointed to deregulated EGFR function as a potentially relevant phenomenon in sustaining PC progression and the development of a hormone-refractory phenotype [7,8]. However, EGFR targeting agents have shown limited clinical activity in clinical trials conducted in PC patients [16,26-29]. Notably, these studies enrolled unselected patients with respect to EGFR status. EGFR targeting with TKIs, such as gefitinib and erlotinib [10,30], has proven successful in molecularly defined subsets of patients with non-small cell lung cancer (NSCLC), where specific mutations of the EGFR tyrosine kinase domain, but not protein expression, were predictive of the clinical efficacy [31]. Defining the relationship between EGFR status and the clinical behaviour of PC may therefore help define a possible therapeutic role of EGFR inhibitors in this patient subset.
In our study, we found that EGFR was expressed at normal levels in healthy prostate cells in 90% of the surgical specimens. In tumour areas, EGFR overexpression was found in 36 patient specimens (36%). In line with the literature, we confirmed that EGFR overexpression was significantly associated with biochemical relapse. Furthermore, although confirmation in a larger dataset is needed, EGFR overexpression predicts TTBR independently from Gleason Score, which is an established prognostic factor in this disease.
Having only analysed an Italian Caucasian population, and due to a small sample size, this incidence of EGFR overexpression is difficult to generalize. It has been shown, for example, that Afro-American patients affected by PC expressed EGFR at higher levels than Caucasian patients [32].
Mutational analysis revealed that 13 out of 100 patients had tumours carrying mutations in the EGFR TK domain. Two of these mutations (exon 19 T751I and exon 21 G863D) have been previously identified as predictors of response to small TKIs in NSCLC patients [22,23]. Another one, the V851I mutation, has been previously described in NSCLC patients refractory to TKIs treatment [24]. The E804G mutation that we found on exon 20, was previously described by Cai et al. in PC specimens [12]. These authors identified four novel somatic mutations in the EGFR tyrosine kinase domain of PC patients: G735S, G796S, E804G and R841K. They investigated their oncogenic potential by establishing stable clonal NIH3T3 cells expressing these mutations and WT EGFR to determine their ability to increase cell proliferation and invasion. Amongst them, the E804G mutation resulted as the most active and significant somatic missense mutation in the TK domain, being associated with the greatest growth potential, and by the highest transformation and invasion ability [12]. Q820R, G796V, P782L, F788L, A839V, L828M, F856Y, F856L are novel mutations and further exploration of their effect on the activation of the downstream EGFR pathway is warranted.
Gene expression profile analysis failed to identify genes that were differently expressed in tumours with high vs low levels of EGFR, or in EGFR mutated vsnon mutated tumours. The small sample size and the heterogeneity of mutations may have limited the ability of this analysis to capture significant gene expression patterns. Interestingly, when we restricted the analysis to EGFR-overexpressing tumours (EGFRhigh), we could identify a 79 gene signature distinguishing mutated from non mutated samples. Three biological processes (lipid and primary metabolic processes and the inflammatory response) are altered and they may help discriminate between the two classes. Further studies could reveal the role of EGFR mutations in the regulation of these specific genes. Another 29 genes were found to be differently modulated in mutated tumours according to their EGFR expression level (high vs low). Four of the genes that were expressed at lower levels in EGFRhigh samples have been previously linked to PC. The expression of U19/EAF2 in xenograft prostate tumours markedly induced apoptosis and inhibited tumour growth in vivo [33]. Moreover, the disruption of androgen-dependent growth regulation via U19/EAF2 down-regulation has been found to be commonly associated with PC progression. These observations suggest that U19/EAF2 may act as a tumour suppressor gene. Another finding revealed that the prostate specific ATP-binding cassette transporters ABCC4 was found to be expressed at higher levels in PC than in benign prostate tissue and decreased expression was found after androgen ablation [34]. Zhao et al. found a marked reduction in KLK3 expression levels in androgen-independent, compared with androgen-sensitive PC cell lines [35]. Finally, it was demonstrated that ANXA3 protein expression decreases from benign prostatic hypertrophy to localised pre-neoplastic lesions [36]. Among the genes that we found to be expressed at higher levels in EGFRhigh tumours, one has been previously linked to PC. FOXC1, a member of forkhead transcription factors (FOX), was found to be expressed at significantly high levels in androgen-independent PC xenografts [37]. Our data, which are mostly concordant with previous observations, suggest that EGFR overexpression may result in a more aggressive tumour behaviour [38], through deregulated function of these genes.
We acknowledge that these are preliminary data based on a small number of cases [12,39], with consequent limitations in the generalizability of our results. For example, the prevalence of EGFR mutations that we have found is in the range of that reported by other authors analyzing PC or cholangiocarcinoma [12,40]. Compared to other EGFR-driven diseases like NSCLC, where the prevalence of EGFR mutations has been reported to be as high as 30%, in PC EGFR mutations are less frequent. A larger sample size is therefore required to collect sufficient mutated cases to perform a more powerful analysis of the impact of mutations on prognosis or other biological features of tumours. Similarly, a larger number of mutated cases may result in the ability of gene expression analysis to capture significant gene expression patterns. In our study, because of the limited availability of fresh frozen material, the gene expression profile analysis was feasible in tumour samples from just 8 patients.
In summary, we found that 36% of the patients in this series had EGFR-overexpressing tumours and that this feature was significantly associated with biochemical relapse. Of the 13 tumours harbouring an EGFR mutation, all belonged to the high Gleason Score group. Of the identified mutations, some have been previously shown to predict the antitumor activity of small molecule tyrosine-kinase inhibitors. Further investigations on the novel mutations that we have identified may reveal new therapeutic targets. Finally, we identified a gene list in EGFR-mutated patients associated with EGFR expression.
Conclusions
Although obtained in a small series of PC patients, our findings suggest that accurate definition of the EGFR status could improve prognostic stratification and suggests a possible role of EGFR-directed therapies in PC patients.
Competing interests
All authors disclose any association that poses a conflict of interest in connection with the manuscript.
Microarray data are available on GEO (GSE 14206).
Authors' contributions
CPN designed the study, carried out the experiments, and drafted the manuscript; GM performed PCR and mutational analysis; MMG performed microarray experiments; FM performed statistical analyses and reviewed the final version of the manuscript; RS performed immunohistochemistry experiments; YP and GC supervised the study and supported with data interpretation; BT and LM performed and analyzed the immunohistochemical data; GC performed statistical analysis of microarray data; MA participated in design and coordination of the study.
All authors have read and approved the final manuscript.
Pre-publication history
The pre-publication history for this paper can be accessed here:
Supplementary Material
Table S1. Clinical pathological characteristics and EGFR status in PC patients
Table S2. 79-gene signature (40 up-regulated and 39 down-regulated) distinguishing EGFRhigh/mutated samples from EGFRhigh/WT samples
Contributor Information
Caterina Peraldo-Neia, Email: caterina.peraldoneia@ircc.it.
Giorgia Migliardi, Email: giorgia.migliardi@ircc.it.
Maurizia Mello-Grand, Email: Maurizia.mellogrand@fondoedotempia.it.
Filippo Montemurro, Email: filippo.montemurro@ircc.it.
Raffaella Segir, Email: raffaella.segir@gmail.com.
Ymera Pignochino, Email: ymera.pignochino@ircc.it.
Giuliana Cavalloni, Email: giuliana.cavalloni@ircc.it.
Bruno Torchio, Email: btorchio@mauriziano.it.
Luciano Mosso, Email: lmosso@mauriziano.it.
Giovanna Chiorino, Email: giovanna.chiorino@fondoedotempia.it.
Massimo Aglietta, Email: massimo.aglietta@ircc.it.
Acknowledgements
The authors wish to thank Radhika Srinivasan, PhD, for the careful revision of the manuscript. This work was supported by grants from the Fondazione CRT, progetto "Alfieri" e Compagnia di San Paolo di Torino; CPN was recipient of the Fondazione Edo ed Elvo Tempia Valenta, Biella grant; MMG, RS, GC, were recipient of Compagnia di San Paolo di Torino grants;YP was supported by Assegno di Ricerca funded by Regione Piemonte
References
- Gronberg H. Prostate cancer epidemiology. Lancet. 2003;361:859–864. doi: 10.1016/S0140-6736(03)12713-4. [DOI] [PubMed] [Google Scholar]
- Jemal A, Tiwari RC, Murray T, Ghafoor A, Samuels A, Ward E. American Cancer Society. Cancer statistics. CA Cancer. J Clin. 2004;54:8–29. doi: 10.3322/canjclin.54.1.8. [DOI] [PubMed] [Google Scholar]
- Albertsen PC, Hanley JA, Fine J. 20-year outcomes following conservative management of clinically localized prostate cancer. JAMA. 2005;293:2095–2101. doi: 10.1001/jama.293.17.2095. [DOI] [PubMed] [Google Scholar]
- Roth BJ. Prostate cancer chemotherapy: emerging from the shadows. J Clin Oncol. 2005;23:3302–3303. doi: 10.1200/JCO.2005.11.933. [DOI] [PubMed] [Google Scholar]
- Mimeault M, Batra SK. Recent advances on multiple tumorigenic cascades involved in prostatic cancer progression and targeting therapies. Carcinogenesis. 2006;27:1–22. doi: 10.1093/carcin/bgi229. [DOI] [PubMed] [Google Scholar]
- Djakiew D. Dysregulated expression of growth factors and their receptors in the development of prostate cancer. Prostate. 2000;42:150–160. doi: 10.1002/(SICI)1097-0045(20000201)42:2<150::AID-PROS10>3.0.CO;2-H. [DOI] [PubMed] [Google Scholar]
- Shah RB, Ghosh D, Elder JT. Epidermal growth factor receptor (ErbB1) expression in prostate cancer progression: correlation with androgen independence. Prostate. 2006;66:1437–44. doi: 10.1002/pros.20460. [DOI] [PubMed] [Google Scholar]
- Di Lorenzo G, Tortora G, D'Armiento FP, De Rosa G, Staibano S, Autorino R, D'Armiento M, De Laurentiis M, De Placido S, Catalano G, Bianco AR, Ciardiello F. Expression of epidermal growth factor receptor correlates with disease relapse and progression to androgen-independence in human prostate cancer. Clinical Cancer Res. 2002;8:3438–3444. [PubMed] [Google Scholar]
- Pignon JC, Koopmansch B, Nolens G, Delacroix L, Waltregny D, Winkler R. Androgen receptor controls EGFR and ERBB2 gene expression at different levels in prostate cancer cell lines. Cancer Res. 2009;69:2941–2949. doi: 10.1158/0008-5472.CAN-08-3760. [DOI] [PubMed] [Google Scholar]
- Ciardiello F, De Vita F, Orditura M, De Placido S, Tortora G. Epidermal growth factor receptor tyrosine kinase inhibitors in late stage clinical trials. Expert Opin Emerg Drugs. 2003;8:501–514. doi: 10.1517/14728214.8.2.501. [DOI] [PubMed] [Google Scholar]
- Dahabreh IJ, Linardou H, Siannis F, Kosmidis P, Bafaloukos D, Murray S. Somatic EGFR mutation and gene copy gain as predictive biomarkers for response to tyrosine kinase inhibitors in non-small cell lung cancer. Clin Cancer Res. 2010;16:291–303. doi: 10.1158/1078-0432.CCR-09-1660. [DOI] [PubMed] [Google Scholar]
- Cai CQ, Peng Y, Buckley MT, Wei J, Chen F, Liebes L, Gerald WL, Pincus MR, Osman I, Lee P. Epidermal growth factor receptor activation in prostate cancer by three novel missense mutations. Oncogene. 2008;27:3201–3210. doi: 10.1038/sj.onc.1210983. [DOI] [PubMed] [Google Scholar]
- Taguchi F, Koh Y, Koizumi F, Tamura T, Saijo N, Nishio K. Anticancer effects of ZD6474, a VEGF receptor tyrosine kinase inhibitor, in gefitinib ("Iressa")-sensitive and resistant xenograft models. Cancer Sci. 2004;95:984–989. doi: 10.1111/j.1349-7006.2004.tb03187.x. [DOI] [PMC free article] [PubMed] [Google Scholar]
- Lorusso PM. Phase I studies of ZD1839 in patients with common solid tumors. Semin Oncol. 2003;30(1 Suppl 1):21–29. doi: 10.1053/sonc.2003.50029. [DOI] [PubMed] [Google Scholar]
- Wilding G, Soulie P, Trump D, Das-Gupta A, Small E. Results from a pilot Phase I trial of gefitinib combined with docetaxel and estramustine in patients with hormone-refractory prostate cancer. Cancer. 2006;106:1917–1924. doi: 10.1002/cncr.21831. [DOI] [PubMed] [Google Scholar]
- Boccardo F, Rubagotti A, Conti G, Battaglia M, Cruciani G, Manganelli A, Ricc S, Lapini A. Prednisone plus gefitinib versus prednisone plus placebo in the treatment of hormone-refractory prostate cancer: a randomized phase II trial. Oncology. 2008;74:223–228. doi: 10.1159/000151391. [DOI] [PubMed] [Google Scholar]
- Franiel T, Lüdemann L, Taupitz M, Rost J, Asbach P, Beyersdorff D. Pharmacokinetic MRI of the prostate: parameters for differentiating low-grade and high-grade prostate cancer. Rofo. 2009;181:536–42. doi: 10.1055/s-0028-1109168. [DOI] [PubMed] [Google Scholar]
- Lynch TJ, Bell DW, Sordella R, Gurubhagavatula S, Okimoto RA, Brannigan BW, Harris PL, Haserlat SM, Supko JG, Haluska FG, Louis DN, Christiani DC, Settleman J, Haber DA. Activating mutations in the epidermal growth factor receptor underlying responsiveness of non-small-cell lung cancer to gefitinib. N Engl J Med. 2004;350:2129–2139. doi: 10.1056/NEJMoa040938. [DOI] [PubMed] [Google Scholar]
- Cangemi R, Mensah A, Albertini V, Jain A, Mello-Grand M, Chiorino G, Catapano CV, Carbone GM. Reduced expression and tumor suppressor function of the ETS transcription factor ESE-3 in prostate cancer. Oncogene. 2008;27:2877–2885. doi: 10.1038/sj.onc.1210953. [DOI] [PubMed] [Google Scholar]
- Cavalloni G, Danè A, Piacibello W, Bruno S, Lamas E, Bréchot C, Aglietta M. The involvement of human-nuc gene in polyploidization of K562 cell line. Exp Hematol. 2000;28:1432–1440. doi: 10.1016/S0301-472X(00)00558-0. [DOI] [PubMed] [Google Scholar]
- Cronin AM, Godoy G, Vickers AJ. Definition of biochemical recurrence after radical prostatectomy does not substantially impact estimates for prognostic factors. J Urol. 2010;183:984–989. doi: 10.1016/j.juro.2009.11.027. [DOI] [PMC free article] [PubMed] [Google Scholar]
- Tsao MS, Sakurada A, Cutz JC, Zhu CQ, Kamel-Reid S, Squire J, Lorimer I, Zhang T, Liu N, Daneshmand M, Marrano P, da Cunha Santos G, Lagarde A, Richardson F, Seymour L, Whitehead M, Ding K, Pater J, Shepherd FA. Erlotinib in lung cancer - molecular and clinical predictors of outcome. N Engl J Med. 2005;14:133–144. doi: 10.1056/NEJMoa050736. Erratum in: N Engl J Med. 2006;16:1746. [DOI] [PubMed] [Google Scholar]
- Dobashi Y, Suzuki S, Sugawara H, Ooi A. Involvement of epidermal growth factor receptor and downstream molecules in bone and soft tissue tumors. Hum Pathol. 2007;38:914–925. doi: 10.1016/j.humpath.2006.12.005. [DOI] [PubMed] [Google Scholar]
- Bell DW, Lynch TJ, Haserlat SM, Harris PL, Okimoto RA, Brannigan BW, Sgroi DC, Muir B, Riemenschneider MJ, Iacona RB, Krebs AD, Johnson DH, Giaccone G, Herbst RS, Manegold C, Fukuoka M, Kris MG, Baselga J, Ochs JS, Haber DA. Epidermal growth factor receptor mutations and gene amplification in non-small-cell lung cancer: molecular analysis of the IDEAL/INTACT gefitinib trials. J Clin Oncol. 2005;23(31):8081–8092. doi: 10.1200/JCO.2005.02.7078. Epub 2005 Oct 3. [DOI] [PubMed] [Google Scholar]
- Cappuzzo F, Hirsch FR, Rossi E, Bartolini S, Ceresoli GL, Bemis L, Haney J, Witta S, Danenberg K, Domenichini I, Ludovini V, Magrini E, Gregorc V, Doglioni C, Sidoni A, Tonato M, Franklin WA, Crino L, Bunn PA, Jr, Varella-Garcia M. Epidermal growth factor receptor gene and protein and gefitinib sensitivity in non-small-cell lung cancer. J Natl Cancer Inst. 2005. pp. 643–655. [DOI] [PubMed]
- Pezaro C, Rosenthal MA, Gurney H, Davis ID, Underhill C, Boyer MJ, Kotasek D, Solomon B, Toner GC. An open-label, single-arm phase two trial of gefitinib in patients with advanced or metastatic castration-resistant prostate cancer. Am J Clin Oncol. 2009;32:338–41. doi: 10.1097/COC.0b013e31818b946b. [DOI] [PubMed] [Google Scholar]
- Small EJ, Fontana J, Tannir N, DiPaola RS, Wilding G, Rubin M, Iacona RB, Kabbinavar FF. A phase II trial of gefitinib in patients with non-metastatic hormone-refractory prostate cancer. BJU Int. 2007;100:765–9. doi: 10.1111/j.1464-410X.2007.07121.x. [DOI] [PubMed] [Google Scholar]
- Sridhar SS, Hotte SJ, Chin JL, Hudes GR, Gregg R, Trachtenberg J, Wang L, Tran-Thanh D, Pham NA, Tsao MS, Hedley D, Dancey JE, Moore MJ. A Multicenter Phase II Clinical Trial of Lapatinib (GW572016) in Hormonally Untreated Advanced Prostate Cancer. Am J Clin Oncol. 2009. in press . [DOI] [PubMed]
- de Bono JS, Bellmunt J, Attard G, Droz JP, Miller K, Flechon A, Sternberg C, Parker C, Zugmaier G, Hersberger-Gimenez V, Cockey L, Mason M, Graham J. Open-label phase II study evaluating the efficacy and safety of two doses of pertuzumab in castrate chemotherapy-naive patients with hormone-refractory prostate cancer. J Clin Oncol. 2007;25:257–62. doi: 10.1200/JCO.2006.07.0888. [DOI] [PubMed] [Google Scholar]
- Prewett M, Rockwell P, Rockwell RF, Giorgio NA, Mendelsohn J, Scher HI, Goldstein NI. The biologic effects of C225, a chimeric monoclonal antibody to the EGFR, on human prostate carcinoma. J Immunother Emphasis Tumor Immunol. 1996;19:419–427. doi: 10.1097/00002371-199611000-00006. [DOI] [PubMed] [Google Scholar]
- Parra HS, Cavina R, Latteri F, Zucali PA, Campagnoli E, Morenghi E, Grimaldi GC, Roncalli M, Santoro A. Analysis of epidermal growth factor receptor expression as a predictive factor for response to gefitinib ('Iressa', ZD1839) in non-small-cell lung cancer. Br J Cancer. 2004;91:208–212. doi: 10.1038/sj.bjc.6601923. [DOI] [PMC free article] [PubMed] [Google Scholar]
- Shuch B, Mikhail M, Satagopan J, Lee P, Yee H, Chang C, Cordon-Cardo C, Taneja SS, Osman I. Racial disparity of epidermal growth factor receptor expression in prostate cancer. J Clin Oncol. 2004;22:4725–4729. doi: 10.1200/JCO.2004.06.134. [DOI] [PubMed] [Google Scholar]
- Xiao W, Zhang Q, Jiang F, Pins F, Kozlowski JM, Wang Z. Suppression of prostate tumor growth by U19, a novel testosterone-regulated apoptosis inducer. Cancer Res. 2003;63:4698–4704. [PubMed] [Google Scholar]
- Ho LL, Kench JG, Handelsman DJ, Scheffer GL, Stricker PD, Grygiel JG, Sutherland RL, Henshall SM, Allen JD, Horvath LG. Androgen regulation of multidrug resistance-associated protein 4 (MRP4/ABCC4) in prostate cancer. Prostate. 2008;68:1421–1429. doi: 10.1002/pros.20809. [DOI] [PubMed] [Google Scholar]
- Zhao H, Kim Y, Wang P, Lapointe J, Tibshirani R, Pollack JR, Brooks JD. Genome-wide characterization of gene expression variations and DNA copy number changes in prostate cancer cell lines. Prostate. 2005;63:187–197. doi: 10.1002/pros.20158. [DOI] [PubMed] [Google Scholar]
- Köllermann J, Schlomm T, Bang H, Schwall GP, von Eichel-Streiber C, Simon R, Schostak M, Huland H, Berg W, Sauter G, Klocker H, Schrattenholz A. Expression and prognostic relevance of annexin A3 in prostate cancer. Eur Urol. 2008;54:1314–1323. doi: 10.1016/j.eururo.2008.01.001. [DOI] [PubMed] [Google Scholar]
- van der Heul-Nieuwenhuijsen L, Dits NF, Jenster G. Gene expression of forkhead transcription factors in the normal and diseased human prostate. BJU Int. 2009;103:1574–1580. doi: 10.1111/j.1464-410X.2009.08351.x. [DOI] [PubMed] [Google Scholar]
- de Muga S, Hernández S, Agell L, Salido M, Juanpere N, Lorenzo M, Lorente JA, Serrano S, Lloreta J. Molecular alterations of EGFR and PTEN in prostate cancer: association with high-grade and advanced-stage carcinomas. Mod Pathol. 2010;23:703–12. doi: 10.1038/modpathol.2010.45. [DOI] [PubMed] [Google Scholar]
- Douglas DA, Zhong H, Ro JY, Oddoux C, Berger AD, Pincus MR, Satagopan JM, Gerald WL, Scher HI, Lee P, Osman I. Novel mutations of epidermal growth factor receptor in localized prostate cancer. Front Biosci. 2006;11:2518–25. doi: 10.2741/1986. [DOI] [PubMed] [Google Scholar]
- Leone F, Cavalloni G, Pignochino Y, Sarotto I, Ferraris R, Piacibello W, Venesio T, Capussotti L, Risio M, Aglietta M. Somatic mutations of epidermal growth factor receptor in bile duct and gallbladder carcinoma. Clin Cancer Res. 2006;12:1680–1685. doi: 10.1158/1078-0432.CCR-05-1692. [DOI] [PubMed] [Google Scholar]
Associated Data
This section collects any data citations, data availability statements, or supplementary materials included in this article.
Supplementary Materials
Table S1. Clinical pathological characteristics and EGFR status in PC patients
Table S2. 79-gene signature (40 up-regulated and 39 down-regulated) distinguishing EGFRhigh/mutated samples from EGFRhigh/WT samples


