

Abstract
Background
Many large-scale epidemiologic data sources used to evaluate the body mass index (BMI: kg/m2) mortality association have relied on BMI derived from self-reported height and weight. Although measured BMI (BMIM) and self-reported BMI (BMISR) correlate highly, self-reports are systematically biased.
Objective
To rigorously examine how self-reporting bias influences the association between BMI and mortality rate.
Subjects
Samples representing the US non-institutionalized civilian population.
Design and Methods
National Health and Nutrition Examination Survey data (NHANES II: 1976-80; NHANES III: 1988-94) contain BMIM and BMISR. We applied Cox regression to estimate mortality hazard ratios (HRs) for BMIM and BMISR categories, respectively, and compared results. We similarly analyzed subgroups of ostensibly healthy never-smokers.
Results
Misclassification by BMISR among the underweight and obesity ranged from 30–40% despite high correlations between BMIM and BMISR (r>0.9). The reporting bias was moderately correlated with BMIM (r>0.35), but not BMISR (r<0.15). Analyses using BMISR failed to detect six of eight significant mortality HRs detected by BMIM. Significantly biased HRs were detected in the NHANES II full dataset (χ2 = 12.49; p = 0.01) and healthy subgroup (χ2 = 9.93; p = 0.04), but not in the NHANES III full dataset (χ2 = 5.63; p = 0.23) or healthy subgroup (χ2 = 1.52; p = 0.82).
Conclusions
BMISR should not be treated as interchangeable with BMIM in BMI-mortality analyses. Bias and inconsistency introduced by using BMISR in place of BMIM in BMI-mortality estimation and hypothesis tests may account for important discrepancies in published findings.
Keywords: self-reported BMI, measured BMI, self-reporting bias, obesity, mortality, NHANES
Introduction
Body mass index (BMI: kg/m2) has been used to show that excess body weight is highly prevalent 1; associated with adverse medical conditions such as cardiovascular disease 2, diabetes 3, and many cancers 4; and imposes personal and public health burdens in healthcare costs 5, years of life lost 6, and elevated mortality rate (MR) 7-15. Many large-scale epidemiologic data sources (e.g., Nurses' Health Study 14, the American Cancer Society Cancer Prevention Studies 10, Health Professionals' Follow-up Study 9, National Institutes of Health AARP 7, and the Physicians' Health Study 13) used to derive these findings do not contain measured heights and weights, but rely on self-reported height and weight. Although the results of studies using BMISR and BMIM, such as the National Health and Nutrition Examination Survey (NHANES) 11 and the Prospective Studies Collaboration 15 typically show a U- or J-shaped relationship with MR in United States and International populations, respectively, disparities exist between results of some studies. Some BMISR studies suggest that if ever-smokers and those with a history of disease or who died a few years after the baseline survey are excluded from the analysis, the relationship with MR among subgroups of ostensibly healthy never-smoker study participants is roughly monotonically increasing (e.g., 13-14). However, this result has generally not been observed in studies with BMIM (e.g., 15-16). To what extent might these differences result from using BMISR in place of BMIM?
Although many studies have demonstrated that BMISR provides a biased assessment of BMIM 17-32, BMISR and BMIM still tend to be highly correlated (r > .90) 21-24, 30-32. This led Manson et al. to write, “A validation study in the NHS [Nurses' Health Study], however, found a correlation of 0.96 between self-reported and measured weights, with the former averaging only 1.5 kg lower than the latter, and similar reporting accuracy was observed in NHANES III [the Third National Health and Nutrition Examination Survey], suggesting that self-reported weights may not introduce significant bias 33.” Alternatively, referring to the health and smoking subgroup analyses frequently conducted to explain apparently discrepant results, Flegal et al. wrote, “Depending on the characteristics of the subgroup, confounding by other variables might even be increased after such exclusions. In studies with self-reported weights and heights, differences in reporting error patterns between the full sample and the subgroup could also potentially affect the results 16.”
We investigate if using BMISR in place of BMIM biased mortality results in nationally-representative datasets having both BMIM and BMISR. We begin with a brief prefatory analysis of the relationship between these measures. This is followed by a summary of MR parameter significance tests as well as direct tests for bias in BMISR MR estimates. We also repeat the tests in subgroups of ostensibly healthy never-smoker participants to evaluate Flegal et al.'s conjecture 16. This is not merely a theoretical exercise because epidemiologic studies which relied on BMISR have influenced public health opinions, recommendations, and policies. Hence, evaluating the validity of BMISR as a substitute for BMIM is important.
Materials and Methods
Overview of datasets
The data come from two waves of NHANES. NHANES II was conducted from 1976 to 1980 on a nationwide probability sample of individuals aged 1 to 74 years. Mortality information was available for participants 30 years of age or older from the NHANES II Linked Mortality File. NHANES III was conducted from 1988 to 1994 on a nationwide probability sample of individuals aged 1 to 90 years. Mortality information was available for subjects 18 years of age or older from the NHANES III Public-Use Linked Mortality File. We limited our analyses to those aged at least 25 years at survey.
NHANES II and III design and sampling methods have been reported 34-35. Mortality follow-up was drawn from the National Death Index. The NHANES III mortality follow-up times we analyzed in the public-access data were perturbed for decedent records by NCHS to protect confidentiality. A comparative study on the perturbed and unperturbed data suggest that using the perturbed data will not likely affect the results of survival analyses 36. Pregnant participants or those with missing data on our study variables were given zero weight in analyses. As we were interested in how BMISR might perform in population studies of BMI and mortality, we did not exclude participants having otherwise complete study data, but who were missing either BMIM (nNHANES II = 0, nNHANES III = 3) or BMISR (nNHANES II = 191, nNHANES III = 914).
Study variables
Predictor
Both measured and self-reported height and weight were available to calculate BMIM and BMISR, respectively. Categories for BMIM and BMISR were constructed according to federal guidelines 37 for defining underweight (<18.5), normal weight (18.5 to <25), overweight (25 to <30), obese (30 to <35), and severely obese (≥35).
Outcome variables
Mortality status (i.e., alive or dead) and age at time of death or censoring 38-39 with follow-up through 1992 for NHANES II and 2000 for NHANES III.
Covariates
Data on gender, race (black, white, or other), alcohol consumption (average daily for NHANES III: 0, <0.07, 0.07 to <0.35, ≥0.35 oz/d; frequency for NHANES II: never, < 1 time/week, 1 to < 3 times/week, > 3 times/week), and smoking status (never, former, current).
Statistical analysis
We have conducted our analyses in two stages. First, a brief prefatory analysis of the relationship between BMIM and BMISR was conducted. Sample weighted misclassification rates were tabulated from both full survey datasets. Weighted Pearson product-moment correlations were used to summarize the relationships among BMIM, BMISR, and the discrepancy (bias) between BMIM and BMISR (ΔBMI = BMIM − BMISR).
In the second stage, we estimated MR from independent models of BMIM and BMISR, pointed out for which BMI categories the significance tests from BMIM and BMISR models agreed or disagreed, then tested for bias in MR estimates. Weighted Cox proportional hazards regression models were fit to relate categorized BMIM and BMISR separately to attained age mortality data with adjustments for covariates. We used counting process methods 40 to account for left-truncation in these data which sets the beginning of exposure for each participant to the age at which they entered the study. In separate subgroup analyses, we examined MR among ostensibly healthy subgroups of never-smokers at the time of survey (i.e., reported no major illnesses including acute myocardial infarction, heart failure, other heart problems, cancer, emphysema, or stroke).
In total, eight Cox models were fit. Each of the four datasets we analyzed (j = 1, …, 4: 1. NHANES II full survey, 2. NHANES II healthy never-smoker subgroup, 3. NHANES III full survey, and 4. NHANES III healthy never-smoker subgroup) were modeled twice: once with BMIM and again replacing BMIM with BMISR. This produced eight sets of hazard ratio (HR) estimates; each individual HR representing the MR of one of the five BMI levels (i = 1, …, 5: 1. underweight, 2. normal weight, 3. overweight, 4. obese, or 5. severely obese) relative to the normal weight reference BMI level for the given model (e.g., the model of BMISR in the NHANES II full survey). To help assess the MRs, we tabulated HR results from the eight models and indicated if the respective BMIM and BMISR models agreed on the significance of the HRs at each BMI level within each of the four datasets. Note that, to save space in the table, we have omitted the HRs comparing the reference groups to themselves which will always have HR = 1. We tested for bias in the BMISR MR estimates by computing 95% confidence intervals (CI) for the differences in BMIM-derived and BMISR-derived HRs at each BMI level, i, within each
dataset, j. The variability in each ΔHRij was computed by the delete-1 cluster jackknife method 41 of standard error estimation which takes into account the sampling design of NHANES II and III, respectively. Asymptotic χ2 tests and t-tests were conducted by the delta method to infer significant differences 42.
Data were analyzed using SAS v9.2 (SAS Institute, Cary, NC) and SAS-Callable SUDAAN v10.0 (Research Triangle Institute, Research Triangle Park, NC) to accommodate the complex multistage sampling design 43.
Ethical Approval
Institutional Review Boards of the University of Alabama at Birmingham, Thomas Jefferson University, and Johns Hopkins University approved the protocol.
Results
Table 1 displays selected characteristics of the unweighted data from NHANES II and NHANES III. On average, BMIM was about 0.6 kg/m2 larger than BMISR.
Table 1. Unweighted demographic and mortality information: means (with standard deviation) or counts (with percentage).
| NHANES II | NHANES III | |||
|---|---|---|---|---|
| Full Dataset | Healthy* Subgroup | Full Dataset | Healthy* Subgroup | |
| Sample size | 9 227 | 3 022 | 15 060 | 6 141 |
| Women | 4 878 (53.0) | 2 146 (71.0) | 7 937 (52.7) | 4 094 (66.7) |
| Age | 54.9 (13.3) | 54.8 (13.8) | 52.7 (18.4) | 49.9 (18.6) |
| Healthy* | 3 022 (32.8) | 3 022 (100) | 6 141 (41.0) | 6 141 (100) |
| BMIM | 26.1 (5.0) | 26.6 (5.3) | 27.3 (5.8) | 27.7 (6.1) |
| BMISR | 25.5 (4.6) | 25.8 (4.8) | 26.7 (5.4) | 26.9 (5.5) |
| ΔBMI | 0.6 (1.7) | 0.7 (1.8) | 0.6 (2.0) | 0.8 (2.1) |
| Deaths | 2 143 (23.2) | 450 (14.9) | 2 820 (18.7) | 741 (12.1) |
| Follow-up | 13.3 (3.6) | 14.0 (2.8) | 8.2 (2.6) | 8.4 (2.2) |
The ostensibly “healthy” subgroup consists of never smokers having reported no history of acute myocardial infarction, heart failure, other heart problems, cancer, emphysema, or stroke.
Prefatory analysis of reporting bias
Participants belonging to the lowest and highest BMIM-derived categories were misrepresented by BMISR-derived categories at the highest rates. BMI category misclassification rates from BMISR were low among those of normal weight with respect to underreporting (<2%) and over-reporting (<8%) for both surveys. The misclassification rates from over-reported BMISR among the underweight were high for both NHANES II (32%) and NHANES III (42%). Underreporting of BMISR lead to high misclassification rates for the obese and severely obese in NHANES II (35% and 34%) and NHANES III (35% and 31%). Even though misclassification rates were high in both NHANES II and III, BMIM showed strong Pearson correlations with BMISR (r = 0.94 in NHANES II; r = 0.95 in NHANES III). Interestingly, BMIM was moderately correlated with reporting bias (ΔBMI = BMIM − BMISR) in both surveys (r = 0.36 in NHANES II; r = 0.42 in NHANES III), while BMISR showed little correlation with ΔBMI (r = 0.02 in NHANES II; r = 0.13 in NHANES III).
Analysis of mortality rate bias
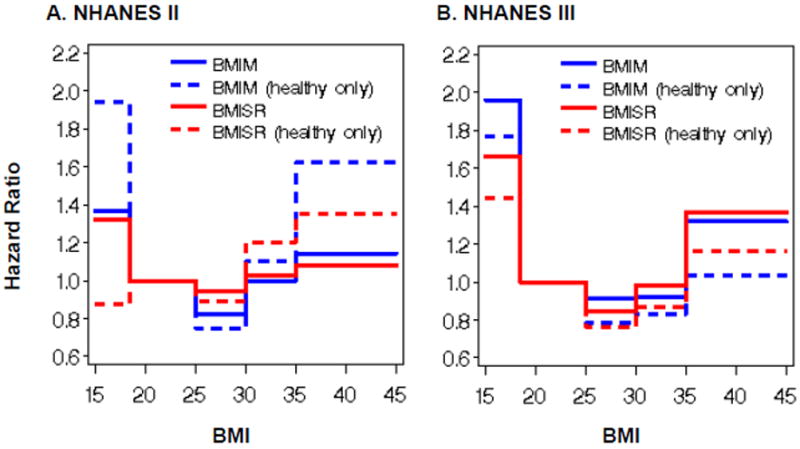
HR estimates of MR relative to normal weight reference groups specific to the type of BMI (BMIM or BMISR) within both full survey datasets and the ostensibly healthy subgroups are illustrated in the two plots (Parts A and B) displayed in Figure 1. While the bias relationship between BMIM and BMISR presented in the literature and our prefatory analysis might seem consistent and straightforward, its influence in biasing MR is complicated and inconsistent across survey waves and ostensibly healthy never-smoker subgroups. In Figure 1 Part A, for NHANES II, disparities in MR estimates (BMISR red lines vs. BMIM blue lines) were largest among the ostensibly healthy participants (dashed lines) where, similarly to the full datasets, BMISR underestimated MR for the underweight and the severely obese, but overestimated MR for the overweight and the obese. In Figure 1 Part B, for NHANES III, the MR estimates for the healthy subgroup were smaller than those for the full dataset at each BMI level. The disparities in MR for the full NHANES III dataset appeared to have very similar magnitudes as for the ostensibly healthy of NHANES III at each BMI level, whereas the MR disparities for the full NHANES II dataset were not similar to those for the ostensibly healthy of NHANES II at the lowest and highest BMI levels.
Figure 1. Parts A-B. Weighted mortality hazard ratios by BMIM and BMISR.
Scheme for associating RNA sequence features with splicing outcomes. Top left: More than 1000 diverse features were used; the examples shown here were chosen to illustrate their diversity. Each feature was also defined by the region in which it occurs, as indicated on the map on the lower left, where the alternatively spliced exon is red. Upper right: Exon inclusion data were originally measured in 27 mouse tissues or cell lines using microarrays and then consolidated into four tissue types: C, central nervous system; M, striated and cardiac muscle; D, digestion related tissues; E, embryonic tissue and stem cells. A machine learning algorithm was devised to associate particular features with particular splicing outcomes; the latter being categorized as increased exon inclusion, increased exon exclusion, or no difference in comparing two tissue types. After training on a set of ∼3000 exons, the algorithm was able to reliably predict these splicing outcomes in a set of test exons.
Figure 1 shows that BMISR did not yield the same MR estimates as BMIM for either the full datasets or healthy subgroups of NHANES II or III. Table 2 lists all these HR parameter estimates and accompanying significance test results. As such, the respective BMIM and BMISR models disagreed on the significance of nearly half of the HR's computed. The BMIM and BMISR models agreed on the nonsignificance of the HR parameter estimates for the obese and severely obese from the full NHANES II; the obese from the NHANES II healthy subgroup; the obese from the full NHANES III; and the overweight, obese, and severely obese from the NHANES III healthy subgroup. BMIM and BMISR models agreed on the significance of only the underweight HR parameter estimate from the full NHANES III dataset. BMISR models detected significantly elevated MR among only the underweight (HR = 1.96, p < 0.01) and overweight (HR = 0.85, p = 0.02) from the full dataset of NHANES III.
Table 2. Mortality hazard ratios: do the BMIM and BMISR significance test results agree?
| BMI Type | HR* | p-value | Significant at α = 0.05? | Do the tests agree? | |||
|---|---|---|---|---|---|---|---|
| NHANES II | Full Dataset | Underweight | BMIM | 1.37 | 0.04 | Yes | No |
| BMISR | 1.32 | 0.07 | No | ||||
| Overweight | BMIM | 0.82 | <0.01 | Yes | No | ||
| BMISR | 0.94 | 0.30 | No | ||||
| Obese | BMIM | 1.00 | 1.00 | No | Yes | ||
| BMISR | 1.03 | 0.82 | No | ||||
| Severely Obese | BMIM | 1.14 | 0.25 | No | Yes | ||
| BMISR | 1.03 | 0.67 | No | ||||
| Healthy Subgroup | Underweight | BMIM | 1.94 | 0.03 | Yes | No | |
| BMISR | 0.87 | 0.71 | No | ||||
| Overweight | BMIM | 0.75 | 0.02 | Yes | No | ||
| BMISR | 0.89 | 0.35 | No | ||||
| Obese | BMIM | 1.10 | 0.56 | No | Yes | ||
| BMISR | 1.20 | 0.37 | No | ||||
| Severely Obese | BMIM | 1.63 | 0.02 | Yes | No | ||
| BMISR | 1.35 | 0.24 | No | ||||
| NHANES III | Full Dataset | Underweight | BMIM | 1.96 | <0.01 | Yes | Yes |
| BMISR | 1.66 | <0.01 | Yes | ||||
| Overweight | BMIM | 0.91 | 0.21 | No | No | ||
| BMISR | 0.85 | 0.02 | Yes | ||||
| Obese | BMIM | 0.92 | 0.26 | No | Yes | ||
| BMISR | 0.98 | 0.85 | No | ||||
| Severely Obese | BMIM | 1.32 | 0.02 | Yes | No | ||
| BMISR | 1.37 | 0.07 | No | ||||
| Healthy Subgroup | Underweight | BMIM | 1.77 | 0.02 | Yes | No | |
| BMISR | 1.44 | 0.11 | No | ||||
| Overweight | BMIM | 0.78 | 0.06 | No | Yes | ||
| BMISR | 0.76 | 0.06 | No | ||||
| Obese | BMIM | 0.83 | 0.19 | No | Yes | ||
| BMISR | 0.86 | 0.43 | No | ||||
| Severely Obese | BMIM | 1.03 | 0.89 | No | Yes | ||
| BMISR | 1.17 | 0.57 | No | ||||
HR values represent mortality hazard relative a normal weight reference group that is specific to the type of BMI (BMIM or BMISR) in each of the four datasets. The HRs for the normal weight reference groups have been omitted as the HRs will always be 1.
Comparing HR estimates from the BMIM and BMISR models, the ΔHRij estimates were statistically significantly different in the NHANES II full dataset (χ2 = 12.49; p = 0.01) and healthy subgroup (χ2 = 9.93; p = 0.04), but not in the NHANES III full dataset (χ2 = 5.63; p = 0.23) or healthy subgroup (χ2 = 1.52; p = 0.82). Table 3 provides the calculated ΔHRij estimates along with 95% CIs which indicate that the statistically significant differences were attributable to the overweight in the NHANES II full dataset analysis (ΔHR31 = -0.12; 95% CI: -0.19, -0.04; p = 0.002) and the underweight in the NHANES II healthy subgroup analysis (ΔHR12 = 1.06; 95% CI: 0.01, 2.12; p = 0.032).
Table 3. Differences in hazard ratios*: BMIM vs. BMISR (with 95% CI).
| NHANES II | NHANES III | |||
|---|---|---|---|---|
| BMI Category | Full dataset | Healthy subgroup | Full dataset | Healthy subgroup |
| Underweight | 0.05 (-0.19,0.28) | 1.06 (0.01,2.12)† | 0.30 (-0.10,0.71) | 0.32 (-0.48,1.13) |
| Overweight | -0.12 (-0.20,-0.05)‡ | -0.14 (-0.30,0.02) | 0.06 (-0.02,0.15) | 0.02 (-0.13,0.18) |
| Obese | -0.03 (-0.19,0.14) | -0.10 (-0.45,0.25) | -0.06 (-0.20,0.06) | -0.03 (-0.30,0.23) |
| Severely Obese | 0.06 (-0.20,0.33) | 0.28 (-0.23,0.78) | -0.05 (-0.34,0.25) | -0.13 (-0.48,0.21) |
ΔHRij, the difference in HR from a model with BMIM vs. a model with BMISR for the ith BMI category in the jth dataset (or subgroup).
p = 0.033
p = 0.002
Discussion
NHANES II and III collected both measured and self-reported height and weight data and mortality follow-up affording the opportunity to empirically assess in nationally representative samples the extent to which substituting BMISR for BMIM influences mortality results. Some have suggested that BMI-mortality results could be significantly affected by using BMISR 16 while others have suggested that no practical differences would result from its use 33. We found that BMISR was indeed highly correlated with BMIM, but there were systematic biases in reporting BMI (ΔBMI) and high misclassification rates in both full surveys and their ostensibly healthy never-smoker subgroups. This misclassification of BMI, was sufficient to result in biased estimates of the BMI-MR association.
Using BMISR in place of BMIM led to underestimation of mortality associated with the underweight in both surveys, the underweight of NHANES III, and the severely obese of NHANES II. However, BMISR lead to overestimation of mortality associated with the overweight in NHANES II, the obese of both surveys, and the severely obese of NHANES III. Moreover, hypothesis tests from the BMIM and BMISR models did not agree for nearly half of the BMI HR parameter estimates. In particular, the models of BMISR failed to detect six of the eight significant HR parameter estimates detected by BMIM models. Although we did not have statistical power to detect some fairly large differences, some MR discrepancies between the HR parameter estimates from the BMIM and BMISR models (ΔHRij) were significantly different from zero among the overweight in the full NHANES II dataset, as well as the underweight in the healthy subgroup of NHANES II. After applying a Bonferroni adjustment to the significance level (α = 0.003) for the 16 ΔHRij t-tests, we found that the overestimated HR for the overweight of NHANES II remained significant (p = 0.002). It is important to note that missing BMI (and other) values may have influenced our results and those of others. Investigating this additional source of bias is beyond the scope of this research, but may be an important topic for future research.
Although it is unclear why, the bias in terms of the magnitude (not the direction) of the underestimation or overestimation in MR parameter estimates between BMISR and BMIM models depended on whether we analyzed all subjects or only a subgroup of ostensibly healthy never-smokers at baseline. Interestingly, this may explain an apparent discrepancy in the literature. Specifically, some have found that the BMI-MR relationship appears to be roughly monotonically increasing and that overweight appears to increase MR, but primarily when one analyzes only ostensibly healthy never-smokers at baseline (e.g., 13-14). In contrast, Flegal et al. 16 using BMIM found that restricting analyses only to ostensibly healthy never-smokers at baseline did not appear to make much difference in their essentially J-shaped association with MR and decreased MR of the overweight relative to the normal weight. Nevertheless, our results from the healthy never-smoker subgroup of NHANES II showed a nearly monotonically increasing trend in MR from the BMISR model not replicated in the BMIM model of those data (see Figure 1 Part A). This suggests that the discrepancy could be at least partly attributable to the fact that the former analyses 13-14 used BMISR whereas the latter 16 used BMIM. As an interesting side note, in light of findings of U- or J-shaped relationships between BMI and adverse outcomes, one may ask why there is often such a resistance to accept the suggestion that thinness is associated with increased health risk. Such findings are common, but are commonly attributed to ‘reverse causation’ - spurious associations with risk at low BMI levels resulting from weight loss caused by observable or latent disease conditions. While we have conducted analysis on ostensibly healthy never-smoker subgroups, it is unclear if, or to what extent, reverse causation may have influenced our results.
Many studies, including some which analyzed NHANES II 26-27 or III 18-19, 22-23, 29, have compared self-reported height and weight with measured values 17, 21, 24-25, 28, 30-32. They have found that misreporting height and weight might be systematically influenced by BMIM 24-25, 27-30, gender 21-25, 27-29, 31, age 18, 22, 24-25, 27-32, race/ethnicity 19, 27-29, disease or health status 30-31, smoking history or health behaviors 29, and end-digit preference 24, 27. Some have also noted dependencies based on geographic region 18 and socioeconomic variables 24, 28-29. Relatively few studies have pronounced self-reported height and weight to be a valid and sufficient proxy for measured height and weight 21, 23, 32. Others caution against relying on BMISR 22, 24, 29, particularly for estimating relationships between BMI and health outcomes 26. This includes obesity-related outcomes which seem correlated with misreporting, such as diabetes or hypertension 30. Many more studies have compared measured vs. self-reported height, weight, and BMI in the US and other countries. For systematic review of these studies, see 44.
Some investigators have suggested that adjusting BMISR can help in studies lacking measurements 17, 25, 28, 32, 45. Although highly correlated with BMIM, BMISR was not linearly related with reporting bias (ΔBMI). Our results agreed with those of others 26 that ΔBMI does not appear to be recoverable from BMISR. Thus, BMISR should not be considered a reliable source of information for estimating BMIM with a regression model. This calls into question the validity of methods using self-reported heights and weights and other study variables, such as the methods proposed by Stommel and Shoenborn 28 based on recent NHANES data, to generate corrected BMI scores conditioned on BMISR. When we applied their method 28 to NHANES III, although the corrected BMI scores did improve classification over uncorrected BMISR among the severely obese (increased sensitivity from 68% to 84%), they seriously exacerbated the misclassification problems among the underweight, normal weight, overweight, and obese (sensitivity decreased from 58%, 91%, 80%, and 62% to 3%, 30%, 31%, and 47%, respectively). Compared to BMIM, the corrected BMI scores also increased the bias in estimating MR beyond that which we showed from using BMISR. It remains unclear, however, if future studies of BMI and mortality relying on BMISR would benefit in some way from the application of measurement error correction methods 46-48.
In a related context, Chiolero et al. 49 presented a hypothetical data example of how obesity and health condition association estimates can be overestimated as a result of systematic misclassification of BMI from using BMISR. However, they made several assumptions which may not hold in human data and hypothetical data such as they presented can just as easily be simulated to show how risk estimates can be underestimated or completely obscured depending on the underlying association between variables, outcomes, and the error distribution of the data generated. James et al. 20 suggested that, relative to BMIM, the narrower distribution of BMISR could result in artificially steep slopes for linear associations with continuous outcomes. Rothman 50 indicated that this could be true for BMI and mortality, but in their hypothetical example, like Chiolero et al. 49 they assumed that the association would be linearly increasing and that the misreporting errors would be nondifferential. These assumptions do not likely hold for mortality considering that linearity is not generally found in BMIM-mortality data 11, 15 and differential reporting bias could stem from latent or diagnosed disease conditions influencing height and weight self-reporting patterns 30 and MR 2. Thus, it is reasonable to expect that the MR results from using BMISR could be biased in either direction.
The selection processes between the aforementioned BMISR studies 9-10, 13-14 and the BMIM studies 11, 15 might also account for some disparities in their results. NHANES used complex multistage sampling to provide a cost-effective way to capture and examine a relatively small cohort that, when properly analyzed, is expected to represent well the US non-institutionalized population. This design does not preclude the potential for sampling bias. With the notable exception of the National Health Interview Survey (NHIS), large mortality follow-up data sources relying on BMISR have not been constructed in this manner. For example, the Nurses' Health Study applied its resources toward collecting reported information from a very large occupational cohort of nurses. This cohort should represent well the population of middle-aged nurses, but probably not the same population as NHANES. Additionally, having provided informed consent, the participants of NHANES II and III presumably knew that their height and weight would be measured subsequent to their report of it. In contrast, the participants in most studies providing self-reports would not expect their height and weight to be verified by measurements which has been shown to lead to greater biases in the self-reported values 17. It may follow that biases in MR estimation may be greater in typical studies relying on BMISR from participants who know that their weight and height will not be checked.
While we acknowledge the power of BMISR in large-scale epidemiologic investigations of MR, we conclude that BMISR should not be treated as interchangeable with BMIM. The bias introduced into MR estimation and inference with BMISR appears to play an important role in explaining the disparate BMI-mortality relationships reported. We observed the greatest reporting bias in the BMI categories having the smallest proportion of participants (i.e., 2% were underweight and 5%-8% were severely obese). Since the prevalence of people in each BMI level changes over time, even if the relationship between BMIM and BMISR stays the same, mortality HRs could be biased differentially across BMI categories. Thus, even small changes in the BMI distribution in future studies could have dramatic effects on misclassification rates which could assert similarly dramatic, possibly erratic, effects on MR estimates when BMISR is used in place of BMIM. Further investigation is necessary to determine if BMISR is a reliable substitute for BMIM in the analysis of other health outcomes.
Acknowledgments
This research was supported in part by NIH grants P30DK056336, T32HL079888, T32HL072757, K23MH066381, and AR49720. The opinions expressed are those of the authors and not necessarily those of the NIH or any other organization with which the authors are affiliated.
Footnotes
Author Contributions: SWK: Conception of project, acquisition and statistical analysis of data, analysis and interpretation of data, drafting of the manuscript, and critical revision of the manuscript for important intellectual content. KRF: Interpretation of the data, critical revision of the manuscript important to the intellectual content, and supervision. NMP: Interpretation of the data, critical revision of the manuscript for important intellectual content, and technical support. TM: Interpretation of the data, critical revision of the manuscript for important intellectual content, and technical support. DBA: Conception of project, drafting sections and critical revision of the manuscript for important intellectual content, analysis and interpretation of data, obtaining funding, and supervision.
SWK is the guarantor of the paper, having had full access to all of the data in the study, and takes responsibility for the integrity of the data and the accuracy of the data analysis. He had final responsibility for the decision to submit for publication.
Conflict of interest statement: DBA has received grants, honoraria, donations, and consulting fees from numerous food, beverage, pharmaceutical companies, and other commercial, government, and nonprofit entities with interests in obesity. SWK has no potential conflicts to disclose. KRF has no potential conflicts to disclose. NMP has no potential conflicts to disclose. TM has no potential conflicts to disclose.
References
- 1.Baskin ML, Ard J, Franklin F, Allison DB. Prevalence of obesity in the United States. Obesity reviews : an official journal of the International Association for the Study of Obesity. 2005;6(1):5–7. doi: 10.1111/j.1467-789X.2005.00165.x. [DOI] [PubMed] [Google Scholar]
- 2.Gregg EW, Cheng YJ, Cadwell BL, Imperatore G, Williams DE, Flegal KM, et al. Secular trends in cardiovascular disease risk factors according to body mass index in US adults. JAMA : the journal of the American Medical Association. 2005;293(15):1868–1874. doi: 10.1001/jama.293.15.1868. [DOI] [PubMed] [Google Scholar]
- 3.Gregg EW, Cheng YJ, Narayan KM, Thompson TJ, Williamson DF. The relative contributions of different levels of overweight and obesity to the increased prevalence of diabetes in the United States: 1976-2004. Preventive medicine. 2007;45(5):348–352. doi: 10.1016/j.ypmed.2007.07.020. [DOI] [PubMed] [Google Scholar]
- 4.Calle EE, Thun MJ. Obesity and cancer. Oncogene. 2004;23(38):6365–6378. doi: 10.1038/sj.onc.1207751. [DOI] [PubMed] [Google Scholar]
- 5.Allison DB, Zannolli R, Narayan KM. The direct health care costs of obesity in the United States. American Journal of Public Health. 1999;89(8):1194–1199. doi: 10.2105/ajph.89.8.1194. [DOI] [PMC free article] [PubMed] [Google Scholar]
- 6.Fontaine KR, Redden DT, Wang C, Westfall AO, Allison DB. Years of life lost due to obesity. JAMA : the journal of the American Medical Association. 2003;289(2):187–193. doi: 10.1001/jama.289.2.187. [DOI] [PubMed] [Google Scholar]
- 7.Adams KF, Schatzkin A, Harris TB, Kipnis V, Mouw T, Ballard-Barbash R, et al. Overweight, obesity, and mortality in a large prospective cohort of persons 50 to 71 years old. The New England journal of medicine. 2006;355(8):763–778. doi: 10.1056/NEJMoa055643. [DOI] [PubMed] [Google Scholar]
- 8.Allison DB, Fontaine KR, Manson JE, Stevens J, VanItallie TB. Annual deaths attributable to obesity in the United States. JAMA : the journal of the American Medical Association. 1999;282(16):1530–1538. doi: 10.1001/jama.282.16.1530. [DOI] [PubMed] [Google Scholar]
- 9.Baik I, Ascherio A, Rimm EB, Giovannucci E, Spiegelman D, Stampfer MJ, et al. Adiposity and mortality in men. American Journal of Epidemiology. 2000;152(3):264–271. doi: 10.1093/aje/152.3.264. [DOI] [PubMed] [Google Scholar]
- 10.Calle EE, Thun MJ, Petrelli JM, Rodriguez C, Heath CW., Jr Body-mass index and mortality in a prospective cohort of U.S. adults. The New England journal of medicine. 1999;341(15):1097–1105. doi: 10.1056/NEJM199910073411501. [DOI] [PubMed] [Google Scholar]
- 11.Flegal KM, Graubard BI, Williamson DF, Gail MH. Excess deaths associated with underweight, overweight, and obesity. JAMA : the journal of the American Medical Association. 2005;293(15):1861–1867. doi: 10.1001/jama.293.15.1861. [DOI] [PubMed] [Google Scholar]
- 12.Flegal KM, Graubard BI, Williamson DF, Gail MH. Cause-specific excess deaths associated with underweight, overweight, and obesity. JAMA : the journal of the American Medical Association. 2007;298(17):2028–2037. doi: 10.1001/jama.298.17.2028. [DOI] [PubMed] [Google Scholar]
- 13.Gelber RP, Kurth T, Manson JE, Buring JE, Gaziano JM. Body mass index and mortality in men: evaluating the shape of the association. International journal of obesity (2005) 2007;31(8):1240–1247. doi: 10.1038/sj.ijo.0803564. [DOI] [PubMed] [Google Scholar]
- 14.Manson JE, Willett WC, Stampfer MJ, Colditz GA, Hunter DJ, Hankinson SE, et al. Body weight and mortality among women. The New England journal of medicine. 1995;333(11):677–685. doi: 10.1056/NEJM199509143331101. [DOI] [PubMed] [Google Scholar]
- 15.Prospective Studies Collaboration. Whitlock G, Lewington S, Sherliker P, Clarke R, Emberson J, et al. Body-mass index and cause-specific mortality in 900 000 adults: collaborative analyses of 57 prospective studies. Lancet. 2009;373(9669):1083–1096. doi: 10.1016/S0140-6736(09)60318-4. [DOI] [PMC free article] [PubMed] [Google Scholar]
- 16.Flegal KM, Graubard BI, Williamson DF, Gail MH. Impact of smoking and preexisting illness on estimates of the fractions of deaths associated with underweight, overweight, and obesity in the US population. American Journal of Epidemiology. 2007;166(8):975–982. doi: 10.1093/aje/kwm152. [DOI] [PubMed] [Google Scholar]
- 17.Black DR, Taylor AM, Coster DC. Accuracy of self-reported body weight: Stepped Approach Model component assessment. Health education research. 1998;13(2):301–307. doi: 10.1093/her/13.2.301. [DOI] [PubMed] [Google Scholar]
- 18.Ezzati M, Martin H, Skjold S, Vander Hoorn S, Murray CJ. Trends in national and state-level obesity in the USA after correction for self-report bias: analysis of health surveys. Journal of the Royal Society of Medicine. 2006;99(5):250–257. doi: 10.1258/jrsm.99.5.250. [DOI] [PMC free article] [PubMed] [Google Scholar]
- 19.Gillum RF, Sempos CT. Ethnic variation in validity of classification of overweight and obesity using self-reported weight and height in American women and men: the Third National Health and Nutrition Examination Survey. Nutrition journal. 2005;4:27. doi: 10.1186/1475-2891-4-27. Journal Article. [DOI] [PMC free article] [PubMed] [Google Scholar]
- 20.James WP, Jackson-Leach R, Mhurchu CN, Kalamara E, Shayeghi M, Rigby NJ, et al. Overweight and Obesity (High Body Mass Index) In: Ezzati M, Lopez AD, Rodgers A, Murray CJ, editors. Comparative quantification of health risks: Global and regional burden of disease attributable to selected major risk factors. Vol. 1. World Health Organization; Geneva: 2004. p. 497. [Google Scholar]
- 21.Jeffery RW. Bias in reported body weight as a function of education, occupation, health and weight concern. Addictive Behaviors. 1996;21(2):217–222. doi: 10.1016/0306-4603(95)00050-x. [DOI] [PubMed] [Google Scholar]
- 22.Kuczmarski MF, Kuczmarski RJ, Najjar M. Effects of age on validity of self-reported height, weight, and body mass index: findings from the Third National Health and Nutrition Examination Survey, 1988-1994. Journal of the American Dietetic Association. 2001;101(1):28–34. doi: 10.1016/S0002-8223(01)00008-6. quiz 35-6. [DOI] [PubMed] [Google Scholar]
- 23.McAdams MA, Van Dam RM, Hu FB. Comparison of self-reported and measured BMI as correlates of disease markers in US adults. Obesity (Silver Spring, Md) 2007;15(1):188–196. doi: 10.1038/oby.2007.504. [DOI] [PubMed] [Google Scholar]
- 24.Niedhammer I, Bugel I, Bonenfant S, Goldberg M, Leclerc A. Validity of self-reported weight and height in the French GAZEL cohort. International journal of obesity and related metabolic disorders : journal of the International Association for the Study of Obesity. 2000;24(9):1111–1118. doi: 10.1038/sj.ijo.0801375. [DOI] [PubMed] [Google Scholar]
- 25.Nyholm M, Gullberg B, Merlo J, Lundqvist-Persson C, Rastam L, Lindblad U. The validity of obesity based on self-reported weight and height: Implications for population studies. Obesity (Silver Spring, Md) 2007;15(1):197–208. doi: 10.1038/oby.2007.536. [DOI] [PubMed] [Google Scholar]
- 26.Plankey MW, Stevens J, Flegal KM, Rust PF. Prediction equations do not eliminate systematic error in self-reported body mass index. Obesity research. 1997;5(4):308–314. doi: 10.1002/j.1550-8528.1997.tb00556.x. [DOI] [PubMed] [Google Scholar]
- 27.Rowland ML. Self-reported weight and height. The American Journal of Clinical Nutrition. 1990;52(6):1125–1133. doi: 10.1093/ajcn/52.6.1125. [DOI] [PubMed] [Google Scholar]
- 28.Stommel M, Schoenborn CA. Accuracy and usefulness of BMI measures based on self-reported weight and height: findings from the NHANES & NHIS 2001-2006. BMC public health. 2009;9:421. doi: 10.1186/1471-2458-9-421. Journal Article. [DOI] [PMC free article] [PubMed] [Google Scholar]
- 29.Villanueva EV. The validity of self-reported weight in US adults: a population based cross-sectional study. BMC public health. 2001;1:11. doi: 10.1186/1471-2458-1-11. Journal Article. [DOI] [PMC free article] [PubMed] [Google Scholar]
- 30.Wada K, Tamakoshi K, Tsunekawa T, Otsuka R, Zhang H, Murata C, et al. Validity of self-reported height and weight in a Japanese workplace population. International journal of obesity (2005) 2005;29(9):1093–1099. doi: 10.1038/sj.ijo.0803012. [DOI] [PubMed] [Google Scholar]
- 31.Yannakoulia M, Panagiotakos DB, Pitsavos C, Stefanadis C. Correlates of BMI misreporting among apparently healthy individuals: the ATTICA study. Obesity (Silver Spring, Md) 2006;14(5):894–901. doi: 10.1038/oby.2006.103. [DOI] [PubMed] [Google Scholar]
- 32.Spencer EA, Appleby PN, Davey GK, Key TJ. Validity of self-reported height and weight in 4808 EPIC-Oxford participants. Public health nutrition. 2002;5(4):561–565. doi: 10.1079/PHN2001322. [DOI] [PubMed] [Google Scholar]
- 33.Manson JE, Bassuk SS, Hu FB, Stampfer MJ, Colditz GA, Willett WC. Estimating the number of deaths due to obesity: can the divergent findings be reconciled? Journal of women's health (2002) 2007;16(2):168–176. doi: 10.1089/jwh.2006.0080. [DOI] [PubMed] [Google Scholar]
- 34.Loria CM, Semps CR, Vuong C. Plan and operation of the NHANES II mortality study, 1992. Vital Health Statistics. 1999;38:1–16. Journal Article. [PubMed] [Google Scholar]
- 35.National Center for Health Statistics. Plan and operation of the Third National Health and Nutrition Examination Survey, 1988-1994, Series I: programs and collection procedures. Vital Health Statistics. 1994;32:1–407. Journal Article. [PubMed] [Google Scholar]
- 36.Wheatcroft G, Cox CS, Lochner KA. Comparative analysis of the NHANES III public-use and restricted-use linked mortality files. National Center for Health Statistics. 2007 Journal Article. [Google Scholar]
- 37.NHLBI Obesity Education Initiative Expert Panel. Clinical Guidelines on the Identification, Evaluation, and Treatment of Overweight and Obesity in Adults. [January 16, 2010];Obes Res. 1998 6(suppl 2):51S. Available at: http://www.nhlbi.nih.gov/guidelines/obesity/ob_home.htm. [PubMed] [Google Scholar]
- 38.Gail MH, Graubard B, Williamson DF, Flegal KM. Comments on ‘Choice of time scale and its effect on significance of predictors in longitudinal studies’ by Michael J. Pencina, Martin G. Larson and Ralph B. D'Agostino, Statistics in Medicine 2007; 26:1343-1359. Statistics in medicine. 2009;28(8):1315–1317. doi: 10.1002/sim.3473. [DOI] [PMC free article] [PubMed] [Google Scholar]
- 39.Korn EL, Graubard BI, Midthune D. Time-to-event analysis of longitudinal follow-up of a survey: choice of the time-scale. American Journal of Epidemiology. 1997;145(1):72–80. doi: 10.1093/oxfordjournals.aje.a009034. [DOI] [PubMed] [Google Scholar]
- 40.Anderson PK, Gill RD. Cox's regression model for counting processes: a large sample study. The Annals of Statistics. 1982;10(4):1100–1120. [Google Scholar]
- 41.Rust KF, Rao JNK. Variance estimation for complex surveys using replication methods. Statistical Methods in Medical Research. 1996;5(3):283–310. doi: 10.1177/096228029600500305. [DOI] [PubMed] [Google Scholar]
- 42.Korn EL, Graubard BI. Analysis of Health Surveys. John Wiley & Sons, Inc; New York: 1999. [Google Scholar]
- 43.National Center for Health Statistics. Analytic and Reporting Guidelines: The Third National Health and Nutrition Examination Survey, NHANES III (1988-94) Centers for Disease Control and Prevention. 1996 Journal Article. [Google Scholar]
- 44.Connor Gorber S, Tremblay M, Moher D, Gorber B. A comparison of direct vs. self-report measures for assessing height, weight and body mass index: a systematic review. Obesity reviews : an official journal of the International Association for the Study of Obesity. 2007;8(4):307–326. doi: 10.1111/j.1467-789X.2007.00347.x. [DOI] [PubMed] [Google Scholar]
- 45.Jain RB. Regression models to predict corrected weight, height and obesity prevalence from self-reported data: data from BRFSS 1999-2007. Int J Obes (Lond) 2010 doi: 10.1038/ijo.2010.80. [DOI] [PubMed] [Google Scholar]
- 46.Lash TL, Fox MP, Thwin SS, Geiger AM, Buist DS, Wei F, et al. Using probabilistic corrections to account for abstractor agreement in medical record reviews. Am J Epidemiol. 2007;165(12):1454–61. doi: 10.1093/aje/kwm034. [DOI] [PubMed] [Google Scholar]
- 47.Carroll RJ, Ruppert D, Stefanski LA, Crainiceanu CM. Measurement Error in Nonlinear Models: A Modern Perspective. Second. Chapman and Hall CRC Press; Boca Raton, FL: 2006. [Google Scholar]
- 48.Fox MP, Lash TL, Greenland S. A method to automate probabilistic sensitivity analyses of misclassified binary variables. Int J Epidemiol. 2005;34(6):1370–6. doi: 10.1093/ije/dyi184. [DOI] [PubMed] [Google Scholar]
- 49.Chiolero A, Peytremann-Bridevaux I, Paccaud F. Associations between obesity and health conditions may be overestimated if self-reported body mass index is used. Obesity reviews : an official journal of the International Association for the Study of Obesity. 2007;8(4):373–374. doi: 10.1111/j.1467-789X.2007.00375.x. [DOI] [PubMed] [Google Scholar]
- 50.Rothman KJ. BMI-related errors in the measurement of obesity. International journal of obesity (2005) 2008;32(3):S56–9. doi: 10.1038/ijo.2008.87. Journal Article. [DOI] [PubMed] [Google Scholar]