Abstract
Subvisible particles in formulations intended for parenteral administration are of concern in the biopharmaceutical industry. However, monitoring and control of subvisible particulates can be complicated by formulation components, such as the silicone oil used for the lubrication of prefilled syringes, and it is difficult to differentiate microdroplets of silicone oil from particles formed by aggregated protein. In this study, we demonstrate the ability of flow cytometry to resolve mixtures comprising subvisible bovine serum albumin (BSA) aggregate particles and silicone oil emulsion droplets with adsorbed BSA. Flow cytometry was also utilized to investigate the effects of silicone oil emulsions on the stability BSA, lysozyme, abatacept or trastuzumab formulations containing surfactant, sodium chloride or sucrose. To aid in particle characterization, the fluorescence detection capabilities of Flow cytometry were exploited by staining silicone oil with BODIPY® 493/503 and model proteins with Alexa Fluor® 647. Flow cytometric analyses revealed that silicone oil emulsions induced the loss of soluble protein via protein adsorption onto the silicone oil droplet surface. Addition of surfactant prevented protein from adsorbing onto the surface of silicone oil droplets. There was minimal formation of homogeneous protein aggregates due to exposure to silicone oil droplets, although oil droplets with surface-adsorbed trastuzumab exhibited flocculation. The results of this study demonstrate the utility of flow cytometry as an analytical tool for monitoring the effects of subvisible silicone oil droplets on the stability of protein formulations.
Keywords: protein aggregation, adsorption, silicone oil, formulation, fluorescence, flow cytometry
Introduction
Currently, subvisible particles in formulations of therapeutic proteins are attracting substantial scrutiny [1]. Published reports [2; 3; 4] have shown abundant levels of subvisible particles in formulations that meet current regulatory guidelines [5]. The presence of these particles is of concern because they may provide potential nucleation sites for protein aggregation, a principle degradation pathway for a number of protein therapeutics [6; 7]. Furthermore, protein aggregates have been associated with undesirable immunogenic responses in patients receiving therapeutic proteins [8; 9; 10]. Despite the importance of detection and monitoring of subvisible particles, detection and characterization of particles in this size range present formidable analytical challenges for current methods.
Monitoring and control of subvisible protein particulates can be complicated by formulation components. For example, many proteins are now being formulated in prefilled glass syringes. To allow for smooth plunger movement, these syringes typically are lubricated with silicone oil, which is sprayed onto the interior surfaces of the syringe during the syringe manufacturing process [11]. Although the solubility of silicone oil in typical protein formulations is quite low [12], silicone oil may be present in the formulation in the form of an emulsion. Droplets of emulsified silicone oil may be detected by various optical techniques, but it is often difficult to distinguish silicone oil droplets from aggregates of protein.
The presence of emulsified silicone oil may result in increased rates of protein aggregation [13; 14; 15; 16; 17]. Conversely, we have recently reported that proteins may adsorb to the surfaces of oil droplets, changing the kinetic stability of silicone oil emulsions [18]. In order to determine whether subvisible particles within a formulation are composed of protein, silicone oil or protein adsorbed onto oil, it would be advantageous to use a technique that can simultaneously monitor particle size distributions as well as particle compositions.
One technique that has long been used in the field of cell biology is fluorescence-activated cell sorting (FACS™), often referred to as flow cytometry. Flow cytometry combines light scattering from particles and light emission from fluorochromic molecules to generate specific multi-parameter data sets for particles in the range of 1–100μm [19; 20]. Using hydrodynamic focusing techniques, flow cytometers are capable of counting and measuring the light scattering and fluorescence emission of thousands of individual particles per second. The high-throughput capability of flow cytometry, along with its ability to characterize individual particles as part of a large sample set, makes it a promising technique for use in the study of subvisible particles in protein formulations.
In the current study, we explore the use of flow cytometry as method for the detection and characterization of subvisible particles in silicone oil-contaminated formulations of lysozyme, bovine serum albumin (BSA), abatacept, or trastuzumab. We use fluorescently labeled proteins and fluorescently stained silicone oil to show that flow cytometry has the ability to discriminate between homogenous protein aggregates and heterogeneous particles made up of silicone oil and protein. Furthermore, flow cytometry analyses of our model systems provide evidence of protein adsorption onto silicone oil droplets, monolayer vs. multilayer protein adsorption, and particle flocculation.
Experimental
Materials
Chicken egg white lysozyme (lysozyme, Fisher Bioreagents), bovine serum albumin (BSA, Fisher Bioreagents), abatacept (Orencia®, Bristol-Myers Squibb Co) and trastuzumab (Herceptin®, Genentech, Inc.) were obtained in lyophilized form. All buffer salts (sodium phosphate monobasic, sodium phosphate dibasic, and sodium acetate), excipients (polysorbate 20, sodium chloride, and sucrose), and solvents (dimethylsulfoxide and dichloromethane) were reagent grade or higher. Silicone oil (Dow Corning 360, 1000 cSt) was of medical grade. Solutions were prepared with filtered distilled deionized water (Nanopure II, Barnstead International, Dubuque, IA).
Preparation of Stock Solutions
Lysozyme, BSA, and abatacept were reconstituted and dialyzed (Pierce Slide-A-Lyzer, 3500 and 10000 MWCO) into 10 mM sodium phosphate (pH 7.5), 0.01% sodium azide. Trastuzumab was reconstituted and dialyzed into 10 mM sodium acetate (pH 5.0), 0.01% sodium azide. Abatacept and trastuzumab were reconstituted into a buffer similar to that which would result after reconstitution of the formulations using instructions from the respective product inserts [21; 22]. The lysozyme and BSA reconstitution conditions were chosen such that lysozyme would carry a net positive charge and BSA would carry a net negative charge.
Protein concentrations were determined based on extinction coefficients of 2.63, 0.667, 1.01, or 1.4 mL mg−1 cm−1 for lysozyme [23], BSA [24], abatacept [25], or trastuzumab [26], respectively, at 280 nm using a PerkinElmer Lambda 35 spectrophotometer (Wellesley, MA).
Fluorescent Labeling
Protein molecules were chemically labeled with Alexa Fluor® 647 (AF 647, Invitrogen Corporation, Carlsbad, CA) according to the manufacturer’s protocol (MP 00143, Amine-Reactive Probes, Invitrogen Corporation). Following the labeling reaction, protein concentrations and degrees of labeling were determined using absorbance measurements at 280 nm and 650 nm. To determine protein concentrations, protein absorbance values at 280 nm were calculated according to equation 4.1
| (4.1) |
where CF represented the correction factor for fluorescent dye absorbance equal to 0.03 (MP 00143, Amine-Reactive Probes, Invitrogen Corporation). Protein concentrations were then determined using extinction coefficients mentioned previously. Degrees of labeling (DOL) were determined according to equation 4.2
| (4.2) |
where MW was the molecular weight of the protein; εdye represented the extinction coefficient of the dye at 650 nm equal to 239,000 cm−1M−1 (MP 00143, Amine-Reactive Probes, Invitrogen Corporation); and protein concentration was in mg/mL. Lysozyme, BSA, abatacept, and trastuzumab had degrees of labeling of 1, 3, 4, and 7, respectively.
Subsequent to determination of protein concentration and DOL measurements, samples were concentrated to ca. 20 mg/mL protein concentrations using Centricon YM-3 centrifugal filters (Millipore, Billerica, MA).
Silicone oil was stained with 4,4-difluoro-1,3,5,7,8-pentamethyl-4-bora-3a,4a-diaza-s-indacene (BODIPY® 493/503, Invitrogen Corporation). BODIPY dye was chosen for its nonpolar structure and previous use as a tracer for oil and other nonpolar lipids (BODIPY® 493/503 [product insert]). To facilitate the staining, solutions of both the BODIPY dye and silicone oil were prepared in mutually miscible solvents. BODIPY was dissolved in dimethylsulfoxide (DMSO) at a concentration of 2.5 mg/mL whereas 10 mL of silicone oil was dissolved in 20 mL dichloromethane (DCM). After the dye and silicone oil were both completely dissolved, 400 μL of the BODIPY-DMSO solution were added to the silicone oil-DCM solution and mixed for one hour. DMSO and DCM were then removed using a Laborota 4000 rotary evaporator (HeidolphBrinkmann, Elk Grove Village, IL).
Silicone Oil Emulsion Preparation
Silicone oil-in-aqueous buffer emulsions (ca. 0.5–1.0% v/v) were created by a combination of mechanical mixing and high-pressure homogenization. A 50 mL suspension of 4% (v/v) silicone oil in buffer was prepared by combining BODIPY-stained silicone oil and buffer in a stainless steel cylinder and mixing at room temperature with a 20 mm shaft rotor/stator (The VirTis Co., Virtishear Mechanical Homogenizer), for 5 min at 5000 rpm. Immediately thereafter, the silicone oil-in-buffer suspension was passed five times through a high-pressure homogenizer (Avestin, Inc., Emulsiflex C5 Homogenizer) at pressure of 50 MPa. The final emulsion, containing less than 1% (v/v) silicone oil, was collected in a 50 mL polypropylene centrifuge tube. The difference between the initial amount of silicone oil added and that present in the final emulsion was due to separation, or creaming, of the silicone oil in the sample chamber prior to passage through the emulsifier.
Given that the formulation additives chosen for this study could significantly affect the emulsification process, appropriate amounts of polysorbate 20, sodium chloride, or sucrose were added after emulsion formation to a standardized emulsion prepared in deionized water in order to obtain final excipient concentrations of 0.03% (w/v), 150 mM (0.9% w/v), or 250 mM (8.6% w/v), respectively. Mixtures were gently swirled until the excipients completely dissolved, and then the solutions were allowed to equilibrate for an hour before being used in experiments.
Silicone Oil Droplet Size
Silicone oil droplet size distributions in the emulsions were measured by laser diffraction analysis using a Coulter LS230 (Fullerton, CA). Particle size was calculated assuming Mie Scattering from spherical particles using the value of 1.4046 for the refractive index of the silicone oil [27].
Detection of Subvisible Particles with Flow Cytometry
Fluorescently labeled protein aggregates of subvisible size were created by agitating 1 mg/mL samples of BSA labeled with AF 647 (BSA-AF 647) in 10 mM sodium phosphate (pH 7.5), 0.01% sodium azide buffer. 0.5 mL samples in 1.5 mL polypropylene microcentrifuge tubes (Fisher Scientific, Hampton, NH) were placed horizontally on a Lab-Line titer plate shaker (Barnstead International, Dubuque, IA) and agitated at approximately 1000 rpm for 72 hours at room temperature. Aggregate size was determined using a NICOMP 380/ZLS (Particle Sizing System, Santa Barbara, CA) dynamic light scattering (DLS) instrument. This procedure generated BSA aggregates with a mean intensity-weighted diameter of 1.8 μm (data not shown).
The suspension of labeled BSA aggregates was then analyzed using a BD FACSCalibur™ instrument (Becton, Dickinson and Co Biosciences, San Jose, CA) equipped with a 488 nm blue air-cooled argon laser and 635 nm red diode laser, four fluorescence detectors (FL1 530/30, FL2 585/42, FL3 670LP, and FL4 661/16), and two 488 nm light scattering detectors (low-angle forward scattering (FSC) and 90° side scattering (SSC)). To observe whether or not the technique could detect aggregates in the absence of silicone oil, 5000 particles from the aggregate suspension were analyzed using the fluorescent signals detected by the FL1 (silicone oil-BODIPY) and FL4 (protein-AF 647) detectors. All flow cytometry data sets were collected using BD FACSFlow™ (Becton, Dickinson and Co Biosciences, San Jose, CA) sheath fluid and the low sample flow instrument option. All analyses of flow cytometry data were performed using FlowJo 8.8.6 (Tree Star, Inc., Ashland, OR).
To ascertain the ability of flow cytometry to detect silicone oil droplets in protein formulations, a BODIPY-stained silicone oil emulsion was mixed with BSA-AF 647 and the resulting suspension analyzed using the FACSCalibur™ instrument. FL1 and FL4 detector signals associated with 30,000 particles were utilized for this analysis.
To explore the ability of flow cytometry to resolve populations of homogeneous protein aggregates from silicone oil droplets with adsorbed protein, 250 μL of BSA-AF aggregate suspension was mixed with 250 μL of an emulsion consisting of silicone oil-BODIPY droplets with adsorbed BSA-AF 647. FL1 and FL4 signals from 30,000 particles were used for this analysis.
Silicone Oil Effects on Protein Formulation Stability
Samples with a final protein concentration of 200 μg/mL were created by combining appropriate amounts of protein solution with stock emulsion to a final silicone oil concentration of 0.5–1.0 % (v/v) in 5 mL round bottom, polystyrene tubes (BD Biosciences, San Jose, CA). Sample sets consisted of three separate samples of each protein in four different formulation conditions.
After varying periods of incubation (1, 8, 24, 72, 168 (1 week), and 336 hours (2 weeks)) at room temperature, samples were examined using flow cytometry for the presence of protein aggregates and for silicone oil droplets associated with protein. 30,000 events were collected for each analysis.
Results
Silicone Oil Droplet Size
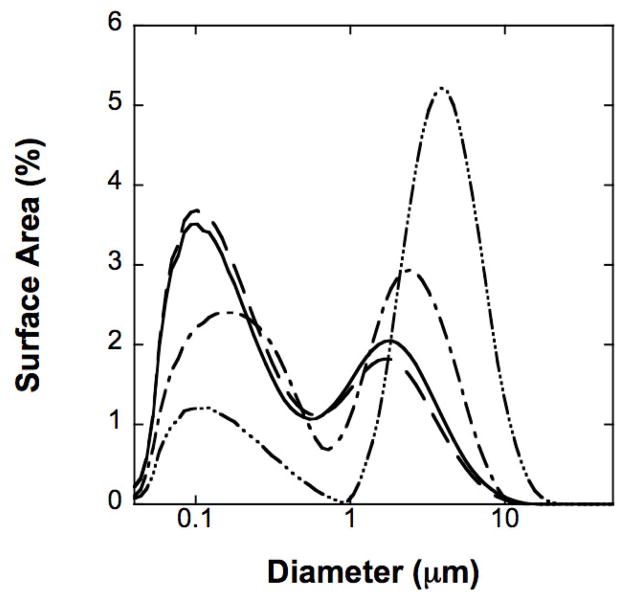
Representative silicone oil droplet size distributions for stock emulsions are shown in Figure 1. Surface area-weighted droplet size distributions of all emulsions were bimodal, with particle sizes ranging from nanometers to microns. The two main populations were centered around ca. 100 nm and ca. 5 μm. The effects of addition of various excipients on the silicone oil droplet size in silicone oil-in-aqueous buffer emulsions ranged from minimal to considerable (Figure 1). Addition of 0.03% polysorbate 20 did not significantly change the silicone oil droplet size distribution compared to that of the excipient-free emulsion, whereas the addition of 250 mM sucrose or 150 mM sodium chloride shifted the distribution towards larger silicone oil droplet sizes.
Figure 1.
Surface area-weighted particle size distribution of silicone oil droplets in 10 mM sodium phosphate, 0.01% sodium azide, pH 7.5 buffer. Solid line represents excipient-free; dashed line represents emulsions formed from solutions containing 0.03% polysorbate 20; dash-dot-dash line represents emulsions formed from solutions containing 250 mM sucrose; and dash-dot-dot-dot-dash line represents emulsions formed from solutions containing 150 mM NaCl. Data represent the arithmetic mean of three replicate samples.
Detection of Subvisible Particles with Flow Cytometry
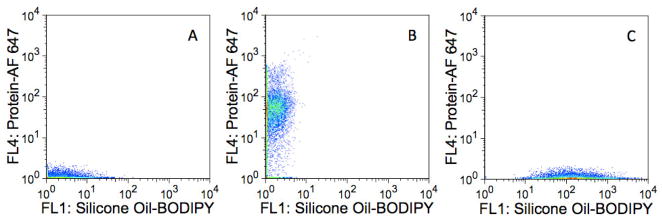
Flow cytometry analysis of the suspensions of aggregated, AF647-labeled BSA reported a population of particles with considerable fluorescence around 661 nm, the wavelength associated with AF 647 fluorescence, and minimal fluorescence near 530 nm, the wavelength corresponding to BODIPY fluorescence (Figure 2A).
Figure 2.
Detection of subvisible, homogeneous protein aggregates. Fluorescence dot plots of A) 1–2 μm homogeneous BSA-AF 647 aggregates in the absence of silicone oil; B) silicone oil-BODIPY droplets with adsorbed BSA-AF 647; and C) Mixture of homogeneous BSA-AF 647 aggregates and silicone oil-BODIPY droplets with adsorbed BSA-AF 647. The abscissas represent fluorescence intensities measured with the FL1 detector (530/30 nm) whereas the ordinates represent fluorescence intensities measured with the FL4 detector (661/16 nm). Panel A represents ca. 5000 collected events whereas B and C represent ca. 30,000 collected events.
Multiparameter analysis of a mixture of silicone oil-BODIPY droplets and BSA-AF 647 (non-agitated) revealed a population of particles with fluorescence characteristic of both AF 647 and BODIPY, indicative of protein associated with silicone oil (i.e. adsorbed onto the surface) (Figure 2B). However, there was no evidence of the presence of homogeneous protein aggregates.
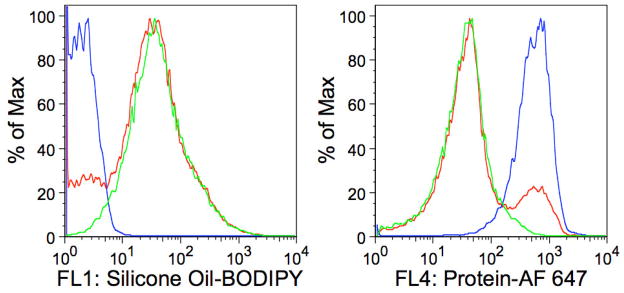
An examination of a mixture of the BSA-AF 647 agitated sample containing aggregates and the silicone oil-BODIPY droplets coated with BSA-AF 647 (non-agitated) showed two well-resolved populations of particles: one population exhibiting considerable AF 647 fluorescence and little BODIPY fluorescence (homogenous protein aggregates) and another group made up of particles exhibiting both AF 647 and BODIPY fluorescence (presumably protein adsorbed onto silicone oil droplets, Figure 2C). These differences were also observed when looking at particle BODIPY fluorescence and AF 647 fluorescence separately (Figure 3).
Figure 3.
Fluorescence histograms of analyzed particles. A) BODIPY fluorescence B) AF 647 fluorescence. Histograms are representations of the data from Figure 2 with the blue line representing the BSA-AF 647 aggregate suspension; the green line representing the silicone oil-BODIPY droplets with adsorbed BSA-AF 647; and the red line representing the mixture of the BSA-AF 647 aggregate suspension and silicone oil-BODIPY droplets with adsorbed BSA-AF 647. The abscissas represent fluorescence intensity measured with FL1 detector (530/30 nm) or FL4 detector (661/16 nm) whereas the ordinate represents number of events normalized to the maximum number of events recorded for any single fluorescence intensity (percent maximum events).
Silicone Oil Effects on Protein Formulation Stability
To further explore the ability of flow cytometry to detect and characterize subvisible particles in protein formulations and to investigate the effects of silicone oil droplets on formulation stability, each of the experimental protein formulations was added to its respective BODIPY-stained silicone oil emulsion. For example, BSA-AF 647 in 10 mM phosphate (pH 7.5), 150 mM sodium chloride was added to an emulsion of silicone oil-BODIPY droplets in 10mM phosphate (pH 7.5), 150 mM sodium chloride. To examine the effects of prolonged silicone oil exposure, samples were incubated and analyzed at defined time points over a two week period.
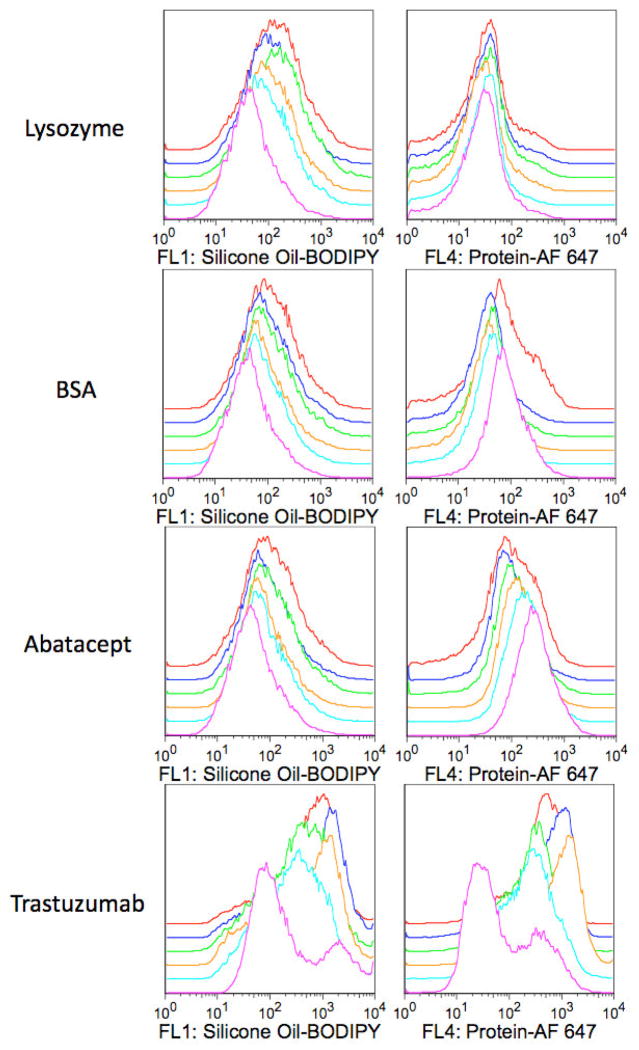
For each protein, Figure 4 shows a representative analysis of a protein-silicone oil mixture in an excipient-free formulation. For samples of lysozyme-AF 647, BSA-AF 647, or abatacept-AF 647 mixed with silicone oil-BODIPY droplets, histograms of BODIPY fluorescence showed a unimodal distribution of particles with a significant amount of BODIPY fluorescence characteristic of particles containing silicone oil. Similarly, histograms of AF 647 fluorescence showed a unimodal distribution of particles with significant AF 647 fluorescence indicative of particles associated with protein. These unimodal distributions of BODIPY and AF 647 fluorescence persisted over two weeks of incubation (Figure 4). After two weeks of incubation, AF 647 histograms for the BSA-AF 647 and abatacept-AF 647 formulations showed a broader distribution than the earlier time points, with an increase in particles with higher AF 647 fluorescence reflecting increased levels of protein (Figure 4).
Figure 4.
Flow cytometry analyses of protein-silicone oil mixtures in excipient-free formulations. Histograms illustrate particle BODIPY fluorescence intensities measured with the FL1 detector (530/30 nm, histograms on left) or AF 647 fluorescence intensities measured with the FL4 detector (661/16 nm, histograms on right) vs. percent maximum events. For each panel, histograms ordered from the lower most curve: Pink, light blue, orange, green, dark blue, or red histograms represent samples incubated for 1, 8, 24, 72, 168 (1 week), or 336 (2 weeks) hours, respectively. Histograms are offset for clarity and each histogram represents ca. 30,000 events.
For the samples of trastuzumab-AF 647 mixed with silicone oil-BODIPY droplets, histograms of BODIPY and AF 647 showed bimodal distributions (Figure 4). As incubation time increased, the distributions shifted to reflect populations of particles with increased AF 647 and BODIPY fluorescence, indicative of particles consisting of increased levels of both silicone oil and protein.
For each of the protein-silicone oil mixtures, the characteristic particle BODIPY and AF 647 fluorescence intensities were consistent for triplicate samples. The overlay of the fluorescence dot plots from three separate samples in Figure 5 illustrates the reproducibility.
Figure 5.
Sample-to-sample variation of protein-silicone oil mixtures in excipient-free formulations. Fluorescence dot plots of three separate samples of silicone oil-BODIPY droplets and A) lysozyme-AF 647; B) BSA-AF 647; C) abatacept-AF 647; or D) trastuzumab-AF 647. Each color represents a different sample. Each sample was incubated for 72 hours and each dot plot represents ca. 30,000 events. The abscissas represent fluorescence intensities measured with the FL1 detector (530/30 nm) whereas the ordinates represent fluorescence intensities measured with the FL4 detector (661/16 nm).
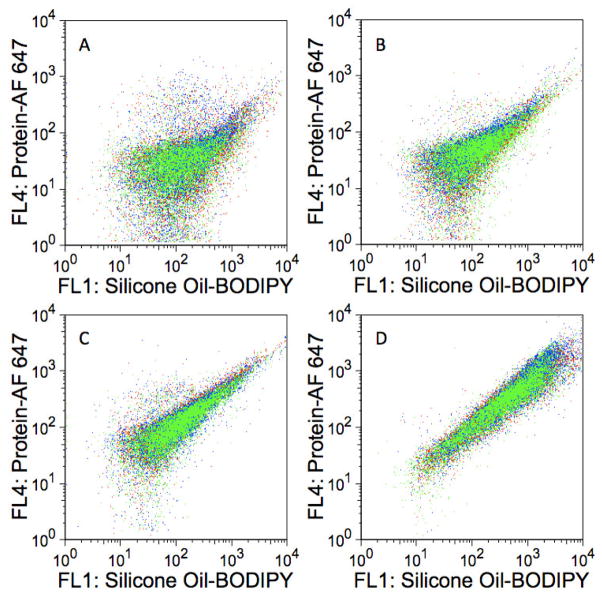
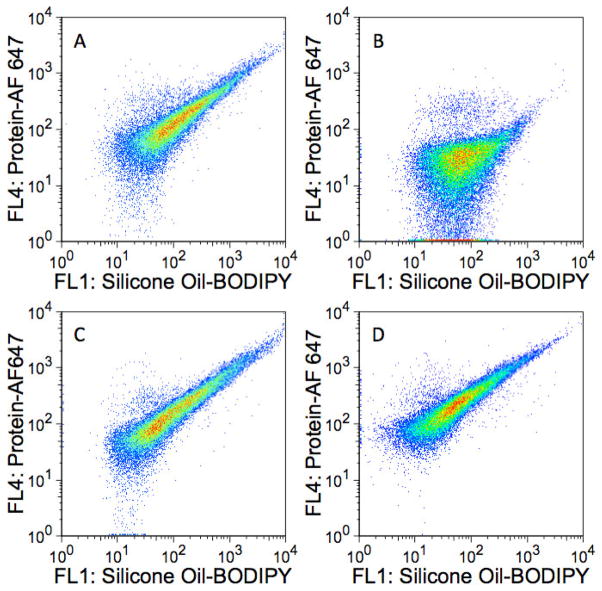
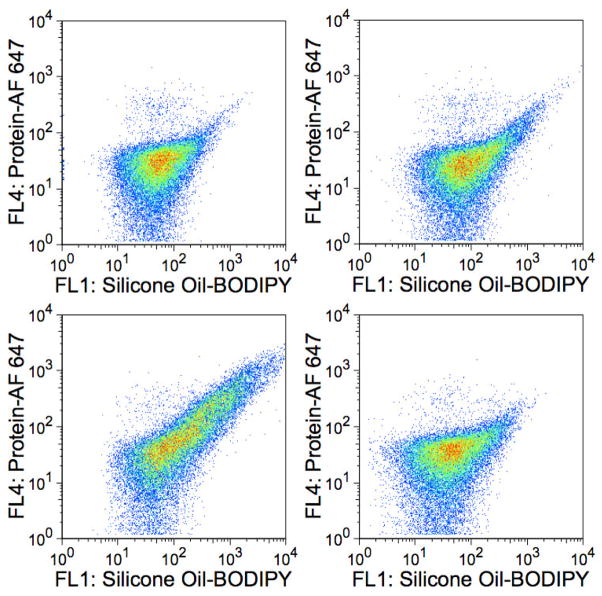
Similar to the excipient-free formulations, flow cytometry analyses of formulations containing 0.03% polysorbate 20, 150 mM sodium chloride, or 250 mM sucrose showed no evidence of a significant amount of homogeneous protein aggregates (data not shown). Although the tested formulation additives did not appear to affect the formation of homogeneous protein aggregates in formulations mixed with silicone oil-BODIPY emulsions, the addition of 0.03% polysorbate 20 had a noticeable effect on AF 647 particle fluorescence for BSA-AF 647, abatacept-AF 647, and trastuzumab-AF 647 formulations mixed with silicone oil-BODIPY emulsions. Figure 6 illustrates this effect for abatacept. The AF 647 fluorescence increases with BODIPY fluorescence at a similar rate in the excipient-free (Figure 6A), 150 mM sodium chloride (Figure 6C), and 250 mM sucrose formulations (Figure 6D). However, the AF 647 fluorescence does not significantly increase with increasing BODIPY fluorescence in the 0.03% polysorbate 20 formulation (Figure 6B). This suggests that the polysorbate 20 decreased the amount of protein adsorbed to the silicone oil. The addition of 0.03% polysorbate 20 to lysozyme-AF 647 formulations did not result in such dramatic effects (Figure 7).
Figure 6.
The effects of additives on the association of abatacept-AF 647 with silicone oil-BODIPY droplets. Dot plots represent silicone oil-BODIPY droplets coated with abatacept-AF 647 in formulations containing A) no additives (excipient-free); B) 0.03% polysorbate 20; C) 150 mM NaCl; or D) 250 mM sucrose. Each sample was incubated for 8 hours and each dot plot represents ca. 30,000 events. The abscissas represent fluorescence intensities measured with the FL1 detector (530/30 nm) whereas the ordinates represent fluorescence intensities measured with the FL4 detector (661/16 nm).
Figure 7.
The effects of additives on the association of lysozyme-AF 647 with silicone oil-BODIPY droplets. Dot plots represent silicone oil-BODIPY droplets coated with abatacept-AF 647 in formulations containing A) no additives (excipient-free); B) 0.03% polysorbate 20; C) 150 mM NaCl; or D) 250 mM sucrose. Each sample was incubated for 8 hours and each dot plot represents ca. 30,000 events. The abscissas represent fluorescence intensities measured with the FL1 detector (530/30 nm) whereas the ordinates represent fluorescence intensities measured with the FL4 detector (661/16 nm).
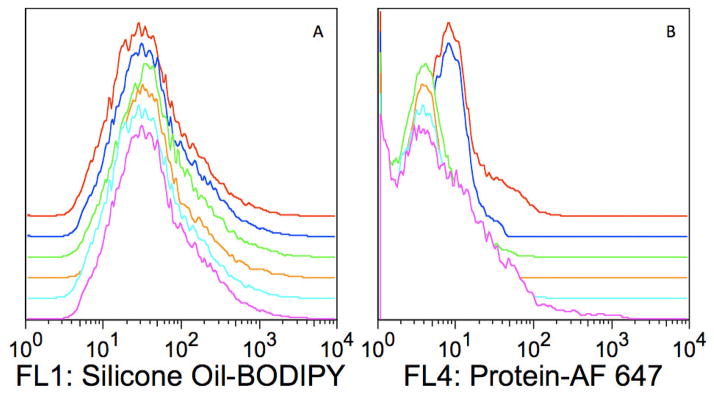
Furthermore, the addition of 0.03% polysorbate 20 to trastuzumab-AF 647 formulations mixed with silicone oil-BODIPY emulsions not only resulted in reduced AF 647 fluorescence (Figure 8B) but also resulted in unimodal BODIPY fluorescence histograms (Figure 8A) instead of the bimodal histograms seen in the excipient-free formulations (Figure 4). The unimodal distribution for the BODIPY histogram was not seen when 150 mM sodium chloride or 250 mM sucrose was added to trastuzumab-AF 647 formulations mixed with silicone oil-BODIPY emulsions (data not shown).
Figure 8.
Flow cytometry analyses of trastuzumab-AF647/silicone oil-BODIPY mixtures in 0.03% polysorbate 20 formulations. Histograms illustrate particle BODIPY fluorescence intensity measured with the FL1 detector (530/30 nm) (histograms in Panel A) or particle AF 647 fluorescence intensity measured with the FL4 detector (661/16 nm) (histograms in Panel B) plotted vs. percent maximum events. For each panel, histograms ordered from the lower most curve: Pink, light blue, orange, green, dark blue, and red histograms represent samples incubated for 1, 8, 24, 72, 168 (1 week), and 336 (2 weeks) hours, respectively. Traces are offset for clarity and each histogram represents ca. 30,000 events.
Discussion
Flow Cytometric Detection of Subvisible Particles
Laser diffraction particle size analysis of each of the stock silicone oil emulsions exhibited a bimodal particle size distribution, with a population of particles of size near 100 nm, and another population from 1–10 μm. (Figure 1). Despite the bimodal distribution of silicone oil droplets measured using laser diffraction (Figure 1), the majority of flow cytometry analyses resulted in a single distribution of particles. A likely reason for this discrepancy is that the FACSCalibur™ (along with most other commercially available flow cytometers) was designed primarily for intact cell analyses. In most cell preparations, submicron particles mostly consist of debris and are therefore irrelevant; as a result, nanometer size particles, such as the smaller size distribution of silicone oil droplets, tend to fall below the instrument’s lower size limit of detection [19]. This lack of sensitivity to smaller particles illustrates one of the drawbacks encountered using standard commercially-available flow cytometry instruments for the detection and study of subvisible particles. This apparent limitation in most cell-based standard instruments can be overcome by using a modified optical design for the purpose of detecting very small particles, and particles as small as 1 nm have been analyzed using flow cytometry [28].
Most flow cytometry instruments can detect micron-sized, subvisible particles (Figure 2). Dynamic light scattering determined the homogeneous protein aggregates from the stock BSA-AF647 suspension were 1.8 μm. Whereas particles of this size border on the threshold of detection for most commercially-available flow cytometers, the FACSCalibur™ used for this study appeared to efficiently detect the protein aggregate particles (Figure 2A).
Although the detection of subvisible, homogeneous protein aggregates or protein adsorbed to silicone oil droplets separately is straightforward, resolution of a mixture of these particles can be difficult. The ability of a flow cytometer to detect and resolve particles by fluorescence is largely dependent on the fluorescence detection efficiency of the detector, optical background, and electronic noise [29]. To ensure optimal performance, the instrument must be properly characterized and proper quality control procedures employed to verify performance. For a detailed explanation of instrument characterization, refer to the BD Bioscience Webinar entitled “The Digital Flow Cytometer: Performing Instrument Characterization for Optimal Setup” [30]. Another consideration when maximizing sensitivity is the number of events being analyzed per second (event count rate). Although most modern flow cytometers are capable of counting thousands of events per second, experiments run with lower flow and count rates are more likely to avoid particle coincidence, resulting in better resolution.
Silicone Oil Effects on Protein Formulation Stability
For all the formulations studied, there was no evidence of homogeneous protein aggregates. All of the detected particles exhibited both AF 647 and BODIPY fluorescence, demonstrating that the particles consisted of both protein and silicone oil. A likely reason for these findings is slow desorption kinetics of protein from the silicone oil-water interface. Studies have shown that whereas protein adsorption at liquid interfaces is thermodynamically reversible, the slow desorption kinetics would make it appear to be an irreversible process [31; 32], a claim supported by the experimental results of this study and previous work [18].
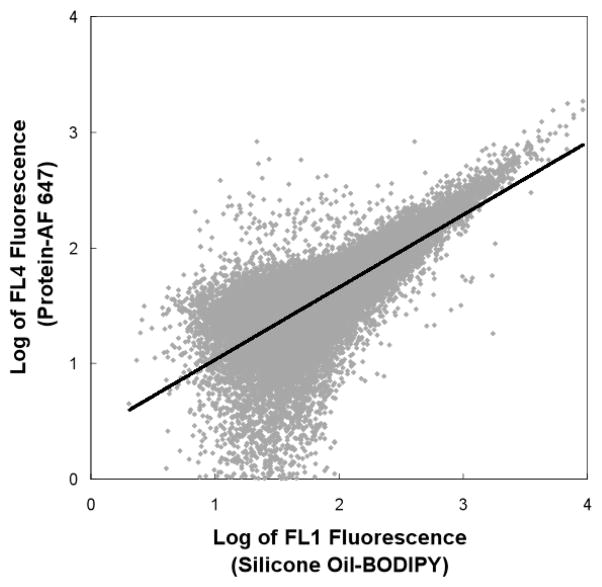
Closer inspection of plots of AF 647 vs. BODIPY fluorescence revealed more detailed information about the relationship between the protein and silicone oil droplets. Because BODIPY was uniformly dispersed throughout the silicone oil, BODIPY fluorescence intensity is expected to be proportional to the silicone oil volume. In contrast, AF 647 fluorescence intensity is proportional to the amount of protein on the surface of silicone oil droplets. Thus, assuming spherical droplets with uniform protein coatings, the slope of a log-log plot of AF 647 fluorescence intensity vs. BODIPY fluorescence intensity is expected to exhibit a slope of 2/3. Alternatively, the slope of a log-log plot of AF 647 fluorescence intensity versus BODIPY fluorescence intensity would approach 1 if small oil droplets coalesced to form larger droplets without desorbing their respective protein layers. Data from flow cytometry analyses were exported to Microsoft Excel and a linear regression was performed on log-log plots of AF 647 fluorescence intensity vs. BODIPY fluorescence intensity. A representative linear regression of one of these analyses is shown in Figure 9, and all of the analyses are summarized in Table 1.
Figure 9.
Slope analysis of BSA-AF 647 adsorbed onto silicone oil-BODIPY droplets. A slope of 0.65 was calculated from a linear regression of a log-log plot of FL4 fluorescence (protein-AF 647) vs FL1 fluorescence (silicone oil-BODIPY).
Table I.
Relationship between AF 647 and BODIPY Fluorescence. The relationship is illustrated by the slope calculated from linear regressions of log-log plots of the FL1 fluorescence (silicone oil-BODIPY) vs. FL4 fluorescence (protein-AF 647). Values represent the average slope of 18 different linear regressions (3 replicate samples for each of six time points). The reported ± denotes one standard deviation from the arithmetic mean.
| Protein | Formulation Additive | |||
|---|---|---|---|---|
| Excipient- Free | 0.03% Polysorbate 20 | 150mM NaCl | 250mM Sucrose | |
| lysozyme-AF 647 | 0.50 ± 0.14 | 0.51 ± 0.11 | 0.79 ± 0.09 | 0.47 ± 0.08 |
| BSA-AF 647 | 0.66 ± 0.05 | 0.44 ± 0.07 | 0.73 ± 0.05 | 0.59 ± 0.02 |
| abatacept-AF 647 | 0.68 ± 0.03 | 0.47 ± 0.06 | 0.74 ± 0.04 | 0.61 ± 0.03 |
| trastuzumab-AF 647 | 0.78 ± 0.03 | 0.33 ± 0.18 | 0.84 ± 0.02 | 0.80 ± 0.05 |
For samples of BSA-AF 647 or abatacept-AF 647 mixed with silicone oil-BODIPY emulsions in excipient-free formulations, linear regression analyses resulted in slopes near 2/3, consistent with protein adsorption onto the silicone oil droplet surface. Similar analyses of samples containing 250 mM sucrose resulted in slopes slightly lower than 2/3, whereas the slopes calculated for samples containing 150 mM sodium chloride were slightly higher than 2/3.
For lysozyme-AF 647 formulations mixed with silicone oil-BODIPY emulsions, the slope of a plot of the logarithm of the AF 647 fluorescence plotted versus the logarithm of the BODIPY fluorescence was lower than 2/3 for formulations containing no additives or 250 mM sucrose. Likewise, formulations containing polysorbate 20 showed slopes less than 2/3. Thus, for these formulations, the apparent protein surface coverage of the larger particles, when normalized by the volume of silicone oil, was less that that of the smaller particles. The cause of this phenomenon remains unclear.
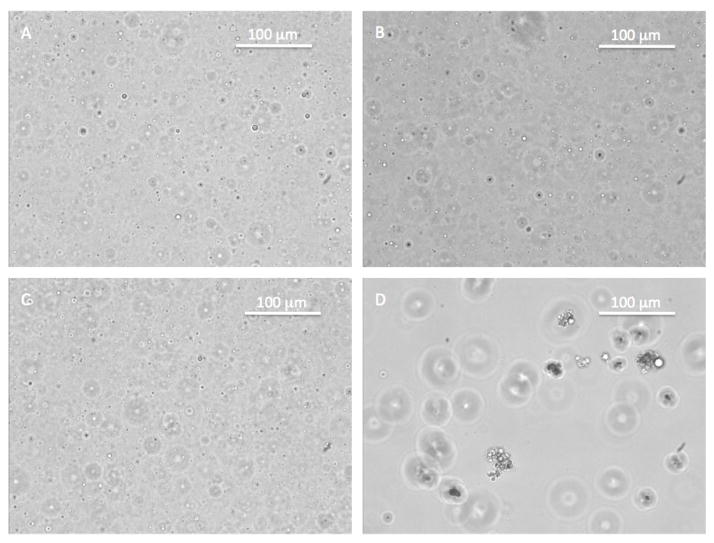
We used light microscopy to probe whether flocculation might explain the behavior of trastuzumab-AF 647/silicone oil-BODIPY formulations where we observed relatively high slopes of log-log plots of AF 647 fluorescence versus BODIPY fluorescence. Particles were imaged using an Eclipse TE2000-S inverted optical microscope (Nikon Instruments Inc., Melville, NY) with a CoolSNAP ES CCD camera (Photometrics, Tucson, AZ). Images of particles from lysozyme-AF 647, BSA-AF 647, and abatcept-AF 647 formulations mixed with silicone oil-BODIPY emulsions showed separated, individual droplets, whereas images of particles from the trastuzumab-AF 647 formulation mixed with silicone oil-BODIPY droplets showed large floccules of smaller droplets (Figure 10). Thus, droplet flocculation is a plausible explanation for slopes greater than 2/3 observed for trastuzumab formulations (Table 1).
Figure 10.
Light microscopy images of silicone oil-BODIPY droplets coated with A) lysozyme AF-647; B) BSA-AF 647; C) abatacept-AF 647; or D) trastuzumab-AF 647 at 200X magnification.
Fluorescent Labels
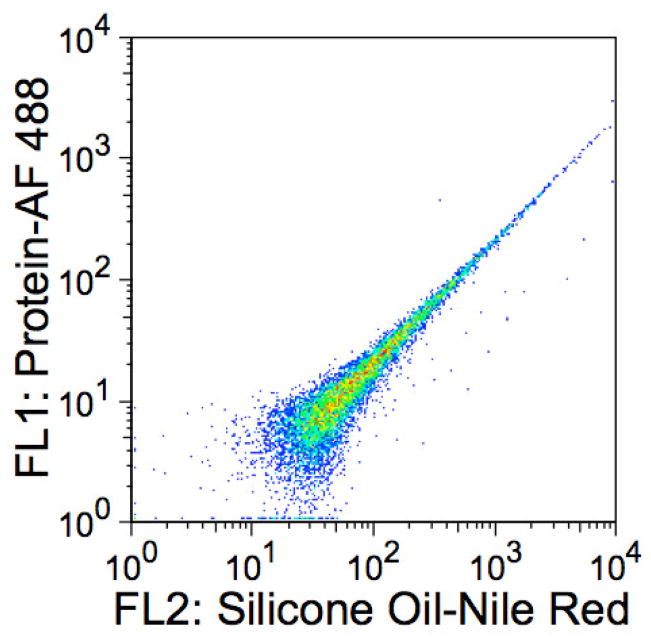
For multicolor flow cytometry analyses, the choice of fluorescent labels warrants some consideration, because most fluorescent materials emit over a fairly broad range of wavelengths. Although a fluorescent label may have an emission maximum near or in the range of a specific flow cytometry detector, the possibility remains that the label will also emit in the range of another detector. For example, 9-diethylalamino-5-benzophenozazine-5-one (Nile red) dye, is a polarity-sensitive fluorophore used to probe hydrophobic surfaces [33]. With its ability to be excited using a 488 nm laser (standard for most flow cytometers) and its emission maximum of 628 nm [34] (suitable for the FL2 585/42 BD FACSCalibur™ detector), Nile red would seem to be an ideal dye with which to stain silicone oil for flow cytometry analysis. However, Nile red has a broad emission spectrum that ranges from below 600 nm to beyond 700 nm depending on the environment. The spillover of the Nile red fluorescence emission into other detectors can lead to decreased sensitivity and improper data interpretation by significantly increasing the optical background.
Figure 11 shows an example of Nile red fluorescence spillover into the FL1 530/30 detector often used to detect fluorescein isothiocyanate (FITC) or Alexa Fluor® 488 (AF 488) conjugated materials. Even though the sample contained no FITC or AF 488 fluorophores, the FL1 detector registers a considerable signal because of the spillover of nile red fluorescence. If an experiment were performed using a protein labeled with AF 488 and silicone oil stained with Nile red, interpretation of the FL1 data would be difficult or impossible because Nile red contributes enormous optical background in FL1 and would dramatically decrease the sensitivity to any AF 488 labeled protein. Flow cytometry analysis software does have the ability to compensate (correct) for spillover. Good general practice for flow cytometry experiments is to eliminate or minimize spillover whenever possible because compensation essentially translocates population medians while preserving the measured variance, which in this case would be large. Therefore, large optical background contributions result is much larger population CVs (broad populations) after compensation and it becomes desirable to pick fluorescent labels with emissions that have minimal overlap for multicolor flow cytometry experiments. This is not difficult with the multiple excitation and detection capabilities of modern instruments. For this work, Alexa Fluor 647 and BODIPY 493/503 were adequate fluorescent label choices for flow cytometry analysis because neither label’s fluorescence contributes significant optical background into the other’s detector (Figure 12).
Figure 11.
Spectral overlap of nile red fluorescence from the FL2 detector into the FL1 detector on a BD FACScan™ instrument (Becton, Dickinson and Co Biosciences, San Jose, CA). Sample consisted of only silicone oil-nile red droplets.
Figure 12.
Tests for spectral emission overlap (optical spillover). Fluorescence dot plots of samples of A) unlabeled silicone oil and unlabeled protein; B) unlabeled silicone oil and BSA-AF647; and C) silicone oil-BODIPY droplets with unlabeled BSA.
For this study, fluorescent labeling was utilized to aid in the characterization of particles as either homogeneous protein aggregates or silicone droplets with adsorbed protein. However, conclusions from experiments of fluorescently-labeled systems can have limitations, particularly when applying findings to the unlabeled systems. Labeling a molecule with a fluorescent marker modifies the properties of the molecule, which may change intra and intermolecular interactions.
For example, Alexa Fluor dyes carry a negative charge [35]; therefore, labeling a protein with one or more Alex Fluor molecules results in a molecule with a lower charge, which could change electrostatic interactions. In this study, mixtures of trastuzumab-AF 647 with silicone oil-BODIPY emulsions in excipient-free formulations exhibited behavior consistent with flocculation. However, flocculation was not observed in previous work using unlabeled trastuzumab and unlabeled emulsion [18]. A likely reason for this discrepancy is modulation of electrostatic interactions due to fluorescent labeling. At the formulation pH used for both studies, trastuzumab would be expected to have a positive charge (pI = 9.2) [36]. Labeling the protein with AF 647 decreases the molecular charge, dampening electrostatic repulsion, which, subsequent to adsorption onto the surface of silicone oil droplets, may allow droplet flocculation. Attempts to measure the zeta potential of particles in fluorescently-labeled systems were unsuccessful because the light source wavelength (633 nm) used by commercially available instruments also excites the AF 647 fluorophore.
One option to avoid these complications is to use intrinsic system properties for characterization analysis. Forward angle light scatter is strongly influenced by particle size and refractive index, whereas side scattering in addition to being size-related tends to emphasize particle granularity or internal particle structure [28]. Previous work has shown the ability of flow cytometry to resolve populations of granulocytes, monocytes, and lymphocytes without the use of fluorescent labels [28].
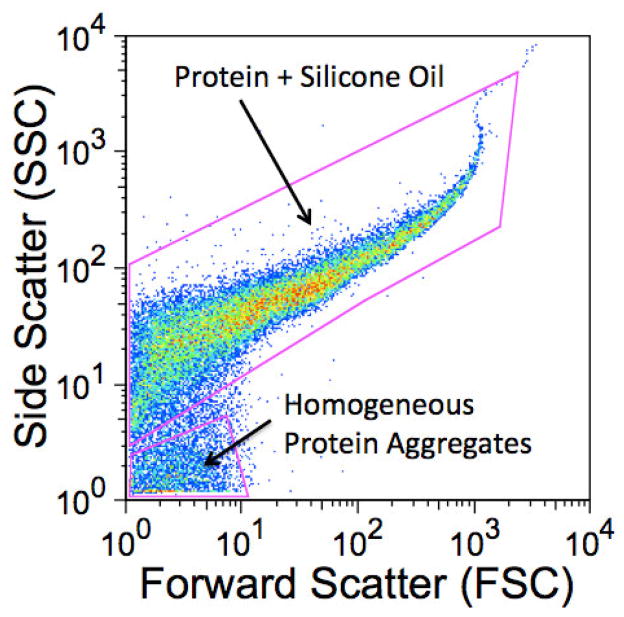
For this work, a plot of FSC vs. SSC for the mixture of the agitated sample containing BSA-AF 647 aggregates and silicone-BODIPY droplets with adsorbed BSA-AF 647 (non-agitated) resulted in two populations of particles (Figure 13). These particles were characterized as homogeneous protein aggregates or silicone oil droplets with adsorbed protein based on gates from AF 647 fluorescence vs. BODIPY fluorescence dot plots (Figure 2C). Although the populations are not as well resolved as the corresponding groups seen in the fluorescence dot plot of the same sample (Figure 2C), the scatter plot does illustrate the possibility of resolving particles without the use of extrinsic properties.
Figure 13.
Light scatter dot plot of a mixture of homogeneous protein aggregates and silicone oil droplets with adsorbed protein. Light scattering measured at 90° (side scatter, SSC) is plotted against low angle light scattering (FSC) for the sample whose fluorescence is plotted in Figure 2.
Conclusion
This study demonstrates the utility of flow cytometry as an analytical tool for the study of subvisible particles in protein formulations. In a matter of seconds, flow cytometry can measure the optical properties of thousands of different particles, making it a high-throughput technique for the study of particle suspensions. Furthermore, flow cytometry can provide insight into how formulation additives affect protein-silicone oil interactions, making it a potentially useful formulation screening tool.
Acknowledgments
We would like to thank Dr. Brent Palmer and Michelle Dsouza from the Clinical Immunology Flow Cytometry/Cell Sorting facility at the University of Colorado at Denver for their assistance while using their facilities.
Footnotes
Publisher's Disclaimer: This is a PDF file of an unedited manuscript that has been accepted for publication. As a service to our customers we are providing this early version of the manuscript. The manuscript will undergo copyediting, typesetting, and review of the resulting proof before it is published in its final citable form. Please note that during the production process errors may be discovered which could affect the content, and all legal disclaimers that apply to the journal pertain.
References
- 1.Carpenter JF, Randolph TW, Jiskoot W, Crommelin DJ, Middaugh CR, Winter G, Fan YX, Kirshner S, Verthelyi D, Kozlowski S, Clouse KA, Swann PG, Rosenberg A, Cherney B. Overlooking subvisible particles in therapeutic protein products: gaps that may compromise product quality. J Pharm Sci. 2009;98:1201–5. doi: 10.1002/jps.21530. [DOI] [PMC free article] [PubMed] [Google Scholar]
- 2.Kerwin BA, Akers MJ, Apostol I, Moore-Einsel C, Etter JE, Hess E, Lippincott J, Levine J, Mathews AJ, Revilla-Sharp P, Schubert R, Looker DL. Acute and long-term stability studies of deoxy hemoglobin and characterization of ascorbate-induced modifications. J Pharm Sci. 1999;88:79–88. doi: 10.1021/js980221r. [DOI] [PubMed] [Google Scholar]
- 3.Hawe A, Friess W. Stabilization of a hydrophobic recombinant cytokine by human serum albumin. J Pharm Sci. 2007;96:2987–99. doi: 10.1002/jps.20909. [DOI] [PubMed] [Google Scholar]
- 4.Tyagi AK, Randolph TW, Dong A, Maloney KM, Hitscherich C, Jr, Carpenter JF. IgG particle formation during filling pump operation: a case study of heterogeneous nucleation on stainless steel nanoparticles. J Pharm Sci. 2009;98:94–104. doi: 10.1002/jps.21419. [DOI] [PubMed] [Google Scholar]
- 5.U.S. Pharmacopeia, <788> Particulate Matter in Injections, USP-NF, 2006.
- 6.Chi EY, Krishnan S, Kendrick BS, Chang BS, Carpenter JF, Randolph TW. Roles of conformational stability and colloidal stability in the aggregation of recombinant human granulocyte colony-stimulating factor. Protein Sci. 2003;12:903–13. doi: 10.1110/ps.0235703. [DOI] [PMC free article] [PubMed] [Google Scholar]
- 7.Chi EY, Weickmann J, Carpenter JF, Manning MC, Randolph TW. Heterogeneous nucleation-controlled particulate formation of recombinant human platelet-activating factor acetylhydrolase in pharmaceutical formulation. J Pharm Sci. 2005;94:256–74. doi: 10.1002/jps.20237. [DOI] [PubMed] [Google Scholar]
- 8.Koren E, Zuckerman LA, Mire-Sluis AR. Immune responses to therapeutic proteins in humans--clinical significance, assessment and prediction. Curr Pharm Biotechnol. 2002;3:349–60. doi: 10.2174/1389201023378175. [DOI] [PubMed] [Google Scholar]
- 9.Li J, Yang C, Xia Y, Bertino A, Glaspy J, Roberts M, Kuter DJ. Thrombocytopenia caused by the development of antibodies to thrombopoietin. Blood. 2001;98:3241–8. doi: 10.1182/blood.v98.12.3241. [DOI] [PubMed] [Google Scholar]
- 10.Schellekens H. Immunogenicity of therapeutic proteins: clinical implications and future prospects. Clin Ther. 2002;24:1720–40. doi: 10.1016/s0149-2918(02)80075-3. discussion 1719. [DOI] [PubMed] [Google Scholar]
- 11.Fries A. Drug Delivery of Sensitive Biopharmaceuticals with Pefilled Syringes. Drug Delivery Technology. 2009;9:22–27. [Google Scholar]
- 12.Varaprath S, Frye CL, Hamelink J. Aqueous solubility of permethylsiloxanes (silicones) Environmental Toxicology and Chemistry. 1996;15:1263–1265. [Google Scholar]
- 13.Chantelau EA, Berger M. Pollution of insulin with silicone oil, a hazard of disposable plastic syringes. Lancet. 1985;1:1459. doi: 10.1016/s0140-6736(85)91892-6. [DOI] [PubMed] [Google Scholar]
- 14.Chantelau E, Berger M, Bohlken B. Silicone oil released from disposable insulin syringes. Diabetes Care. 1986;9:672–3. doi: 10.2337/diacare.9.6.672. [DOI] [PubMed] [Google Scholar]
- 15.Bernstein RK. Clouding and deactivation of clear (regular) human insulin: association with silicone oil from disposable syringes? Diabetes Care. 1987;10:786–7. doi: 10.2337/diacare.10.6.786. [DOI] [PubMed] [Google Scholar]
- 16.Jones LS, Kaufmann A, Middaugh CR. Silicone oil induced aggregation of proteins. J Pharm Sci. 2005;94:918–27. doi: 10.1002/jps.20321. [DOI] [PubMed] [Google Scholar]
- 17.Thirumangalathu R, Krishnan S, Ricci MS, Brems DN, Randolph TW, Carpenter JF. Silicone oil- and agitation-induced aggregation of a monoclonal antibody in aqueous solution. J Pharm Sci. 2009 doi: 10.1002/jps.21719. [DOI] [PMC free article] [PubMed] [Google Scholar]
- 18.Ludwig DB, Carpenter JF, Hamel JB, Randolph TW. Protein adsorption and excipient effects on kinetic stability of silicone oil emulsions. J Pharm Sci. 2010;99:1721–33. doi: 10.1002/jps.21982. [DOI] [PubMed] [Google Scholar]
- 19.Shapiro HM. Practical flow cytometry. Wiley-Liss; New York: 1995. [Google Scholar]
- 20.Becton_Dickinson . Introduction to Flow Cytometry Web-Based Training. 2005. [Google Scholar]
- 21.Orencia [product insert] Bristol-Myers Squib Company; Princeton, NJ: 2005. [Google Scholar]
- 22.Herceptin [product insert] Genentech, Inc; San Franisco, CA: 2005. [Google Scholar]
- 23.Hamaguchi K, Kurono A. Structure of Muramidase (Lysozyme). I. The Effect of Guanidine Hydrochloride on Muramidase. J Biochem. 1963;54:111–22. [PubMed] [Google Scholar]
- 24.Peters T. All About Albumin: Biochemistry, Genetics, and Medical Applications. Academic Press; San Diego: 1995. [Google Scholar]
- 25.Bristol-Myers_Squib . Orencia [product monograph] Bristol-Myers Squib Company; Canada: 2009. [Google Scholar]
- 26.Cirstoiu-Hapca A, Bossy-Nobs L, Buchegger F, Gurny R, Delie F. Differential tumor cell targeting of anti-HER2 (Herceptin) and anti-CD20 (Mabthera) coupled nanoparticles. Int J Pharm. 2007;331:190–6. doi: 10.1016/j.ijpharm.2006.12.002. [DOI] [PubMed] [Google Scholar]
- 27.Dow_Corning . DOW CORNING 360 Medical Fluid [product information] Dow Corning Corporation; 2009. [Google Scholar]
- 28.Cram LS. Flow cytometry, an overview. Methods Cell Sci. 2002;24:1–9. doi: 10.1023/a:1024198904819. [DOI] [PubMed] [Google Scholar]
- 29.Wood JC. Fundamental flow cytometer properties governing sensitivity and resolution. Cytometry. 1998;33:260–6. [PubMed] [Google Scholar]
- 30.Trotter J B. Biosciences. BD Bioscience Webinar Series. 2006. The Digital Flow Cytometer: Performing Instrument Characterization for Optimal Setup. [Google Scholar]
- 31.Dickinson E, McClements DJ. Advances in food colloids. Blackie Academic & Professional; London; New York: 1996. [Google Scholar]
- 32.Fainerman VB, Miller R, Ferri JK, Watzke H, Leser ME, Michel M. Reversibility and irreversibility of adsorption of surfactants and proteins at liquid interfaces. Adv Colloid Interface Sci. 2006;123–126:163–71. doi: 10.1016/j.cis.2006.05.023. [DOI] [PubMed] [Google Scholar]
- 33.Davis MM, Hetzer HB. Titrimetric and Equilibrium Studies Using Indicators Related to Nile Blue A. Analytical Chemistry. 1966;38:451. [Google Scholar]
- 34.Du H, Fuh RCA, Li JZ, Corkan LA, Lindsey JS. PhotochemCAD: A computer-aided design and research tool in photochemistry. Photochemistry and Photobiology. 1998;68:141–142. [Google Scholar]
- 35.Panchuk-Voloshina N, Haugland RP, Bishop-Stewart J, Bhalgat MK, Millard PJ, Mao F, Leung WY. Alexa dyes, a series of new fluorescent dyes that yield exceptionally bright, photostable conjugates. J Histochem Cytochem. 1999;47:1179–88. doi: 10.1177/002215549904700910. [DOI] [PubMed] [Google Scholar]
- 36.Wiig H, Gyenge CC, Tenstad O. The interstitial distribution of macromolecules in rat tumours is influenced by the negatively charged matrix components. J Physiol. 2005;567:557–67. doi: 10.1113/jphysiol.2005.089615. [DOI] [PMC free article] [PubMed] [Google Scholar]


