Abstract
The maximum capacity of a hydrophobic adsorbent is interpreted in terms of square or hexagonal (cubic and face-centered-cubic, FCC) interfacial packing models of adsorbed blood proteins in a way that accommodates experimental measurements by the solution-depletion method and quartz-crystal-microbalance (QCM) for the human proteins serum albumin (HSA, 66 kDa), immunoglobulin G (IgG, 160 kDa), fibrinogen (Fib, 341 kDa), and immunoglobulin M (IgM, 1000 kDa). A simple analysis shows that adsorbent capacity is capped by a fixed mass/volume (e.g. mg/mL) surface-region (interphase) concentration and not molar concentration. Nearly analytical agreement between the packing models and experiment suggests that, at surface saturation, above-mentioned proteins assemble within the interphase in a manner that approximates a well-ordered array. HSA saturates a hydrophobic adsorbent with the equivalent of a single square-or-hexagonally-packed layer of hydrated molecules whereas the larger proteins occupy two-or-more layers, depending on the specific protein under consideration and analytical method used to measure adsorbate mass (solution depletion or QCM). Square-or-hexagonal (cubic and FCC) packing models cannot be clearly distinguished by comparison to experimental data. QCM measurement of adsorbent capacity is shown to be significantly different than that measured by solution depletion for similar hydrophobic adsorbents. The underlying reason is traced to the fact that QCM measures contribution of both core protein, water of hydration, and interphase water whereas solution depletion measures only the contribution of core protein. It is further shown that thickness of the interphase directly measured by QCM systematically exceeds that inferred from solution-depletion measurements, presumably because the static model used to interpret solution depletion does not accurately capture the complexities of the viscoelastic interfacial environment probed by QCM.
Keywords: Protein adsorption, solution depletion, quartz crystal microbalance, interphase
1. Introduction
Proteins adsorbed to hydrophobic surfaces apparently occupy an interfacial region (a.k.a. interphase) that can be 100–500X more concentrated than the bulk solution from which protein adsorbs [1–3]. In fact, interphase concentrations can exceed protein solubility limits if the bulk-solution concentration is equal to, or greater than, that required to completely saturate the adsorbent (the adsorbent capacity). For example, neutron reflectometry (NR) of human serum albumin (HSA) adsorbed to the solution-air (liquid-vapor, lv) surface [4] resolves a single interfacial layer with thickness at a surface capacity mg/m2, where the “max” superscript denotes a saturated adsorbent surface and the subscript denotes the solution-air interface [2]. This translates into a saturated interphase concentration mM or 442 mg/mL; approximately 8X the serum albumin solubility limit [2]. These surprisingly-high concentrations arise because protein mass is captured in a molecularly-thin interphase in a way that amplifies the ordinary sense of concentration. Nevertheless, chemical potential of adsorbed protein is an explicit function of interfacial concentration (mole fraction or activity), not adsorbed mass or adsorbed mass per-unit-surface area [5, 6]. Hence, interphase concentration is a highly relevant parameter in consideration of mechanisms of the biological response to materials.
Evidently then, adsorbed HSA molecules assemble at the solution-air interface in a close-packed and possibly well-ordered molecular layer. Herein we explore the generality of this finding by using square or hexagonal (cubic and face-centered-cubic, FCC) packing models to interpret adsorbent capacity of model hydrophobic adsorbents measured by solution depletion [7] and quartz crystal microbalance (QCM). Proteins of different sizes (HSA, IgG, Fib, and IgM) are compared in a way that gives insights into how adsorbed proteins are distributed within the interphase.
2. Methods and Materials
2.1 Protein Solutions
Table 1 lists relevant details for proteins used in this work as received from the vendor without further purification. SDS-PAGE of these proteins yielded single bands. Proteins were freshly dissolved in phosphate buffer solution (PBS; Sigma; 0.14 M NaCl, 3mM KCl prepared in 18 MΩ water; pH = 7.2) to the desired concentration for solution-depletion or QCM measurement of adsorption isotherms, as described below.
Table 1.
Proteins Used in Measurement of Adsorption Isotherms by Solution Depletion and QCM
| Solution Depletion | QCM | Protein Dimensions | |||||
|---|---|---|---|---|---|---|---|
| Protein | Molecular Weight (kDa) |
Vendor | Form (Purity) |
Vendor | Form (Purity) |
Hydrated Molecular Radius (nm) |
Radius Ratio to HSA (Dimensionless) |
| Human Serum Albumin (HSA) | 66.3 | Sigma Aldrich | Powder (96–99%) | Sigma Aldrich | Powder (96–99%) | 3.5 | 1 |
| Fibrinogen (Fib) | 341 | Sigma Aldrich | Powder (80% clottable) | Sigma Aldrich | Powder (80% clottable) | 4.7 | 1.3 |
| Immunoglobulin G (IgG) | 160 | Sigma Aldrich | Powder (>95%) | Sigma Aldrich | Powder >95% | 6.1 | 1.7 |
| Immunoglobulin M (IgM) | 970–1000 | Scipac (UK) | Solution (2.2 mg/mL >96%) | MP Biomedicals | Solution (5 mg/ml >95%) | 8.7 | 2.5 |
Notes: Hydrated protein radius given by R = 1.3rv where rv = 6.72×10⁻⁸ MW1/3 in cm for MW in kDa.
2.2 Measurement of Adsorption Isotherms by Solution Depletion
Experimental details of using the solution-depletion method for measuring adsorption isotherms of both purified proteins and mixtures have been disclosed elsewhere [3, 5, 7–10]. Briefly, for the purposes of this report, protein solutions (30 µL) in PBS at various concentrations were mixed with a measured weight of adsorbent particles by gentle pipette aspiration. Solution and particles were allowed to stand undisturbed in 0.5 mL conical microtubes for 1 hr. before analysis. Cited prior work comparing adsorption from continuously-mixed and unmixed solutions revealed that mixing had no effect on the amount of protein adsorbed from purified-protein solution (see especially ref. [5]). Full adsorption isotherms of each protein of Table 1 were measured from which adsorbent capacities reported in Table 2 were extracted. Data of Table 2 corresponding to solution depletion were taken from ref. [7] for adsorbent type 1 of that work (0.38 ± 0.09 m2/g glass particles silanized with octadecyltricholorosilane and subsequently dip coated in a 0.2% solution of 1,1-pentadecaflurooctylmethacrylate in tricholorotrifloroethane; Nye Lubricants, Fairhaven, MA). This surface treatment reliably produced hydrophobic adsorbent particles with an advancing water contact angle between 110– 115° that compared favorably with methyl-terminated thiol-coated gold surfaces used in QCM experiments described below. Although fluoromethacrylate surface chemistry was clearly different than that of methyl-terminated thiol, we have observed that protein adsorption is a function of water wettability with little-or-no observable relationship to hydrophobic surface chemistry which interacts with water and protein only through dispersion forces [11–13]. This observation justified comparison of the adsorbent capacity of hydrophobic particles measured by solution depletion to the adsorbent capacity of a planar hydrophobic QCM sensor.
Table 2.
Mass and Molar Adsorbent Capacity by Solution Depletion and QCM
| Solution Depletion | QCM | ||||
|---|---|---|---|---|---|
| Protein | Molecular Weight (kDa) |
(µg/cm2) | (picomoles/cm2) | (µg/cm2) | (picomoles/cm2) |
| HSA | 66 | 0.25±0.05 | 3.79±0.76 | 0.83±0.05 | 12.50±0.81 |
| 0.21±0.02 | 3.18±0.30 | - | - | ||
| 0.21±0.01 | 3.18±0.15 | - | - | ||
| IgG | 160 | 0.58±0.01 | 3.62±0.06 | 1.87±0.04 | 11.70±0.27 |
| Fib | 341 | 0.87±0.03 | 2.55±0.09 | 4.12±0.14 | 12.10±0.40 |
| IgM | 1000 | 1.11±0.01 | 1.11±0.01 | - | - |
Notes: Solution depletion data taken from ref. [7]. QCM = quartz crystal microbalance. Adsorbed layers of IgM exceeded QCM sampling volume.
2.3 Measurement of Adsorption Isotherms Using the Quartz Crystal Microbalance (QCM)
Experimental details describing the microQCM array applied herein have been disclosed elsewhere [14, 15]. Briefly, for the purposes of this report, micromachined gold-coated QCM electrode surfaces were cleaned by 3 cycles of exposure to UV and ozone, each 15 minutes long, followed by thorough rinsing and immersion in ethanol for 1 hour. The sensor surface was subsequently hydrophobized by immersion in 1mM hexadecanethiol solution for 24 hours. This procedure resulted in the formation of a close-packed, hexadecanethiolate self-assembled monolayer (HD-SAM) reliably exhibiting an advancing water contract angle near 115°. All frequency measurements reported in this work were performed using an Agilent 4395A impedance analyzer with the QCM mounted in polytetrafluororethylene (Teflon) test cell appliance that allowed for exposure of one of its electrodes to air, water, or PBS as required. Open, short, and load (51 ohm) circuit compensation fixtures were used prior to the measurement of QCM resonance parameters. The impedance analyzer was set-up to simultaneously measure the impedance magnitude and phase angle as a function of frequency. All measurements were carried out within a 4.7×4.7×3.54 inch aluminum die-cast temperature-controlled box to prevent RF interference and the temperature set at 25±0.1 °C. A National Instruments RF multiplexer module was used to switch between the quartz resonator pixels. Labview data acquisition software was used to record impedance and phase angle at the fundamental and third overtone of 3 pixels of the micromachined QCM array. Full adsorption isotherms of each protein of Table 1 were measured from which adsorbent capacities reported in Table 2 were extracted.
2.4 Computational Methods
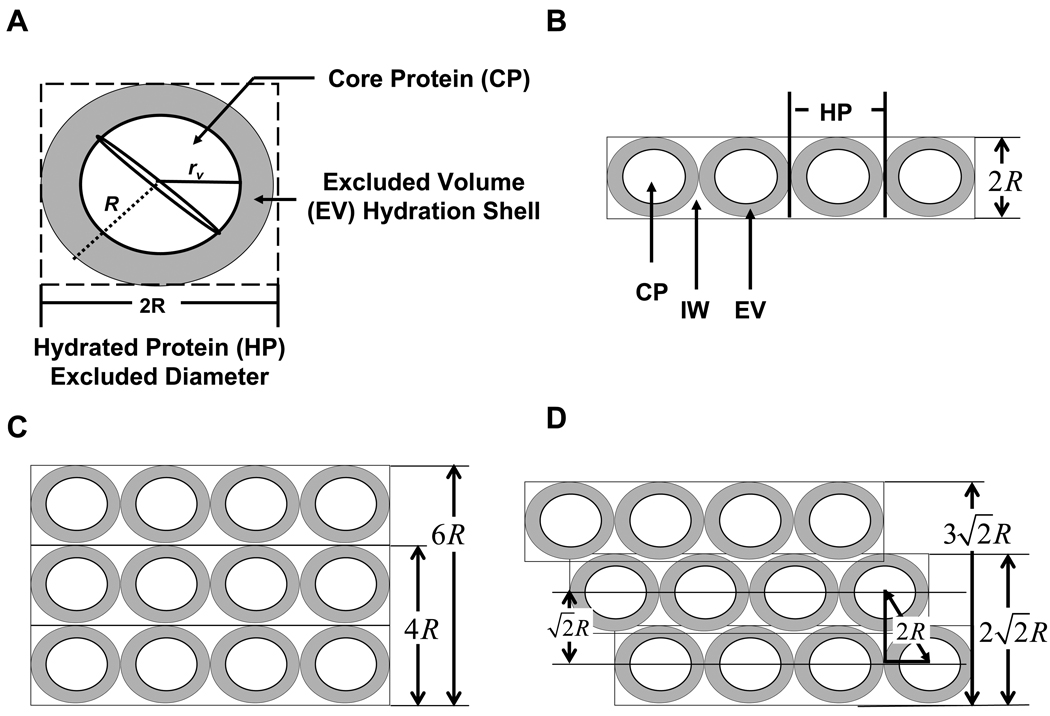
Theoretical adsorbent capacities were based on square or hexagonal (cubic and face-centered-cubic, FCC) packing of hydrated protein spheroids onto a planar surface. Globular blood proteins were approximated as spheroids in solution with core-protein radius following rv = 6.72×10⁻⁸ MW1/3(packing-volume radius in cm for molecular weight MW expressed in kDa; see refs. [16–21] for basic information regarding spherical dimensions of blood proteins). Proteins were assumed to be surrounded by excluded volume such that the net protein radius R = 1.3rv was roughly equal to the radius of gyration [2, 22], leading to the core-shell construct diagramed in Fig. 1A that served as a first-order approximation of protein packing dimensions. It was further assumed that proteins retained the core-shell spheroidal shape in the adsorbed state and assembled into an interphase layer as diagrammed in Fig. 1B, which could potentially stack into two-or-more layers in either a cubic (Fig. 1C) or FCC-like (Fig. 1D) arrangement. Four interphase components were identified by inspection of Fig. 1B: core protein (CP), hydrated protein (HP) that included an excluded volume (EV) shell, and interphase water (IW). The extent to which EV can be realistically differentiated from IW was not determined in this work. It was assumed that EV contained counter charges for the ionizable groups on the protein surface, creating an osmolaric barrier to merging hydration shells under ambient conditions.
Figure 1.
Assembly of hydrated proteins into hypothetical cubic or face-centered-cubic (FCC) arrays. Panel A diagrams a hydrated spherical protein (HP) with a polyaminoacid core following rv = 6.72×10⁻⁸ MW1/3 in cm for MW in kDa. The hydration shell forms an excluded volume (EV) that resists overlap with adjacent proteins leading to a net radius R = 1.3rv. Panel B illustrates assembly of core-shell proteins in a layer. Panels C and D compare dimensions of 3 such layers stacked in either cubic or FCC packing motifs, respectively.
The volume and mass fractions of each component depended on how protein packed within the interphase. Square (cubic, Fig. 1C) and hexagonal (FCC, Fig. 1D) were accounted for in the two constituent inventories summarized in Table 3 and 4, respectively. Entries of Tables 3 were based on known sphere-packing principles [23] for square (cubic) packing that results in an HP volume fraction . The remainder of the interphase was therefore occupied by IW at . Inspection of Fig. 1A revealed that a single HP molecule occupied a cubic volume of whereas CP alone occupied . It was therefore concluded that and that . Entries of Tables 4 were based on known hexagonal (FCC) sphere-packing principles [23] that demand , leaving . Inspection of Fig. 1A revealed that the ratio of CP and HP volumes was . It was concluded, therefore, that . This 46% packing efficiency compared to the 45% packing efficiency deduced from NR described in ref. [2]. It followed that the volume fraction attributable to EV surrounding the protein was . Table 5 was compiled from Tables 3 and 4 to calculate CP mass and total interphase mass comprised of both CP and water in the IW and EV regions. These mass contributions were expressed in terms of hydrated molecular radius R which allowed easy calculation for any protein of known MW using R = 1.3rv = 1.3(6.72×10⁻⁸ MW1/3). Interphase thickness depended on number of occupied layers and thickness of the layer assembly was deduced by geometrical inspection of Figs. 1B–D.
Table 3.
Interphase Constituent Inventory for Cubic Interphase Packing
| Constituent | Volume Occupied | Moles in Interphase (moles) |
Mass in Interphase (grams) |
|||
|---|---|---|---|---|---|---|
| Core Protein (CP) | ||||||
| Interphase Water (IW) | ||||||
| Excluded Volume (EV) |
Notes: Φmax = volume fraction at surface saturation producing the largest interphase volume . ρ = density of water (w) or protein (p). MW = molecular weight of water (w) or protein (p). ρp = 1.3 g/cm3 corresponds to a perfectly spherical protein with core radius rv = 6.72×10⁻⁸ MW1/3 (see Appendix A, ref. [7]). ρW assumed to be 1 g/cm3.
Table 4.
Interphase Constituent Inventory for FCC Interphase Packing
| Constituent | Volume Occupied | Moles in Interphase (moles) |
Mass in Interphase (grams) |
|||
|---|---|---|---|---|---|---|
| Core Protein (CP) | ||||||
| Interphase Water (IW) | ||||||
| Excluded Volume (EV) |
Notes: Φmax = volume fraction at surface saturation producing the largest interphase volume . ρ = density of water (w) or protein (p). MW = molecular weight of water (w) or protein (p). ρp = 1.3 g/cm3 corresponds to a perfectly spherical protein with core radius rv = 6.72×10⁻⁸ MW1/3 (see Appendix A, ref. [7]). ρW assumed to be 1 g/cm3.
Table 5.
Interphase Mass Inventory for Cubic and FCC Interphase Packing
| Cubic Interphase Packing (in grams) | FCC Interphase Packing (in grams) | |||||||
|---|---|---|---|---|---|---|---|---|
| Layers | Mass Core/Area 0.24 ρP = 0.31 |
Total Mass/Area (0.24 ρP + 0.48 ρw + 0.28ρw) = 1.07 |
Mass Core/Area 0.33ρP = 0.43 |
Total Mass/Area (0.33ρP + 0.26ρw + 0.41ρw) = 1.10 |
||||
| 1 | 2R | 0.62R | 2.14R | 2R | 0.86R | 2.20R | ||
| 2 | 4R | 1.24R | 4.28R | 1.22R | 2.83R | |||
| 3 | 6R | 1.86R | 6.42R | 1.82R | 4.67R | |||
| 4 | 8R | 2.48R | 8.56R | 2.43R | 6.22R | |||
Notes: Hydrated protein radius given by R = 1.3rv where rv = 6.72×10⁻⁸ MW1/3 in cm for MW in kDa. ρ = density of water (w) or protein (p). MW = molecular weight of water (w) or protein (p). ρp = 1.3 g/cm3 corresponds to a perfectly spherical protein with core radius rv = 6.72×10⁻⁸ MW1/3 (see Appendix A, ref. [7]). ρW assumed to be 1 g/cm3.
It was assumed that the solution-depletion method measured only CP and was insensitive to mass due to IW and EV because the depletion method, as implemented with either spectroscopy or electrophoresis [7], was calibrated against purified-protein standards of known mass that did not include water of hydration. By contrast, it was assumed that QCM was sensitive to the CP, IW, and EV ensemble because QCM measures the viscoelastic response of the entire interphase, including hydrodynamically coupled water [24–26]. Theoretical adsorbent capacities were compared to solution depletion or QCM measurements by plotting solution depletion against theory for various assumptions of the number of protein layers comprising the interphase, and noting which packing model best correlated with experiment.
3.0 Results
3.1 Adsorbent Capacity by Solution Depletion
The solution-depletion method of measuring protein adsorption was accepted as the ‘gold standard’ against which QCM results were compared. The rational behind this decision lies in the fact that solution depletion is an unambiguous mass-balance method that does not rely on complex interpretive theory or instrumentation and uses no protein or adsorbent processing steps (such as labeling or rinsing, respectively) preceding adsorbed-mass measurement. Solution concentration was simply determined before-and-after exposure to adsorbent particles with no separation of adsorbent from solution. Concentration measurements were made using either electrophoresis or UV-Vis spectroscopy calibrated against purified protein solutions of known concentration, typically prepared by gravimetry and volumetric dilution (Table 1). The amount of protein adsorbed was calculated as the depletion is the w/v concentration (mg/mL) of the ith protein before exposure to adsorbent and WBi is the w/v concentration after exposure to adsorbent. The absolute mass of adsorbed protein is given by mi = DiVB, where VB is the volume of the solution phase and corresponds to “core protein” only, as defined in Section 2.4. The primary experimental obstacle with solution depletion is statistical in nature because the amount adsorbed is determined by difference between two numbers, concentration before and after adsorption, both typically larger than the difference Di. This problem was overcome in this work by working with sufficient adsorbent surface area to obtain a clear signal. Hence, the simplicity of the venerable solution-depletion method and freedom from complicated instrumentation renders it a nearly ideal standard of comparison.
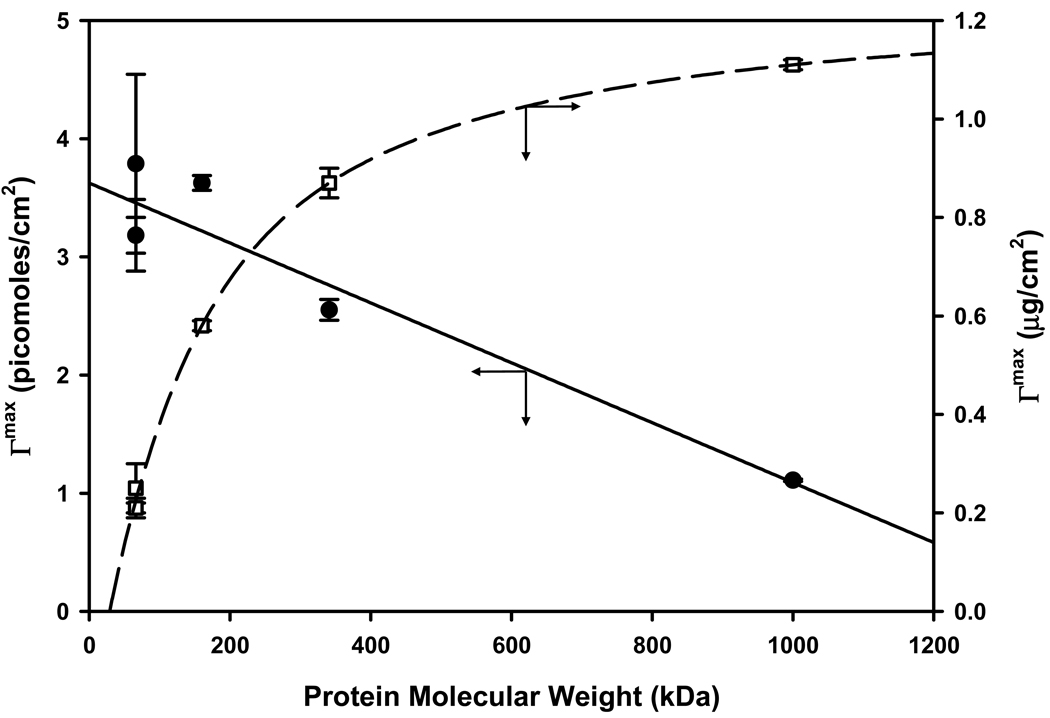
Experimentally-measured adsorbent capacities are plotted in Fig. 2 (molar and mass scaling on left and right ordinates, respectively) for proteins of Table 1 adsorbing to hydrophobic glass particles (see Section 2; data taken from ref. [7] corresponding to columns 3–4 of Table 6). It was evident from Fig. 2 that molar adsorbent capacity decreased in a linear-like trend with protein size (MW), falling four fold as protein size increases from 66 kDa (HSA) to 1000 kDa (IgM). Linear least squares fit to the data revealed that Γmax = (−2.5±0.4)×10−3MW+3.6±0.2; R2=95% in picomoles/cm2 where Γmax is the adsorbent capacity per-unit-area adsorbent. Over the same MW range, weight capacity (right ordinate, Table 2) rose asymptotically following an unknown power law (line through the data of Fig. 2 is a guide to the eye).
Figure 2.
Adsorbent capacity of hydrophobized glass particles measured by the solution-depletion method. Closed circles correspond to molar capacity (left ordinate) following a linear trend with protein molecular weight. Open squares correspond to weight capacity (right ordinate) following an unknown power law (line through the data is a guide to the eye). Proteins used in measurements are listed in Table 1.
3.2 Theoretical Adsorbent Capacity Compared to Solution-Depletion Experiment
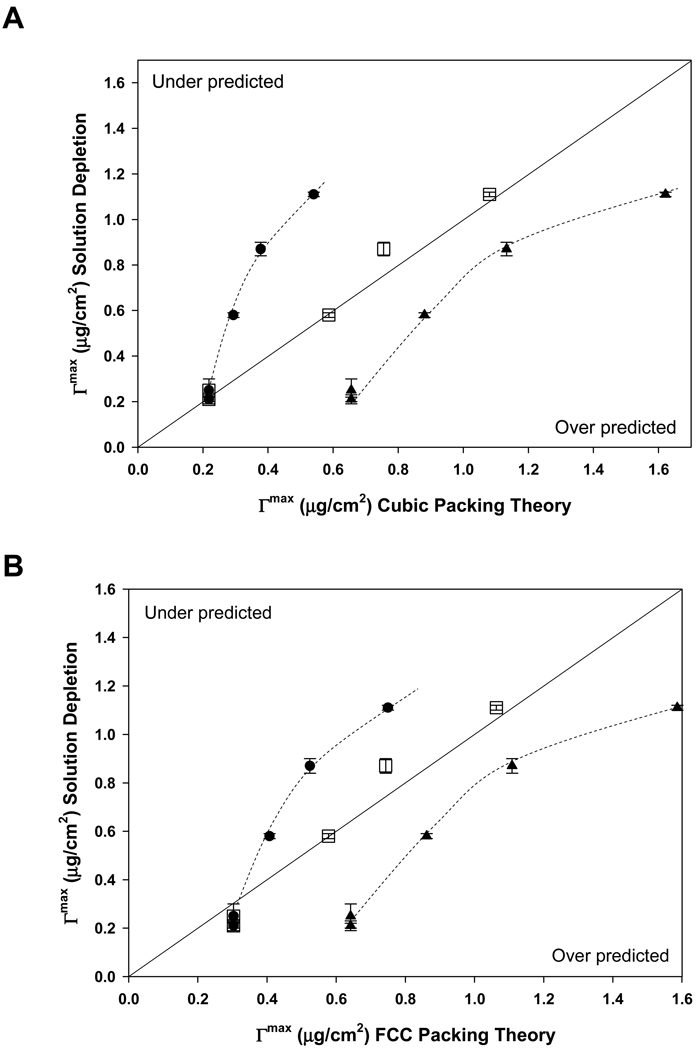
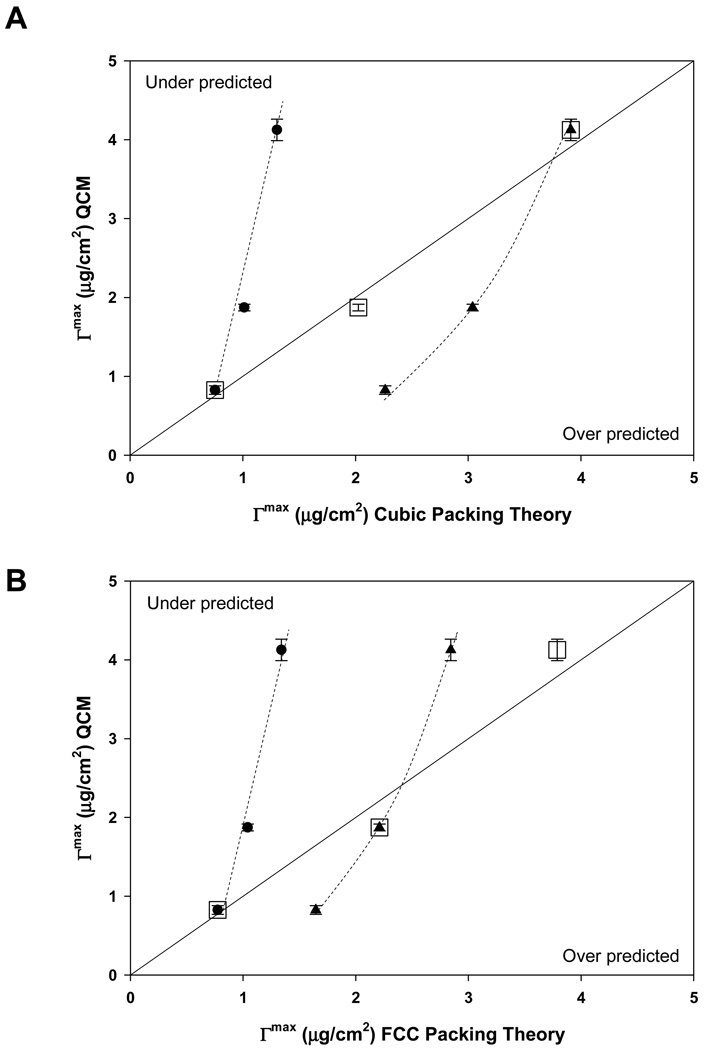
The solution-depletion method measured only adsorbed mass of core protein (CP) and was insensitive to mass contributions due to putative interphase water components IW and EV (see Fig. 1). Therefore, theoretical accounting for mass measured by depletion was based on columns 3 and 6 of Table 5 corresponding to square or hexagonal (cubic and FCC) packing of hydrated spheroidal proteins forming one-to-four layers in the adsorbed state. Theoretical results were compared to experimentally measured capacity by co-plotting data in such a way that perfect correlation between theory and experiment fell on the 45° bisecting line, as shown in Fig. 3. Square or hexagonal (cubic and FCC) models gave essentially the same result. A one layer model under predicted experiment (closed circle data lying above the perfect correlation line) whereas a three-layer model over predicted experiment (closed triangle data lying below the perfect correlation line). Judicious combination of one layer for HSA and two layers for IgG, Fib, and IgM was found to closely match experiment (open square data falling near the perfect correlation line).
Figure 3.
Adsorbent capacity of hydrophobized glass particles measured by the solution-depletion method (ordinate) compared to theoretical capacity (abscissa), corresponding to cubic packing (Panel A) of hydrated proteins (see Fig. 1) or face-centered-cubic packing (FCC, Panel B). The 45° bisecting line represents perfect correlation of experiment and theory, with under prediction falling in the upper quadrant and over prediction falling in the lower quadrant (see annotations). Assumption of one adsorbed layer under predicted measurement for proteins larger than HSA (filled circles) whereas a three-layer model over predicted measurement for all proteins. Judicious combination of layer models, one layer for HSA and two layers for IgG, Fib, and IgM, predicts adsorbent capacity nearly exactly (open squares). Dotted lines through experimental data are guides to the eye. Outcomes for cubic packing (Panel A) were very similar to that of FCC packing (Panel B). Error bars represent experimental uncertainty in solution-depletion measurements.
3.3 Adsorbent Capacity by Quartz Crystal Microbalance (QCM)
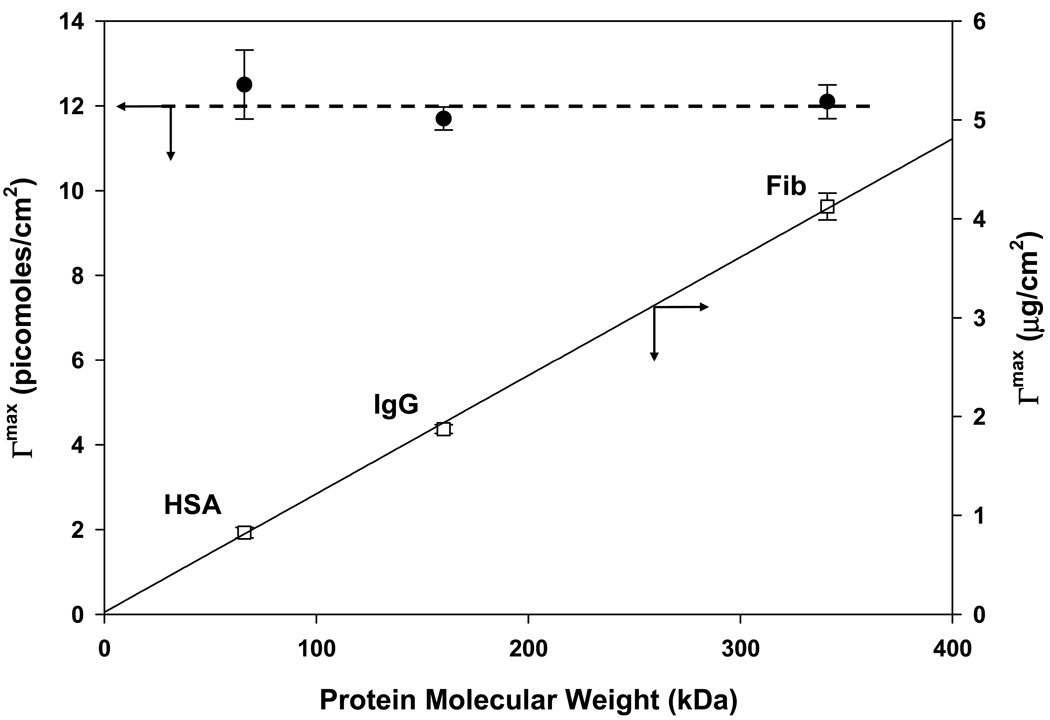
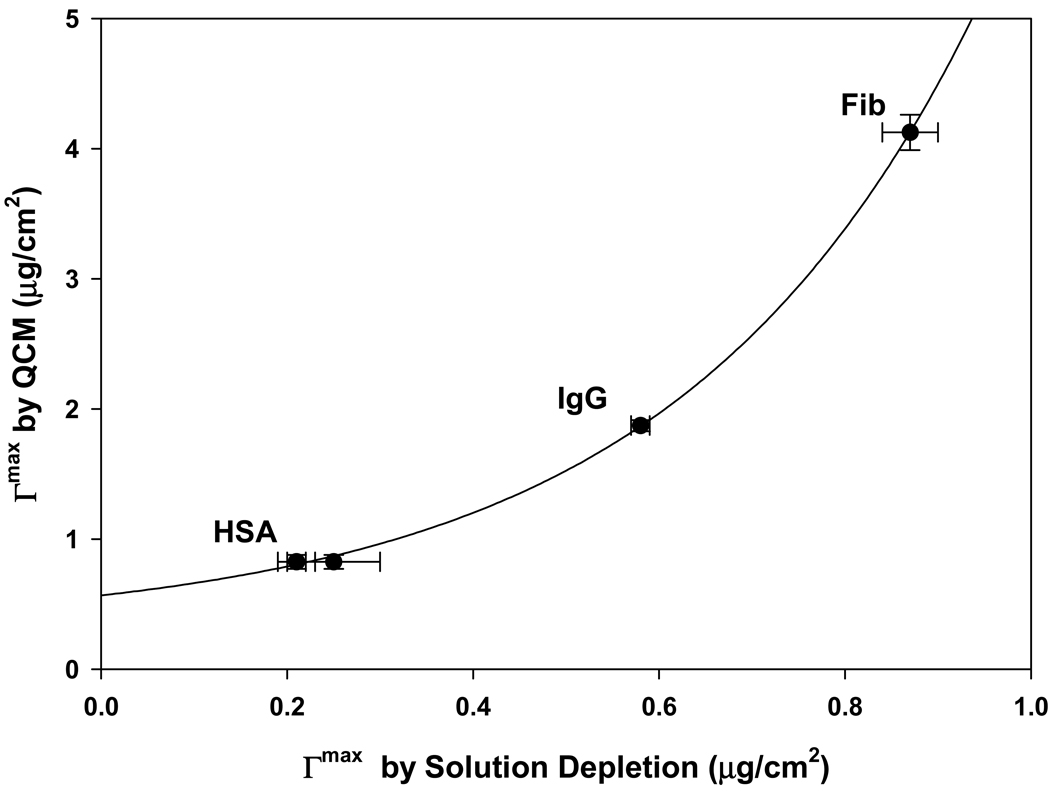
Fig. 4 plots QCM adsorbent capacities (molar and mass scaling on left and right ordinates, respectively) for HSA, IgG, and Fib (Table 1) adsorbing to hydrophobic methyl-terminated, gold-coated QCM electrode surfaces. It was found that measurements for IgM were unreliable due to significant energy dissipation related to the fact that adsorbed IgM layers exceeded the penetration depth of the acoustic wave used in the QCM method (see further Section 4). Molar capacity for HSA, IgG, and Fib was effectively invariant over the protein MW range explored (Fig. 4), leading to a linear increase in weight capacity as a function of MW (compare to Fig. 2). It was concluded that QCM measurements were completely different than the solution depletion standard of comparison. Differences between QCM and solution depletion were found to increase in an exponential-like way with adsorbed mass (Fig. 5).
Figure 4.
Adsorbent capacity of a hydrophobized sensor surface measured by the quartz-crystal microbalance (QCM) method. Closed circles correspond to molar capacity (left ordinate) following a flat trend with protein molecular weight. Open squares correspond to weight capacity (right ordinate) following a linear trend with protein molecular weigh. Proteins used in measurements are listed in Table 1. Notice that QCM results are completely different than that of the solution-depletion method (see Fig. 2). Error bars represent experimental uncertainty QCM measurements.
Figure 5.
Comparison of adsorption capacity measured by QCM (ordinate) and solution-depletion (abscissa) methods for HSA, IgG, and Fib (see Table 1 for protein identity). Notice that the difference between methods increases in an exponential-like way as adsorbent capacity increases. Error bars represent experimental uncertainty in measurements.
3.4 Theoretical Adsorbent Capacity Compared to QCM Experiment
The QCM method measured adsorbed mass of all constituents of the interphase, including core protein (CP) and interphase water IW and EV (see Fig. 1) [24–26]. Therefore, theoretical accounting for mass measured by QCM was based on columns 4 and 7 of Table 5 corresponding to square or hexagonal (cubic and FCC) packing of spheroidal proteins into one-to-four layers in the adsorbed state. Theoretical results were compared to experimentally measured QCM capacity by co-plotting data in such a way that perfect correlation between theory and experiment fell on the 45° bisecting line, as shown in Fig. 6. Square or hexagonal (cubic and FCC) models gave qualitatively similar but quantitatively different results (compare to Fig. 3). A one layer model under predicted experiment (closed circle data lying above the perfect correlation line) whereas a three-layer model both over-and-under predicted experiment (closed triangle data lying below the perfect correlation line). Judicious combination of one layer for HSA with two layers of IgG and three layers of Fib was found to closely match experiment (open square data falling near the perfect correlation line) for the square (cubic) packing scenario. By contrast, the hexagonal (FCC) packing scenario required a combination of one layer for HSA with three layers of IgG and four layers of Fib to match experiment.
Figure 6.
Adsorbent capacity of a hydrophobized sensor surface measured by the quartz-crystal microbalance method (QCM, ordinate) compared to theoretical capacity (abscissa), corresponding to cubic packing (Panel A) of hydrated proteins (see Fig. 1) or face-centered-cubic packing (FCC, Panel B). The 45° bisecting line represents perfect correlation of experiment and theory, with under prediction falling in the upper quadrant and over prediction falling in the lower quadrant (see annotations). Assumption of one adsorbed layer under predicted measurement for proteins larger than HSA (filled circles) whereas a three-layer model over predicted measurement for all proteins (with the exception of IgG in the FCC packing model). For cubic packing (Panel A), judicious combination of layer models, one layer for HSA and two layers for IgG, and three of Fib predicts adsorbent capacity nearly exactly (open squares). The FCC packing case (Panel B) required one layer for HSA, three layers for IgG, and four Fib layers to accommodate experimental data. Dotted lines through experimental data are guides to the eye. In contrast to modeling of solution-depletion measurements (Fig. 3), outcomes for cubic packing (Panel A) were quite different from that of FCC packing (Panel B). Error bars represent experimental uncertainty in QCM measurements.
4.0 Discussion
4.1 Comparing Solution Depletion and Quartz Crystal Microbalance (QCM) Methods
The experimental factors discussed in Section 3.1 recommend the solution-depletion method as a benchmark against which all other methods of measuring protein adsorption can be compared. Herein we compare the adsorbent capacity of model hydrophobic surfaces measured by solution-depletion and QCM methods. Silanized glass particles with a fluoromethacrylate coating were used in the solution-depletion method and a methyl-terminated thiol coating on a gold microelectrode was used in QCM. Although fluoromethacrylate surface chemistry is clearly different than that of methyl-terminated thiol, both exhibit similar hydrophobicity characterized by an advancing contact angle reliably falling between 110°–115°. Careful previous studies have revealed that protein adsorption is a function of water wettability with little-or-no observable relationship to hydrophobic surface chemistry that interacts with water and protein only through dispersion forces [11–13]. This observation justified comparison of the adsorbent capacity of hydrophobic particles measured by solution depletion to the adsorbent capacity of a planar hydrophobic QCM sensor.
4.2 Adsorbent Capacity by Solution Depletion
It is evident from Fig. 2 that molar adsorbent capacity decreases in a linear-like trend with protein size (MW), falling four fold as protein size rises from 66 kDa (HSA) to 1000 kDa (IgM). Over the same MW range, weight capacity (right ordinate) rises asymptotically following an unknown power law (line through the data of Fig. 2 is a guide to the eye). It is of interest to inquire into the functional relationships between adsorbent capacity and protein MW because this information provides insights into the 3D arrangement of protein molecules in the adsorbed state.
Three possible relationships jump immediately to mind for consideration: (i) adsorbent capacity has no relationship to protein size, (ii) capacity is a fixed molar concentration for all of the proteins studied, or (iii) capacity is a fixed mass concentration for all of the proteins studied. The first of these options can be eliminated out-of-hand in light of the smooth trends evident in Fig. 2. The second can be tested by comparing two hypothetical proteins i and j. If these two proteins are at equal molar interphase concentration at surface saturation of a fixed adsorbent surface area, then the maximum number of moles of i ni dissolved in the interphase volume VIi must equal number of maximum moles of j nj dissolved in the interphase volume VIj. Eq. (1) expresses this relationship for option (ii), which predicts that the interphase volume ratio is a function of adsorbed mass and protein MW:
| (1) |
where mi and mj are the maximum masses of adsorbed proteins i and j. Given that 4.4X more mass of IgM adsorbs per unit adsorbent surface area than HSA (Table 2, 1.1±0.1 picograms/cm2 IgM compared to 0.25±0.05 picograms/cm2 HSA), it is evident that . This absurdly requires that a 2.5X bigger protein (IgM, R = 17.4 nm, Table 1) occupies 1/3 the interphase volume occupied by HSA (R = 7.1nm, Table 1). Thus it is apparent that the second option can be eliminated from further consideration. The third and remaining option requires that the maximum adsorbent capacity of protein i occupying an interphase thickness must equal number of adsorbent capacity of protein j occupying an interphase thickness . Eq. (2) expresses this relationship for option (iii), which leads to the conclusion that the interphase thickness ratio is equal to the ratio of adsorbed masses:
| (2) |
In other words, option (iii) insists that interphase thickness scales directly with experimentally-accessible adsorbent capacity. It must be concluded, therefore, that adsorbed IgM is 1.1/0.25 = 4.4X thicker than HSA. Given that the radius (or diameter) of a hydrated IgM molecule is 2.5X larger than a hydrated albumin molecule (Table 1), it is conceivable that IgM occupies approximately two molecular layers stacked one upon the other, yielding a total interphase thickness approximately 5X greater than HSA. In three dimensions, this amounts to cubic packing of hydrated spherical molecules (Fig. 1C two layers). Two layer FCC packing would yield 29% thinner interphase (4R compared to compare Figs. 1 B and C), possibly accounting for some of the difference between a 5X and 4.4X thicker IgM interphase than HSA. Similar logic applied to IgG and Fib likewise suggests the interphase thickness ratio calculated from Eq. (2) can be conceivably explained by two cubic or FCC-packed molecular layers. A more detailed analysis of packing models is required to fully account for observed thickness ratios as discussed in the following subsections.
4.3 Theoretical Solution-Depletion Adsorbent Capacity
Packing arrangements contemplated above can be tested by assembling an inventory of volume and mass fractions based on Fig. 1 (see Section 3) and calculating the mass contribution of each for comparison to experiment. Table 5 is particularly useful in this regard because it compiles Tables 3 and 4 in a way that permits easy calculation of mass contributions of CP or the total mass comprised of CP, IW, and EV from the hydrated protein radius given by R = 1.3rv, where rv = 6.72×10⁻⁸ MW1/3 in cm for MW in kDa. Since solution depletion directly measures the mass of core protein and not contributions due to interphase water, it is appropriate to compare theoretical CP (columns mass 3 and 6 of Table 5) to experiment. Fig. 3 shows the results of this comparison for square or cubic (Fig. 3A) and hexagonal or FCC packing (Fig. 3B). Neither one, two, or three layer models adequately correlate with experiment; either under or over predicting data (closed circles and triangles; 45° bisecting line represents perfect correlation). However, it is found that a judicious combination of layer models, one layer for HSA and two layers for IgG, Fib, and IgM, accommodates measured adsorbent capacity nearly exactly (open squares). Agreement between experiment and theory is quite impressive given the simplicity of the spherical core-shell conception of protein (Fig. 1A) and the rigid order imposed by square or hexagonal (cubic or FCC) packing models.
We thus conclude that purified blood proteins adsorb from surface-saturating solution concentrations to a hydrophobic adsorbent in one or two layers, depending on molecular size (MW), and that these layers approximate a close-packed array described by either square or hexagonal (cubic and FCC) packing. Although calculations do not reliably distinguish between square or hexagonal (cubic and FCC) packing, we note that the thinner FCC interphase would be energetically more favorable since energy is required to expand an interphase. Consequently, hexagonal (FCC) packing is considered in more detail below.
4.4 An FCC Packing Model of Solution-Depletion Adsorbent Capacity
Hexagonal (FCC) packing of spheres is the most concentrated aggregation that is physically possible, achieving 74% density (the so-called green-grocer limit) [23]. An FCC unit cell contains a total of 4 spheres (eight 1/8 spheres and six ½ spheres) in a cubic volume , where r is the sphere radius [2, 23]. Consequently, the unit cell concentration is the maximum feasible interphase concentration of adsorbed spherical proteins given by:
| (3) |
in units of picomoles/L and where the protein radius rv = 6.72×10⁻⁸ MW1/3 has been used (see Section 1). The parameter ε is a packing efficiency that dictates how closely core protein molecules pack within a hypothetical FFC cell. Packing efficiency ε is controlled by size of EV illustrated in Fig. 1. A core-shell arrangement with R = 1.3rv corresponds to ε = 0.45 (see further ref. [2]). Using the facts that [2] and (Fig. 2 and Section 3.1), solution for shows that the FCC packing model predicts that interphase thickness will follow a parabolic relationship in MW such that:
| (4) |
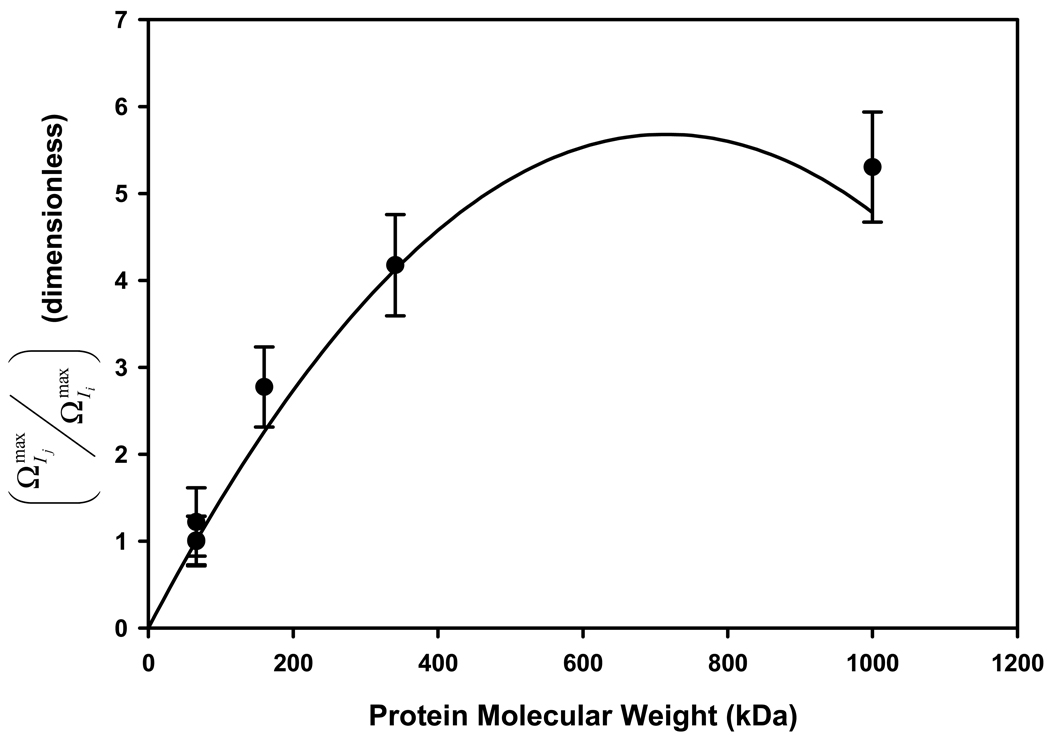
A parabolic relationship over a full range of MW is not possible because it projects that both rises and falls with MW, violating the physical constraint that can only increase with MW (bigger proteins occupy more space). However, it is evident that the parabolic relationship is an artifact of assuming that is linear over a full range of MW, which itself is not possible because it projects that as MW → 1431kDA (calculated from the above experimental relationship with MW). It is much more likely that falls asymptotically to a lower asymptote at higher MW and the linear trend observed in Fig. 1 is apparent only because a limited MW range was examined. Nevertheless, in spite of these limitations, Eq. (4) can be used to interpolate within the data set at hand and used to compute both absolute and relative interphase thickness, assuming FCC packing as a test case. Eq. (5) uses eq. (4) to calculate theoretical values which can then be compared directly to solution-depletion measurements as a test of how well the hexagonal (FCC) model accounts for the distribution of mass within the interphase volume. For the specific case when the reference protein i is taken to be HSA:
| (5) |
Fig. 7 shows the result of this comparison. It is evident that the hexagonal (FCC) model accommodates the data trend, with the exception of the unrealistic parabolic relationship mentioned above. It is to be emphasized that Fig. 7 is not a completely independent test of agreement between theory and experiment because experimental data has been used in theoretical calculations itself. However, choice of the packing model is completely independent of experimental data. If a totally unrealistic packing model was chosen, then theory would deviate significantly from data, even if experimental data was used in theoretical calculations. Thus, we take this agreement between hexagonal (FCC) packing model predictions and experiment as additional evidence that HSA, IgG Fib, and IgM adsorb from surface-saturating solution concentrations to hydrophobic adsorbents in a manner that approximates a well-ordered array, similar to the inference drawn from neutron reflectometry of HSA at the hydrophobic solution-air interface discussed in Section 1.
Figure 7.
Thickness of different proteins adsorbed to hydrophobized glass particles deduced from adsorbent capacity measurements by the solution-depletion method (ordinate) as a function of protein molecular weight (see Table 1 for protein identity). Notice that thickness of adsorbed IgM (1000 kDa) is nearly 5X greater than HSA (66 kDa) at surface saturation. An approximate relationship based on face-centered-cubic packing of adsorbed protein correlates with experimental data (line). Error bars represent experimental uncertainty in solution-depletion measurements propagated into calculated thickness ratio.
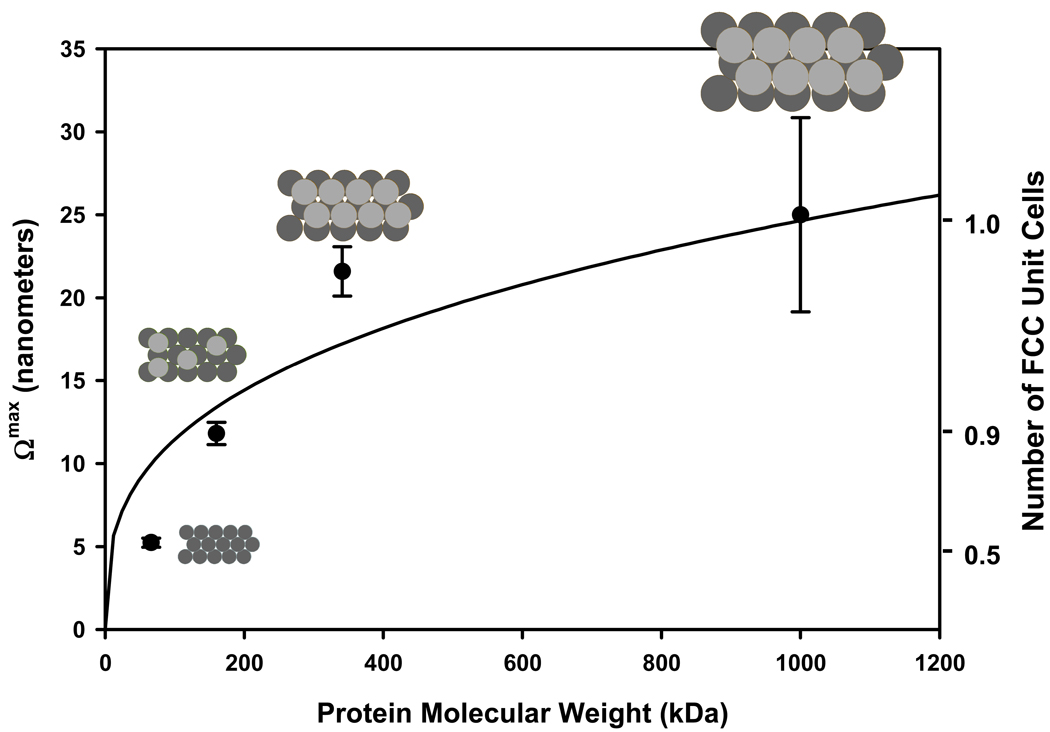
Pursuing these arguments a bit further, Eq. (4) can be used to convert experimental to absolute values, as shown in Fig. 8. The smooth curve running through the data corresponds to the thickness anticipated based on the lattice parameter with R = 1.3rv. The right-hand ordinate of Fig. 8 divides computed thickness by (Fig. 1C) to convert into the number of hypothetical FCC unit cells that adsorbed protein occupies. According to the FCC packing model, it is apparent that HSA assembles in an array corresponding to approximately ½ of a layer (as in single hexagonally packed layer). IgG requires an additional but incompletely filled second layer, with Fib and IgM forming a complete 2 layer unit; in basic agreement with the analysis of the preceding section and as illustrated in Fig. 8 insets. It is to be stressed again that visual agreement between data and the theory line does not constitute independent confirmation that proteins adsorb according to the hexagonal (FCC) packing model because calculations use experimental data to obtain values. Nevertheless, Fig. 8 provides an additional level of interpretation of experimental capacity measurements and provides an estimate of interphase thickness that can be compared to that measured by QCM, as discussed further below.
Figure 8.
Absolute interphase thickness of different proteins adsorbed to hydrophobized glass particles inferred from adsorbent capacity measurements by the solution-depletion method (ordinate) as a function of protein molecular weight (left ordinate, see Table 1 for protein identity). Right ordinate converts interphase thickness into number of hypothetical FCC unit cells occupied by protein as suggested by the inset diagrams. HSA (66 kDa) occupies a single, hexagonally packed layer whereas larger proteins occupy two, partially or completely filled layers comprising a single FCC unit cell. Error bars represent experimental uncertainty in solution-depletion measurements propagated into calculated thickness.
4.5 The QCM Method of Measuring Protein Adsorption
QCM techniques have emerged as highly sensitive methods for detecting adsorption and adhesion to solid surfaces [27–31]. Extensions of the basic technique have enabled direct measurements in liquid environments [32]; which in turn has allowed measurement of the adsorption of biological entities such as proteins, adhesion of lipid vesicles and cells of biological interest [26, 33–40], as well as characterization of the viscoelastic properties of adsorbate at the solid-solution interface [41–45]. These viscoelastic properties critically depend not only on the adsorbate mass itself but also “trapped”[24] or “intra-layer”[25] or “hydrodynamically coupled” [26] interphase water. Evidently then, QCM measurement of adsorbed protein includes contributions from both core protein and interphase water, whereas solution depletion measures only contribution from core protein. The difference between solution depletion and QCM can be large for large solutes such as proteins because, according to the inventory of Tables 3–5 and Fig. 1, interphase water is a significant contributor to a proteinaceous interphase.
4.6 Adsorbent Capacity by QCM
It is evident from Fig. 4 that molar adsorbent capacity (left ordinate) was a flat function of protein MW for HSA, IgG, and Fib (IgM could not be measured). Over the same MW range, weight capacity (right ordinate) followed a decidedly linear trend Γmax = (1.20±0.2)×10−3 MW + (0.02±0.03); R2 = 99.9%. This relationship is to be compared to that of Fig. 2 measured by solution depletion. Fig. 5 compares QCM mass capacity to that measured by solution depletion from which is it evident that QCM detects considerably more mass than solution depletion and that differences between QCM and depletion increase exponentially with increasing adsorbed mass. These differences between QCM and solution depletion can be understood from a consideration of the number of adsorbed layers and the distribution of mass within these layers.
4.7 Theoretical QCM Adsorbent Capacity
The inventory of volume and mass fractions based on Fig. 1 appropriate to QCM includes core protein and interphase water contributions IW, and EV. Columns 4 and 7 of Table 5 give the total mass for square and hexagonal (cubic and FCC packing), respectively, from which theoretical mass can be calculated for different numbers of adsorbed layers. Fig. 6 summarizes results of these calculations in a presentation format similar that of Fig. 3 discussed in Section 4.3. For the square (cubic) packing case of Fig. 6A, neither one, two, or three layer models adequately correlate with experiment; either under predicting or over predicting data (closed circles and triangles; 45° bisecting line represents perfect correlation). However, a judicious combination of layer models, one layer for HSA and two layers for IgG, and three of Fib predicts adsorbent capacity nearly exactly (open squares). The hexagonal (FCC) packing case of Fig. 6B required one layer for HSA and two layers for IgG, and four Fib layers to accommodate experimental data. Evidently, square or hexagonal (cubic and FCC) models are quite different when the ensemble of protein and interphase water is considered, in sharp contrast to the solution-depletion case for which only core protein was included (Section 4.3). The agreement between experiment and theory is quite impressive given the simplicity of the spherical core-shell conception of protein (Fig. 1A) and the rigid order imposed by square or hexagonal (cubic and FCC) packing models.
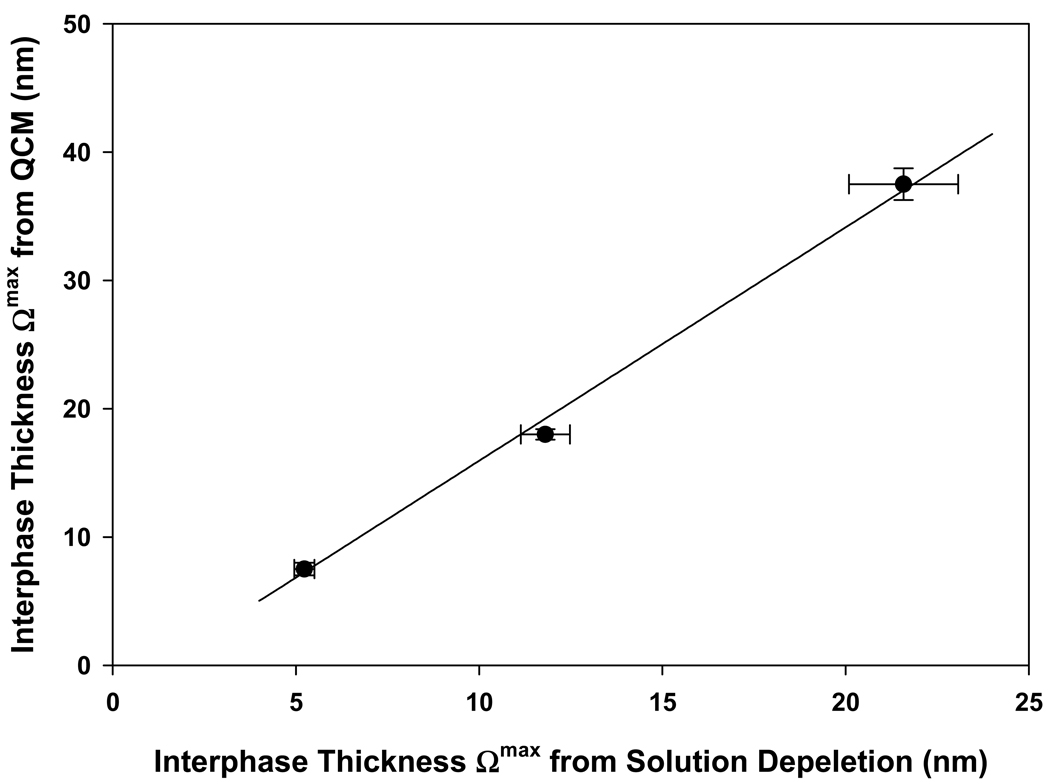
We thus conclude that mass contributions to QCM adsorbent capacity measurements can be accounted for based on the inventory of Table 5. It is evident that solution depletion and QCM provide two different views of protein adsorption. In particular, mass contribution of interphase water is a significant part of the QCM signal. It is also evident that QCM detects one-or-two more layers of adsorbed protein than inferred from solution depletion, depending on choice of square or hexagonal (cubic and FCC) interpretive packing models. In this latter connection, it is of interest to compare the interphase thickness directly measured QCM to the theoretical thickness calculated from solution-depletion measurements (Section 4.4, Fig. 8). As shown in Fig. 9, QCM estimates of interphase thickness are nearly twice that inferred from solution depletion and approach 40 nm thick for Fib (slope of the 3 point line is 1.82±0.06). Four-or-more layers of IgM would thus correspond to >65 nm, nearly twice the estimated penetration depth of the acoustic wave used in the QCM experiment. We conclude this accounts for the failure to accurately measure IgM adsorption. The exact reason for this discrepancy between QCM and solution-depletion interphase thickness estimates is unknown, but we speculate that the static model used to interpret solution depletion does not accurately capture the complexities of the viscoelastic interfacial environment probed by QCM. Possibly, the acoustic-wave field levitates and separates adsorbed proteins, effectively inflating the interphase by more than 80% compared to that inferred from solution-depletion measurements.
Figure 9.
Comparison of interphase thickness measured by QCM to that inferred from adsorbent capacity measurements by the solution-depletion method for HSA, IgG, and Fib. Notice that QCM thicknesses are systematically higher than that deduced from solution depletion, possibly because the acoustic-wave field levitates and separates adsorbed proteins, effectively inflating the interphase by more than 80%. Error bars represent experimental uncertainty in QCM measurements or error in solution-depletion measurements propagated into calculated thickness.
5. Conclusions
The capacity of a hydrophobic adsorbent to adsorb protein from aqueous solution is capped by a maximum mass/volume (e.g. mg/mL) concentration within the interphase that separates the physical surface from bulk solution. This maximum capacity is estimated from neutron reflectometry to be 442 mg/mL for HSA adsorbing to the hydrophobic solution-air interphase. Thickness of the interphase increases with the size (molecular weight) of the adsorbing protein. Likewise, the number of adsorbed molecular layers that are required to achieve the adsorbent capacity increases with protein size. As a consequence of these factors, it is possible to model the distribution of proteins within the interphase using a spheroidal-shape estimate for hydrated proteins and known packing principles for spheres. Modeling suggests that low molecular weight proteins such as serum albumin pack in a hexagonal array whereas larger proteins such as IgG, fibrinogen, and IgM occupy at least two cuboidal or face-centered-cubic packed molecular layers. Thus, proteins adsorbed to hydrophobic surfaces from surface-saturating solution concentration approximate an organized array and are packed as densely as osmolaric repulsion of hydration spheres will permit under ambient pressures. It is not anticipated that adsorption of two dissimilar-sized proteins will exhibit the same level of order in the adsorbed state because the second protein would introduce “defects” in the adsorbed array. The observation that kinetics of adsorption from binary solution are very much more complex than adsorption kinetics from single-protein solution [5, 6] supports this expectation. Quartz crystal microbalance (QCM) measures both mass of adsorbed protein and water with interphase occupied by adsorbed protein. As a consequence, QCM cannot be directly compared to other methods that measure only mass of the adsorbed core protein such as solution depletion; at least not without additional interpretation that accounts for interphase water. The mass contribution of interphase water to the QCM measurement can be accounted for using packing models premising that spheroidal proteins are surrounded by interphase water. The thickness of the interphase and number of layers occupied by adsorbed proteins estimated from QCM measurements exceeds that estimated from solution depletion, presumably because the static model used to interpret solution depletion does not accurately capture the complexities of the viscoelastic interfacial environment probed by QCM.
Acknowledgments
This work was supported, in part, by grants from the National Institute of Health PHS 2R01HL069965, the US Army Research Office (Grant # W911NF-07-1-0327), and the National Science Foundation Grant # ECCS 0925438. Authors gratefully acknowledge the National Science Foundation Center for Nanoscale Science (MRSEC DMR-0080019) at Penn State University and use of the National Science Foundation NNIN facilities at Penn State University under Agreement 0335765. Support from the Materials Research Institute and Departments of Bioengineering, Chemistry, Electrical Engineering, and Materials Science and Engineering at Penn State University is greatly appreciated.
Footnotes
Publisher's Disclaimer: This is a PDF file of an unedited manuscript that has been accepted for publication. As a service to our customers we are providing this early version of the manuscript. The manuscript will undergo copyediting, typesetting, and review of the resulting proof before it is published in its final citable form. Please note that during the production process errors may be discovered which could affect the content, and all legal disclaimers that apply to the journal pertain.
Impact Statement: This work illuminates how proteins adsorbed from concentrated solution assemble within the interfacial region (interphase) of an adsorbent surface, providing insights into the mechanism of protein adsorption.
Citations
- 1.Vogler EA. Structure and reactivity of water at biomaterial surfaces. Adv Colloid and Interface Sci. 1998;74:69–117. doi: 10.1016/s0001-8686(97)00040-7. [DOI] [PubMed] [Google Scholar]
- 2.Krishnan A, Siedlecki C, Vogler EA. Traube-rule interpretation of protein adsorption to the liquid-vapor interface. Langmuir. 2003;19:10342–10352. [Google Scholar]
- 3.Noh H, Vogler EA. Volumetric interpretation of protein adsorption: partition coefficients, interphase volumes, and free energies of adsorption to hydrophobic surfaces. Biomaterials. 2006;27:5780–5793. doi: 10.1016/j.biomaterials.2006.07.038. [DOI] [PubMed] [Google Scholar]
- 4.Lu JR, Su TJ, Penfold J. Adsorption of serum albumins at the air/water interface. Langmuir. 1999;15:6975–6983. [Google Scholar]
- 5.Barnthip N, Noh H, Leibner E, Vogler EA. Volumetric interpretation of protein adsorption: kinetic consequences of a slowly-concentrating interphase. Biomaterials. 2008;29:3062–3074. doi: 10.1016/j.biomaterials.2008.03.043. [DOI] [PMC free article] [PubMed] [Google Scholar]
- 6.Barnthip N, Parhi P, Golas A, Vogler EA. Volumetric interpretation of protein adsorption: kinetics of protein-adsorption competition from binary solution. Biomaterials. 2009;30:6495–6513. doi: 10.1016/j.biomaterials.2009.08.016. [DOI] [PMC free article] [PubMed] [Google Scholar]
- 7.Parhi P, Golas A, Barnthip N, Vogler EA. Volumetric interpretation of protein adsorption: capacity scaling with adsorbate molecular weight and adsorbent surface energy. Biomaterials. 2009;30:6814–6824. doi: 10.1016/j.biomaterials.2009.09.005. [DOI] [PMC free article] [PubMed] [Google Scholar]
- 8.Noh H, Vogler EA. Volumetric interpretation of protein adsorption: mass and energy balance for albumin adsorption to particulate adsorbents with incrementally-increasing hydrophilicity. Biomaterials. 2006;27:5801–5812. doi: 10.1016/j.biomaterials.2006.08.005. [DOI] [PubMed] [Google Scholar]
- 9.Noh H, Vogler EA. Volumetric interpretation of protein adsorption: competition from mixtures and the Vroman effect. Biomaterials. 2007;28:405–422. doi: 10.1016/j.biomaterials.2006.09.006. [DOI] [PMC free article] [PubMed] [Google Scholar]
- 10.Noh H, Vogler EA. Volumetric interpretation of protein adsorption: ion-exchange adsorbent capacity, protein pI, and interaction energetics. Biomaterials. 2008;29:2033–2048. doi: 10.1016/j.biomaterials.2008.01.017. [DOI] [PMC free article] [PubMed] [Google Scholar]
- 11.Krishnan A, Liu Y-H, Cha P, Allara DL, Vogler EA. Interfacial energetics of globular-blood protein adsorption to a hydrophobic surface from aqueous-buffer solution. J Royal Soc Interface. 2006;3:283–301. doi: 10.1098/rsif.2005.0087. [DOI] [PMC free article] [PubMed] [Google Scholar]
- 12.Ariola F, Krishnan A, Vogler EA. Interfacial rheology of blood proteins adsorbed to the aqueous-buffer/air interface. Biomaterials. 2006;27:3404–3412. doi: 10.1016/j.biomaterials.2006.02.005. [DOI] [PubMed] [Google Scholar]
- 13.Cha P, Krishnan A, Fiore VF, Vogler EA. Interfacial energetics of protein adsorption from aqueous buffer to surfaces with varying hydrophilicity. Langmuir. 2008;24:2553–2563. doi: 10.1021/la703310k. [DOI] [PubMed] [Google Scholar]
- 14.Kao P, Patwardhan A, Allara D, Tadigadapa S. Human serum albumin adsorption study on 62-mhz miniaturized quartz gravimetric sensors. Anal Chem. 2008;80:5930–5936. doi: 10.1021/ac8005395. [DOI] [PubMed] [Google Scholar]
- 15.Kao P, Allara DL, Tadigadapa S. Fabrication and performance characteristics of high-frequency micromachined bulk acoustic wave quartz resonator arrays. IET Sci. Meas Technol. 2009;20:124007–124015. [Google Scholar]
- 16.Richards FM. Areas, volumes, packing and protein structure. Ann Rev Biophys Bioeng. 1977;6:151–176. doi: 10.1146/annurev.bb.06.060177.001055. [DOI] [PubMed] [Google Scholar]
- 17.Chothia C. Structural invariants in protein folding. Nature. 1975;254:304–308. doi: 10.1038/254304a0. [DOI] [PubMed] [Google Scholar]
- 18.Miller S, Lesk A, Janins J, Chothia C. The accessible surface area and stability of oligomeric proteins. Nature. 1987;328:834–836. doi: 10.1038/328834a0. [DOI] [PubMed] [Google Scholar]
- 19.Miller S, Janin J, Lesk A, Chothia C. Interior and surface of monomeric proteins. J Mol Biol. 1987;196:641–656. doi: 10.1016/0022-2836(87)90038-6. [DOI] [PubMed] [Google Scholar]
- 20.Tsai J, Taylor R, Chothia C, Gerstin M. The packing density in proteins: standard radii and volumes. J Mol Bio. 1999;290:253–266. doi: 10.1006/jmbi.1999.2829. [DOI] [PubMed] [Google Scholar]
- 21.Gerstein M, Chothia C. Packing at the protein-water interface. Proc Natl Acad Sci. 1996;93:10167–10172. doi: 10.1073/pnas.93.19.10167. [DOI] [PMC free article] [PubMed] [Google Scholar]
- 22.Durchschlag H, Zipper P. Comparative investigations of biopolymer hydration by physicochemical and modeling techniques. Biophys Chem. 2001;93:141–157. doi: 10.1016/s0301-4622(01)00217-4. [DOI] [PubMed] [Google Scholar]
- 23.Aste T, Weaire DL. The pursuit of perfect packing. Bristol, PA: Institute of Physics Pub; 2000. [Google Scholar]
- 24.Hook F, Kasemo B. Variations in coupled water, viscoelastic properties, and film thickness of a mefp-1 protein film during adsorption and cross-linking: a quartz crystal microbalance with dissipation monitoring, ellipsometry, and surface plasmon resonance study. Anal Chem. 2001;73:5796–5804. doi: 10.1021/ac0106501. [DOI] [PubMed] [Google Scholar]
- 25.Hook F, Rodahl M, Brzezinski P, Kasemo B. Energy dissipation kinetics for protein and antibody-antigen adsorption under shear oscillation on a quartz crystal microbalance. Langmuir. 1998;14:729–734. [Google Scholar]
- 26.Höök F. A comparative study of protein adsorption on titanium oxide surfaces using in situ ellipsometry, optical waveguide light mode spectroscopy and quartz crystal microbalance/dissipation. Colloids Surface B. 2002;24:155–170. [Google Scholar]
- 27.Ballantine DS. Acoustic wave sensors-theory, design, and physico-chemical applications. San Diego: Academic Press; 1997. [Google Scholar]
- 28.Lu C, Czanderna AW. Applications of piezoelectric quartz crystal microbalances. New York: Elsevier; 1984. [Google Scholar]
- 29.Henry C. Measuring the masses: quartz crystal microbalances. Anal Chem. 1996:625A. [Google Scholar]
- 30.Handley J. Quartz crystal microbalances. Anal Chem. 2001:225A. doi: 10.1021/ac012432d. [DOI] [PubMed] [Google Scholar]
- 31.Sullivan CKO, Guilbault GG. Commercial quartz crystal microbalances-theory and applications. Biosens and Bioelectron. 1999;14:663–670. [Google Scholar]
- 32.Kanazawa K, Gordon J. The oscillation frequency of a quartz resonator in contact with liquid. Anal Chim Acta. 1985;175:99–105. [Google Scholar]
- 33.Muratsugu M, Ohta F, Miya Y, Hosokawa T, Kurosawa S, Kamo N, et al. Quartz crystal microbalance for the detection of microgram quantities of human serum albumin: relationship between the frequency change and the mass of protein adsorbed. Anal Chem. 1993;65:2933–2937. doi: 10.1021/ac00068a036. [DOI] [PubMed] [Google Scholar]
- 34.Rickert J, Brecht A, Gopel W. QCM Operation in liquids: constant sensitivity during formation of extended protein multilayers by affinity. Anal Chem. 1997;69:1441–1448. doi: 10.1021/ac960875p. [DOI] [PubMed] [Google Scholar]
- 35.Höök F, Rodahl M, Kasemo B, Brzezinski P. Structural changes in hemoglobin during adsorption to solid surfaces: effects of pH, ionic strength and ligand binding. Proc Natl Acad Sci. 1998;95:12271–12276. doi: 10.1073/pnas.95.21.12271. [DOI] [PMC free article] [PubMed] [Google Scholar]
- 36.Keller CA, Kasemo B. Surface specific kinetics of lipid vesicle adsorption measured with a QCM. Biophys J. 1998;75:1397–1402. doi: 10.1016/S0006-3495(98)74057-3. [DOI] [PMC free article] [PubMed] [Google Scholar]
- 37.Wegener J. Cell adhesion monitoring using a QCM: comparative analysis of different mammalian cell lines. Eur Biophys Journal. 1998;28:26–37. doi: 10.1007/s002490050180. [DOI] [PubMed] [Google Scholar]
- 38.Fredriksson C, Kihlman S, Rodahl M, Kasemo B. The piezoelectric quartz crystal mass and dissipation sensor: a means of studying cell adhesion. Langmuir. 1998;14:248–251. [Google Scholar]
- 39.Warren MC, Medeiros D, Bump EA, Braunhut SJ. Oxidative stress-induced apoptosis of endothelial cells: the role of matrix metalloproteinases. Free Radical Bio Med. 2000;29:537–547. doi: 10.1016/s0891-5849(00)00353-1. [DOI] [PubMed] [Google Scholar]
- 40.Marx KA, Zhou T, Montrone A, Shultze H, Braunhut SJ. A quartz crystal microbalance cell biosensor: detection of microtubule alterations in living cells at nm nocodazole concentrations. Biosens and Bioelectron. 2001;16:773–782. doi: 10.1016/s0956-5663(01)00219-6. [DOI] [PubMed] [Google Scholar]
- 41.Schneider TW, Martin SJ. Influence of compressional wave generation on a thickness shear mode resonator response in a fluid. Anal Chem. 1995;67:3324–3335. [Google Scholar]
- 42.Bandey HL, Martin S, Cernozek R, Hillman AR. Modeling the response of thickness-shear mode resonators under various loading conditions. Anal Chem. 1999;71:2205–2214. doi: 10.1021/ac981272b. [DOI] [PubMed] [Google Scholar]
- 43.Johannsmann D. Viscoelastic analysis of organic thin films on quartz resonators. Macromol Chem Phys. 1999;200:501–516. [Google Scholar]
- 44.Martin S, Bandey H, Cernozek R, Hillman AR, Brown MJ. Equivalent circuit model for the thickness-shear mode resonator with a viscoelastic film near film resonance. Anal Chem. 2000;72:141–149. doi: 10.1021/ac9908290. [DOI] [PubMed] [Google Scholar]
- 45.Lucklum R, Hauptmann P. The Df-DR QCM technique: an approach to an advanced sensor signal interpretation. Electrochim Acta. 2000;45:3907–3916. [Google Scholar]


