

Abstract
Stem cells (SCs) are functionally defined by their abilities to self-renew and generate differentiated cells. Although much effort has been focused on defining the common characteristics among various types of SCs, the genetic and functional differences between multipotent and pluripotent SCs have garnered less attention. We report a direct genetic and functional comparison of molecularly defined and clonally related populations of neural SCs (NSCs) and embryonic SCs (ESCs), using the Sox2 promoter for isolation of purified populations by fluorescence-activated cell sorting. A stringent expression profile comparison of promoter-defined NSCs and ESCs revealed a striking dissimilarity, and subsequent chimera analyses confirmed the fundamental differences in cellular potency between these populations. This direct comparison elucidates the molecular basis for the functional differences in pluripotent ESCs and multipotent NSCs.
Stem cells (SCs) have become the topic of intense investigation as model systems for understanding development and as potential therapeutic agents (1). However, the relationship between pluripotent and multipotent classes of SCs is uncertain, and the possibility for cellular interconversion or investigator confusion among these cells is a pressing issue in SC biology. Most recently, some observations of what appears to be exceedingly broad cell fate potential have obscured rather than enlightened our current understanding of development (reviewed in ref. 2). These results have been controversial (3-6), and the development of techniques for identifying and isolating SCs is a paramount objective for further characterization of this phenomenon (7).
Because methods for isolating SCs are varied and not well developed, we sought an approach that would allow the isolation of both embryonic SCs (ESCs) and neural SCs (NSCs) to investigate the genetic and functional relationships between these SC classes. The transcription factor Sox2 has several ideal properties for use in comparing ESCs and NSCs. First, Sox2 is strongly associated with the pluripotent phenotype, because it is expressed in ESCs and gene-deleted mice exhibit embryonic lethality at implantation (8, 9). Furthermore, Sox2 is known to act cooperatively at several promoters with Oct4 (10-13), and Oct4 is believed to be the master regulator of the pluripotent state (14, 15). Second, outside of these pluripotent cells, Sox2 is a neural restricted gene (16) and therefore unequivocally identifies a neural tissue of origin. This property is useful for further characterizing the phenomenon of unexpected plasticity in NSC populations (7). Third, a Sox2 regulatory element has been described that expresses in ESCs as well as in neural progenitor populations (17).
Materials and Methods
Production of Transgenic Mice and Isolation of Cells. The Sox2 promoter fragment used in these studies consists of the 5.5-kb BglII fragment immediately 5′ to the Sox2 gene. A pBluescript KS+ clone of this region was the kind gift of Angie Rizzino (18). Details regarding construction of the P/Sox2-GFP-Ires-Puro vector are available on request.
Transgenic ESC clones were derived from ROSA26-4 (19) ESCs as described (20) and were microinjected into blastocysts to verify ESC clones that exhibited telencephalic-restricted enhanced GFP (EGFP) expression.
Chimeric fetuses were generated via blastocyst injection of P/Sox2-GIP ESCs, collected at embryonic day (E) 14, and examined by epifluorescent microscopy to select fetuses exhibiting high degrees of chimerism (≥75%). The telencephalon was dissected free of the meninges and remaining brain tissue, diced with a scalpel blade, and digested for 5 min at 37°C in 1 ml of 0.25% wt/vol trypsin/0.54 mM EDTA. Then, 3 ml of ovomucoid trypsin inhibitor (Sigma) at 0.7 mg/ml in DMEM/F12 (1:1) was added, and the tissue was partly dissociated by trituration with a fire-polished Pasteur pipette. The suspension was pelleted for 2 min at 500 × g. The cell pellet was resuspended and further dissociated with a fire-polished Pasteur pipette in PBS. The suspension was then filtered through a 35 μM cell strainer (Falcon) into a tube containing 0.001% vol/vol DNase I and 5 μg/ml propidium iodide for analysis by fluorescence-activated cell sorting (FACS).
Flow Cytometry. Sorting and analysis of fluorescent cells were performed on a FACStar Plus cell sorter equipped with an argon laser (488 nm, 100 mW) and using CELLQUEST software (BD Biosciences). Cells were gated on forward and side scatter and dead cells were excluded by eliminating propidium iodide-positive events. Immediately after sorting, cells were pelleted for 3 min at 500 × g and resuspended in 200 μl of medium, and the density of viable cells was determined by using a hemocytometer. For isolation of total RNA, cells were sorted directly into RNeasy lysis buffer (Qiagen, Valencia, CA) at 4°C to preserve the integrity of the RNA. Cells were homogenized by passing lysate over a QIAshredder column (Qiagen), and total RNA was prepared according to the manufacturer's protocol.
Real-Time Quantitative PCR (Q-PCR). P/Sox2-EGFP-positive cells were isolated by using FACS from neural stem/progenitor cultures derived from E14 chimeric fetuses after 5 days in vitro (DIV). Gates were set to collect nonoverlapping populations of negative, low, and high P/Sox2-EGFP fluorescence intensity. Real-time quantitation was carried out as described (21). The Sox2 primer sequences were forward 5′ CACAGATGCAACCGATGCA and reverse 5′ GGTGCCCTGCTGCGAGTA.
Immunostaining. Immunocytochemical analysis was performed as described (22).
Cell Culture. ESCs were cultured by using standard procedures. Neural stem/progenitor cells were cultured on untreated tissue culture plastic in serum-free media composed of DMEM/F12 (1:1) containing N2 or B27 serum supplements (GIBCO) and 2 mM L-glutamine. Mitogenic stimulation was in the presence of human recombinant EGF and FGF2 (20 ng/ml each; Pepro-Tech, Rocky Hill, NJ) and heparin (5 μg/ml). Differentiation was carried out by plating 1 × 10⁵ cells per cm2 on glass chamber slides coated with laminin and poly-ornithine. Differentiation media consisted of N2 supplemented with 0.5% FBS and 1 μM forskolin. Media were changed every other day, and differentiation proceeded for 6-8 days.
Expression Profiling. P/Sox2-EGFP-positive cells were isolated by using FACS from ESC cultures, E14 chimeric fetuses, or neural stem/progenitor cultures derived from E14 chimeric fetuses. Triplicate samples (5 μg total RNA) were processed for labeling, hybridization, and scanning as described (23), using Murine-U74Av2 high-density oligo arrays (Affymetrix, Santa Clara, CA).
Initial quality control data analysis was performed with reference to Sandberg et al. (24), and determinations of differentially expressed genes were made by performing gene expression comparisons between each of the three P/Sox2-defined SC populations with three different analysis methods. Empirical [MICROARRAY SUITE 4.0 (Affymetrix) and BULLFROG queries] (24), statistical (Felix Naef algorithms) (25), and model-based (DCHIP 1.0) (26) analysis methods were used. These methods tend to complement each other because they each rely on different sets of assumptions. Using multiple methods generates a list of differentially expressed genes of extremely high confidence because of the requirement that the gene be detected as differential by multiple, independent data analysis methods. A detailed description of all of the data analysis procedures is provided in Supporting Text, which is published as supporting information on the PNAS web site, www.pnas.org.
Chimera Production Assay. P/Sox2-EGFP-positive cells were isolated from E14 telencephalon or cultured neural stem/progenitor cells by using FACS and were grown overnight in B27 media with growth factors. Cells were found primarily as single cells or doublets the next day, and ≈12 were injected into each blastocyst. Blastocysts were allowed to reexpand for 2-4 h at 37°C, at which time they were examined by using an inverted fluorescence microscope to assess the number of blastocysts that had cells attached to the inner cell mass (ICM). Blastocysts were transferred into the uterine horns of pseudopregnant females. Embryos were collected at E9.5 and analyzed for EGFP expression by using an inverted fluorescence microscope. To detect nontelencephalic chimerism, embryos were fixed for 10 min at room temperature in 0.2% glutaraldehyde, washed three times in detergent rinse, and then stained in 5-bromo-4-chloro-3-indolyl β-d-galactoside (X-Gal) reaction solution overnight at 4°C (20). P/Sox2-GIP ESCs were used as a positive control for ICM adherence and chimeric contribution.
For morula aggregation, the FACS-isolated cells were allowed to proliferate for 2-3 DIV, at which time small neurospheres (8-12 cells) were cocultured in microwells with morula-stage embryos as described (27). After 24 h, the resulting blastocysts were examined by fluorescence microscopy to determine whether P/Sox2-EGFP-expressing cells had become incorporated into the ICM.
Qualitative RT-PCR Confirmation. Total RNA was isolated from P/Sox2-EGFP-expressing ESCs and NSCs as described for expression profiling. Next, 4.0 μg of total RNA for each cell type was DNase-treated (DNA-free, Ambion, Austin, TX) and divided in half for first-strand cDNA synthesis with or without reverse transcriptase by using the SuperScript II kit (Invitrogen). One-twentieth of the cDNA reaction was taken for PCR template and amplified for the following number of cycles: Oct4, 23 cycles ESC and 30 cycles NSC; Klf2, 40 cycles ESC and NSC; NrOb1, 23 cycles ESC and 30 cycles NSC; Klf5, 40 cycles ESC and NSC; Crtr1, 40 cycles ESC and NSC; Klf4, 30 cycles ESC and NSC; Pem, 30 cycles ESC and NSC; Rex2, 23 cycles ESC and 30 cycles NSC; Foxg1, 30 cycles NSC and ESC; Nr2f1, 40 cycles NSC and ESC; Zic1, 40 cycles NSC and ESC; Myt1, 23 cycles NSC and 30 cycles ESC. Gapdh and β-actin were amplified for 23 cycles in both NSC and ESC samples. The following primer sets were used: Oct4, forward 5′-GTGTTCAGCCAGACCACCAT and reverse 5′-GAACCATACTCGAACCACATCC; Klf2, forward 5′-CCCAGGAAAGAAGACAGGAG and reverse 5′-AAAACGAAGCAGGCGGCAGA; NrOb1, forward 5′-TAGATGGAGAAAGCGGTCGTAG and reverse 5′-GCGGGGTTAATGGAAAGAGATG; Klf5, forward 5′-ATCTGAAACACGCGCGCACCAC and reverse 5′-GTCTACCACTGAGGCACTGT; Crtr1, forward 5′-CCTATCTCTTCCTGCTGGGT and reverse 5′-GCACAGAGCCCACATACAGA; Klf4, forward 5′-ACAAAATGCCAAGGGGTGACTG and reverse 5′-CCAAGCACCATCATTTAGGCTG; Pem, forward 5′-CGTGGACAAGAGGAAGCACAA and reverse 5′-TCTTCTCCTTCGCCTTCTGTTC; Rex2, forward 5′-CACAGAAGAA AGCAGGATCGC and reverse 5′-CCTCAGTCTCGGGGCTAATC; Foxg1, forward 5′-CCTCCCCATTTCTGTACGTTTG and reverse 5′-GTCCACCAGATAGCTCCATGA; Nr2f1, forward 5′-AAGAACGATTTGGAAGAGGACC and reverse 5′-TGAAGAACAGCCTCGACAACAT; Zic1, forward 5′-GTAAAACAGAGGAGGCAGCAAG and reverse 5′-AAAGACCACCACGCCACGAT; Myt1, forward 5′-CAGTGTCTCCTATGATGTCCTC and reverse 5′-GGCTGCAAACTCCAAAACTTCC; Gapdh, forward 5′-ACCACAGTCCATGCCATCAC and reverse 5′-TCCACCACCCTGTTGCTGGA; β-actin, forward 5′-TCTTGTGGCTTTAGGAGCTTGAC and reverse 5′-CCAGAGGCATACAGGGACAAC.
Results
P/Sox2-EGFP Permits Isolation of NSCs from Fetal Mice. We have used the Sox2 promoter to express the EGFP (Fig. 1A) in ESCs and chimeric fetal mice to isolate genetically identical populations of ESCs and NSCs for direct genetic and functional comparison. The transgene exhibits regional specificity to the fetal telencephalon (Fig. 1B) and is exclusively expressed in the immature neuroepithelium, as demonstrated by the lack of EGFP colocalization with the early neuronal marker βIII-tubulin (Fig. 1C). P/Sox2-EGFP-expressing cells were isolated from the telencephalon of E14 chimeric fetal mice by using FACS. The P/Sox2-expressing population was purified in this manner before initiating cultures to eliminate cells that do not express the transgene, because of regional specificity. This purification step also eliminates nontransgenic cells derived from the host blastocyst in these chimeric animals. From cultured populations the proportion of P/Sox2-EGFP+ cells was ≈8% (gate M4), and the population of EGFP+ cells was further subdivided into high (M3) and low (M2) expression levels based on fluorescence intensity (Fig. 1D). These positive populations, as well as a population of P/Sox2-EGFP- cells, were individually collected, and the levels of Sox2 mRNA were determined for each by using real-time quantitative PCR. The fluorescence intensity of P/Sox2-EGFP exhibits a positive correlation with the amount of Sox2 mRNA (Fig. 1E). However, a significant level of Sox2 mRNA exists in the P/Sox2-EGFP- population. Because all nontelencephalic and nontransgenic cells derived from the host blastocyst were previously eliminated on initiation of these cultures, expression of Sox2 mRNA in the fluorescence-negative fraction indicates that the 5.5-kb element defines only a subset of cells within a larger population that expresses the Sox2 gene.
Fig. 1.
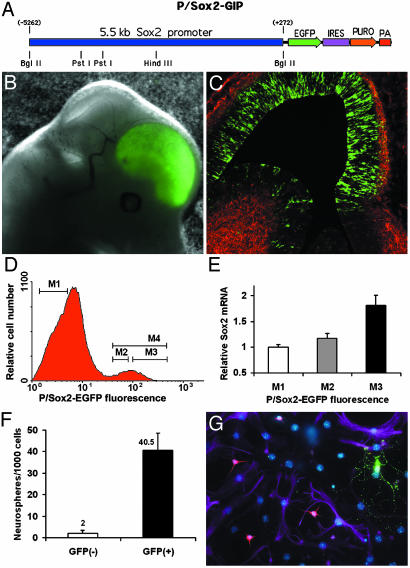
P/Sox2-EGFP identifies a subset of Sox2-expressing cells that are NSCs. (A) Structure of the transgene. (B and C) The 1D2 ESC clone exhibits telencephalic-restricted expression at E14, and the localization of P/Sox2-EGFP expression is in the cell-dense neuroepithelium surrounding the lateral ventricles but not in differentiating cells identified by βIII-tubulin (red). (D) FACS isolation of P/Sox2-EGFP high, low, and negative populations from short-term cultures derived from E14 fetuses. The total proportion of expressing cells represents ≈8% of the sorted population that was further subdivided based on high and low expression levels. (E) Quantitation of Sox2 mRNA in populations with varying fluorescence intensity by real-time quantitative PCR, relative to the control Hprt message, exhibits correlation with fluorescence intensity. Notably, the P/Sox2-EGFP- fraction still contains cells expressing significant levels of Sox2 mRNA, indicating that the transgene marks only a subset of cells that express the Sox2 gene. (F) Selection of P/Sox2-EGFP-expressing cells provides a 20-fold enrichment in neurosphere-initiating activity over nonexpressing cells from cultured populations. (G) All clones derived from single P/Sox2-EGFP cells are multipotent and differentiate into neurons, astrocytes, and oligodendrocytes, as indicated by βIII-tubulin (red), GFAP (purple), and RIP (green) immunoreactivity.
P/Sox2 permits the isolation of NSCs from cultured telencephalic progenitor populations, as evidenced by an increase in the number of neurospheres generated from P/Sox2-EGFP+ over P/Sox2-EGFP- cells. We observed that 95% of the neurosphere-initiating activity was found in the P/Sox2-EGFP-expressing population (Fig. 1F). It was not feasible to perform enrichment experiments from freshly isolated cells because of the chimeric nature of the fetuses and the regional specificity of expression of the P/Sox2 transgene. Thus, significant numbers of neurosphere-initiating cells were observed in the EGFP- population in assays of freshly isolated cells.
In addition, P/Sox2-expressing cells are bona fide NSCs, exhibiting the hallmarks of self-renewal and multilineage differentiation when cultured as clonal isolates. P/Sox2-EGFP cells were isolated by using FACS directly from the telencephalon of E14 fetuses or from cultured populations derived from E14 telencephalon. Cells were plated individually into wells of 96-well plates by limiting dilution. Proliferating clones derived from single cells were dissociated after 7-14 DIV and replated into 96-well plates, where some wells were observed to contain a single cell. Wells with single cells that gave rise to secondary clones demonstrated the self-renewal capacity of P/Sox2-EGFP cells. The secondary clones were expanded and differentiated to verify that progeny of neuronal, astrocytic, and oligodendrocytic lineages were produced (Fig. 1G). We observed that 50% (25/50) of single P/Sox2-EGFP+ cells isolated from culture gave rise to primary clones, and single cell-derived secondary clones were generated from every primary clone. Furthermore, all of the secondary clones exhibited a multipotent character. Thus, given the constraints on cell survival after FACS isolation, at least 50% of P/Sox2-EGFP cells are SCs in vitro; this finding validates the P/Sox2 approach for prospective isolation.
Expression Profiling of P/Sox2 Defined SCs. The availability of P/Sox2 as a common molecular identifier for both ESCs and NSCs allows for their isolation and thereby permits a direct transcriptional profiling comparison between pluripotent and multipotent SCs, respectively. An overview of the experimental design for transcriptional profiling, as well as some of the observed transcripts that one might expect, is illustrated in Fig. 2.
Fig. 2.
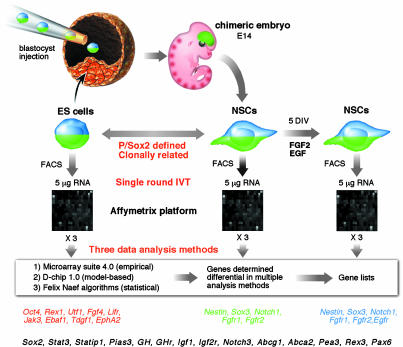
Expression profiling experimental design. Three populations of cells isolated by using FACS for P/Sox2-EGFP expression are compared. The three populations are of clonal origin because they all originate from the 1D2 clone of P/Sox2-GIP ESCs by virtue of isolating the NSCs from E14 chimeric fetuses. Three replicates for each population were derived from separate flasks of cells and/or different pools of chimeric embryos. The Affymetrix platform was used for generating expression profiles beginning with 5 μg of total RNA for each replicate. Three independent methods were used for data analysis, and the genes found to be differentially expressed in multiple methods are considered to be different between populations with a very high degree of confidence. Some of the expected genes found to be enriched in ESCs (red), NSCf (green), and NSCc (blue) are listed, as well as genes that are expressed at equivalent levels in all three populations (black).
The transcriptional profiling approach outlined above yielded a very precise fingerprint of each SC population that we then subjected to a very stringent matrix analysis paradigm for identification of differential transcripts. This procedure identified large numbers of differential transcripts among all three populations of P/Sox2-defined SCs. As expected, the overall difference was greater between ESC and either population of NSCs than between freshly isolated and cultured NSC (NSCf and NSCc, respectively) populations. The majority of the differences between ESC and NSCc were in fact not shared between ESC and NSCf, and nearly 50% of the differences between ESC and NSCf were unique as well (Table 1). However, the magnitude of transcriptional changes between freshly isolated P/Sox2-EGFP cells and those same cells grown for 5 DIV was unexpected. These changes may reflect the further selection of a subset of P/Sox2-EGFP cells for response to mitogenic stimulation. Indeed, one of the genes found in NSCc and absent from NSCf was the Egfr, indicative of the proliferative recruitment in response to EGF. Despite these changes in gene transcripts, there is consistency in functional behavior with regard to the multipotent and pluripotent nature of the cells (see chimera analyses below). This finding suggests that the genes found to be differentially expressed between both ESC v. NSCf and ESC v. NSCc represent the genes that are most reliably different between pluripotent and multipotent SC classes. This difference amounts to 666 genes at the level of 1.4-fold change and 269 at 2.0-fold (Table 1, Pluripotent), each detected with at least two of three independent methods. This method of comparison highlights the large numbers of genes that may play important roles in defining these two different levels of SC potency. A logical place to begin further investigation is with those genes that are not just enriched but completely specific to each SC class, based on absence of expression using gene chip determinations. The complete lists of pluripotent-specific (n = 112) and multipotent-specific (n = 158) genes are provided in Table 2. A fully searchable database for all classifications of differential as well as nondifferential genes is also provided (Table 3, which is published as supporting information on the PNAS web site).
Table 1. Stringent matrix analysis defines a highly confident set of differentially expressed genes.
| ESC*
|
ESC*
|
Pluripotent†
|
|||||||||||||
|---|---|---|---|---|---|---|---|---|---|---|---|---|---|---|---|
| Fold change | Specific | Enriched | Depleted | NSC fresch-specific* | Totals* | Specific | Enriched | Depleted | NSC cultured-specific* | Totals* | Specific | Enriched | Depleted | Multipotentspecific† | Totals† |
| ≥1.4 | 155 | 273 | 372 | 312 | 1,112 | 249 | 474 | 403 | 327 | 1,453 | 112‡ | 199 | 197 | 158‡ | 666 |
| ≥2.0 | 71 | 117 | 189 | 126 | 503 | 100 | 229 | 234 | 141 | 704 | 54 | 93 | 79 | 43 | 269 |
The number and manner in which the highly confident, differentially expressed genes vary among ESC and NSCf or ESC and NSCc populations.
The union was taken of these two groups and represents those genes found to be differentially expressed between pluripotent and multipotent SCs.
Complete lists are provided in Table 2.
Table 2. Lists of pluripotent- and multipotent-specific genes by functional categories.
| Category | n = 112 | Pluripotent-specific | n = 158 | Multipotent-specific |
|---|---|---|---|---|
| Transcriptional regulation | 21 | Oct4, Utf1, Rex1/2, Klf2/5, NrOb1, Crtr1, Pem, Stat6, Tcf7/15, Rarg, Ell2, Trim25, Tcea3, Aire, Gbx2, ESTs highly similar to Tbx3, ESTs moderately similar to Znf41, ESTs weakly similar to Nkx2.5 | 24 | Foxg1, Nr2f1, Myt1, Zic1, Sox3/4/11, Brn1/4, Mash1, Hes5, Hey1, Dlx1, Cutl1, Cbx4, ArxGtf2h1, Jun, Lmyc1, ld4, mKF1, ESTs highly similar to Kruppel-like Zfp and Af9, ESTs moderately similar to Zfp2 |
| Chromatin modulation | 0 | None detected | 2 | Sirt2, ESTs highly similar to Snf2a |
| RNA binding | 4 | Esg1, Rbms1, Dazl, ESTs similar to Rbpms | 3 | Rbmx, Cugbp2, ESTs moderately similar to Rbm4 |
| Growth factors | 4 | Fgf4, Tdgf1, Ebaf, Gdf3 | 2 | Pleiotropin, Igfbp5 |
| Receptors | 5 | F2rl1 (thrombin R-like 1), Sdfr2, Folate R1, Epha2, Tacstd1 | 8 | Fgfr2, Notch1, Gpr56, Ptpra/g/o/z, ESTs highly similar to thyroid hormone R alpha |
| Transporters | 0 | None detected | 10 | Blbp, Fabpe, Syt11, GluR-B (and splice variant), Gria2, Grik5, Clcn4-2, Kcnk2, Boct |
| Kinases and phophotases | 4 | Jak3, Hck, ESTs moderately similar to dual specificity kinase, Inpp5d | 10 | Jak2, Ddr1, Hipk2, Tesk1, Pftk1, Snrk, Ptpn9, ESTs highly similar to PKC-nu, PTK, and PP2A-beta |
| Cell cycle | 3 | Mkrn3, Stag3, Gste1 | 9 | cyclin D2, p21 activated kinase 3, Nfia/x, Gas1, Gadd45g, Septin 5, ESTs highly similar to Rgc32 and candidate mediator of p53-dependent G2 arrest |
| Other signaling molecules | 15 | Ptch2, Upp, Annexin 1/11, Cish3, Serpine1, Gjb3, Spint1, Tfpi, Als2, Ndr1, Ly75, Caplpactin (Calgizzarin), ESTs highly similar to Rsg5, ESTs moderately similar to interferon | 18 | Smo, Fzd2, Delta-like 1, Itgp, Pea15, Rgs2, Rab11a, Arhn, Doublecortin, Dab1, Pkia, Edr2, adenylate cyclase 6, Apba2/b1, ESTs highly similar to Zfp289/B7-H3 |
| Metabolism | 12 | Slc2a3/7a3/7a7/27a2/29a1/38a4, Gfpt2, Pfkp, Cox7a1, Apoc1, Ddc, ESTs moderately similar to Slc39a4 | 7 | Scp2, Pam, aSMase, Pafah1b2, dihydropyrimidinase-like (Dpysl) 3/4, ESTs moderately similar to Dpysl4 |
| Cell adhesion | 6 | Icam1, Jcam1, Ctgf, Spp1, Endoglin, Jup, | 9 | Vcam1, Jcam3, Alcam, Pcdha4/6, Catenin alpha2/delta2, Neuropilin, Kit ligand |
| Cytoskeleton | 5 | Acta2, Tuba3, CD2-associated protein, Epb4, 1/4a, ESTs highly similar to Desmoyokin | 2 | Kif3a, Gephrin |
| Toxic response | 2 | Mdr1, Ephx2 | 0 | None detected |
| Vesicle traffic | 1 | Stx3 | 4 | Nsg1/2, Secretogranin 3, Sgne1 |
| Other | 7 | B3gnt1, Fbxo15, Eif1a, Pcolce, Crip, Col18a1, Nidogen | 10 | B4galt2, Efnb1, Gdap1, Psap, Mfap2, Ubl4, ESTs highly similar to Ubp3, ESTs moderately similar to Stinp, ESTs weakly similar to protein disulfide isomerase |
| Unknown | 23 | Bcl3, Tcl1, Trap1a, Stra8, Mov10, Esau protein, Tex19, Tex20, Tcstv1, two EST clusters highly similar to Tcstv1, ESTs highly similar to CGI-83, ESTs moderately similar to Plackophilin2/NDP52/DC12, ESTs weakly similar to WAP, seven EST clusters of little or no homology | 40 | Fjx1, Gpm6b, Neuroanatin, Lrrn1, Mpdz, Pard6a, Tm4sf2/sf6,Sez6/17, Aig1, Edp1, Lmo1, Ssbp2, UGS148 protein, Eig180, Rnf42, ESTs highly similar to Tetraspan met2/Ptpz/KIAA0871/FLJ12750/MGC11034, ESTs weakly similar to Mucin2/Elastic titin/MGC3035, 15 ESTs |
There are 112 genes determined to be present only in ESCs and differentially expressed at the 1.4-fold change level between ESCs and both NSC populations. Conversely, there are 158 genes present only in NSCf and NSCc and differentially expressed with ESCs. Transcription factors in bold were validated by RT-PCR for presence/absence (see Fig. 4).
Chimera Analysis of P/Sox2 SC Populations. The large degree of difference in transcriptional profiles between populations of SCs that are clonally related and defined by identical molecular criteria was surprising. However, the transcriptional profiles represent a highly accurate molecular fingerprint of these SC populations. Despite these drastic differences, we wanted to test functionally for pluripotent behavior in the fetus-derived P/Sox2 populations by using chimera analyses. Functional confirmation of the pluripotent and multipotent nature of these SC populations is crucial in light of the previous reports suggesting NSC pluripotentiality (28, 29).
The P/Sox2-EGFP cells used for chimera analyses were isolated by using FACS from chimeric E14 fetuses (fresh), short-term cultured P/Sox2 progenitors (one to two passages), or long-term passaged clonal isolates (more than eight passages). Using morula aggregation (27), we observed that P/Sox2 ESCs efficiently incorporated into the ICM (18/19), whereas P/Sox2-derived neurospheres only adhered to the outside of the embryo and never incorporated into the ICM (0/24). To circumvent a possible requirement for specific cell surface interactions between the embryo and donor cells, blastocyst injections were performed, because this method places the injected cells directly in contact with the existing ICM. After injection, blastocysts were returned to the incubator for 2-4 h to allow reexpansion of the blastocoel cavity. Embryos were examined by fluorescent microscopy to determine whether the injected cells had adhered to the ICM surface (Fig. 3 A and D). A similar frequency of adherence to the ICM was observed for ESCs and NSCs, and this frequency was primarily dependent on injection technique. All embryos were transferred into pseudopregnant females. Developing fetuses were collected at E9.5, examined for P/Sox2-EGFP expression (Fig. 3 B and E), and subsequently processed by using X-Gal histochemistry for detection of any nontelencephalic chimerism (Fig. 3 C and F). Detection of nontelencephalic chimerism is possible because the parental ESC line contains the LacZ gene expressed ubiquitously during development from the ROSA26 locus (19). The lack of detected chimerism for E14-derived NSCs is in sharp contrast to the pluripotent character of the P/Sox2-EGFP ESCs. Even though the NSCs adhered to the ICM of the blastocyst at the same frequency as ESCs, they were definitely not pluripotent, as demonstrated by the complete lack of chimerism in 76 embryos analyzed at E9.5, irrespective of time spent in vitro. The number of embryos recovered after blastocyst injection and transfer to pseudopregnant females was equivalent for ESCs (64%) and NSCs (56%), indicating that the injected NSCs do not elicit toxicity in the developing embryos (Fig. 3G). In total, 100 events of chimeric potential were analyzed by the two chimera methods combined for P/Sox2-defined NSCs after varying periods of in vitro culture. The complete lack of detectable chimerism is in sharp contrast to the robust chimeric contribution achieved with P/Sox2-defined ESCs. This convincing demonstration that the multipotent NSCs clearly lack the hallmark abilities of pluripotent ESCs supports the use of these genetic comparisons for further studies of SC potency.
Fig. 3.
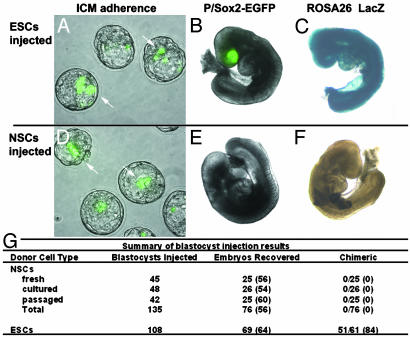
Only P/Sox2-EGFP-defined ESCs are pluripotent. P/Sox2-defined ESCs and NSCs were injected into blastocysts followed by analysis at E3.5 and E9.5 time points. (A and D) There is a similar frequency of adherence to the ICM for ESCs and NSCs injected into blastocysts. Only ESCs participate in development to form highly chimeric embryos at E9.5 (B and C), whereas the P/Sox2-EGFP cells derived from E14 fetuses do not exhibit chimerism to any tissues (E and F). (G) The numbers of blastocysts injected and E9.5 embryos recovered are presented for P/Sox2-defined NSCs and ESCs. The frequency of recovering an E9.5 embryo is equivalent for NSC and ESC injections, indicating that no toxicity is imparted by the injected NSCs. Therefore, the lack of chimerism in the 76 NSC-injected embryos functionally identifies these P/Sox2-EGFP+ cells distinctly as multipotent SCs.
Verification of Presence/Absence by Qualitative RT-PCR. Functional verification of the pluripotent and multipotent character of these SC populations identifies the differentially transcribed genes as molecular correlates of this difference. Of particular interest on this list are genes that are present in ESCs and absent from NSCs, because these genes may function specifically in the establishment or maintenance of the pluripotent state. Transcription factors were chosen for the first level of analysis because of their commonly described roles in regulation of cell fates and differentiation. As might be expected, the gene encoding the transcription factor Oct4 is at the top of the list with regard to fold change, because it is highly expressed in ESCs and absent from NSCs. The pivotal role of Oct4 in both specification and maintenance of the pluripotent phenotype has already been shown (15). Groups of transcription factors that exhibited a gene chip-predicted present/absent pattern in either ESCs or NSCs (bold in Table 2) were chosen for further analysis.
To verify the presence and absence of these genes in their respective compartments, we used qualitative RT-PCR with up to 40 cycles of amplification for a much more sensitive method of detecting rare transcripts. In addition, for RT-PCR verification we used samples that were prepared by FACS isolation in the same manner but independent from those used for transcriptional profiling. All genes except Zic1 exhibited strong differential expression by RT-PCR in the same direction as predicted by gene chip analysis. The detection of completely ESC-specific transcripts was verified for seven of eight genes, with Klf4 being the exception, because a small amount of message was detectable in the NSC population (Fig. 4). The RT-PCR results confirmed the differential nature of these genes but highlighted the need for additional methods of verification for presence/absence determinations.
Fig. 4.
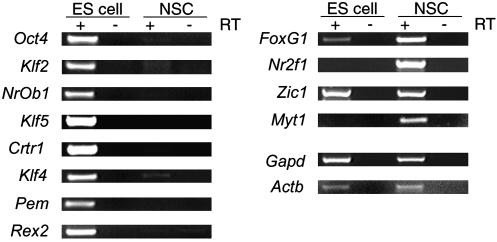
RT-PCR confirmation of presence/absence in ESC and NSC populations. Groups of SC class-specific transcription factors of high confidence (2.0 or greater fold change) were assayed by RT-PCR as a more sensitive method for detection of rare transcripts. Most of the ESC-specific genes were verifiably absent in NSCs. Only two of four NSC-specific genes were found absent from ESCs. Gapdh and β-actin gene signals are approximately the same, indicating an equivalent input for both cell types.
Discussion
Here we report the development of an approach based on the Sox2 promoter for the isolation and comparison of NSCs and ESCs. The P/Sox2 transgene is expressed exclusively in ESCs and the immature neuroepithelium of the fetal telencephalon, thus allowing prospective isolation of both populations by FACS. Selection of P/Sox2-EGFP cells from fetal mice enriches for neurosphere-initiating activity, and individually plated cells have NSC function. The transcriptional profiles of clonally related NSCs and ESCs defined by P/Sox2-EGFP expression were compared. This comparison revealed an extraordinary degree of difference between these pluripotent and multipotent SC populations. To ensure that the fetus derived P/Sox2-EGFP populations do not exhibit pluripotent character, despite their drastically different genetic profiles, these cells were aggregated with morula-stage embryos or injected into blastocysts. This assay functionally demonstrates the multipotent and pluripotent character of the P/Sox2-defined NSC and ESC populations, respectively, and validates the differentially expressed genes as potential molecular correlates of this functional difference.
Recently, two other groups have reported expression profiling comparisons between ESCs and multipotent SCs (30, 31). This report differs from those in that it focuses on elucidating the differences between these SC populations rather than seeking a common transcriptional profile that may be attributable to “stemness.” In addition, there are several important aspects of our transcriptional profiling approach that contribute to making it the most accurate and reliable comparison of NSCs and ESCs reported to date. First, because P/Sox2 is down-regulated in the differentiating progeny of both ESCs and NSCs, the selection of P/Sox2-expressing cells provides a more homogeneous population for each SC and defines these populations by identical criteria (Fig. 5, which is published as supporting information on the PNAS web site). Purification eliminates the need to remove the “differentiation genes” that are expressed in heterogeneous SC populations. Performing direct comparisons between the entire transcriptome of ESCs and NSCs adds power to the comparison, because removing “differentiation genes” from comparative analysis has no biological rationale. The fact that a gene is expressed in both the SC and its differentiating progeny does not exclude it from having functional importance to that SC's “genetic program.” Second, because the NSCs are isolated from chimeric fetuses, populations are provided that share identical genomes, because they are all derived from the same ESC clone. This feature will eliminate the variability in gene transcription that arises from genomic heterogeneity (24). Third, this isolation method permits, for the first time, the analysis of both freshly isolated and cultured NSC populations. Fourth, because populations can be acquired in sufficient quantity, this method eliminates the need for multiple rounds of in vitro transcription (IVT). Single-round IVT better maintains the 5′ complexity of cRNA and reduces the introduction of data biases that accompany multiple-round IVT protocols (32). Fifth, the use of three independent data analysis methods for determinations of differential transcripts adds an additional level of confidence to the gene lists.
In conclusion, we have presented a transgenic approach that uses a common property of SCs for the purification of multipotent NSC and pluripotent ESC populations to generate direct genetic and functional comparisons between these two SC classes. These comparisons have underscored the genetic dissimilarity between functionally verified multipotent and pluripotent populations, providing new avenues for investigation of the biology underlying the control of cellular potency.
Note Added in Proof. Two groups recently described a novel homeobox transcription factor, Nanog, that plays a functionally essential role in maintaining the pluripotent state of ESCs (33, 34). This gene was one of the most highly pluripotent-specific transcripts detected in our gene chip analyses at the level of ≥2.0-fold change, and in this report is classified in Table 2 as one of the “seven EST clusters of little or no homology.” It may be identified in Table 3 by probe set ID numbers 161072_at and 161653_f_at or by query for UniGene number Mm.6047.
Supplementary Material
Acknowledgments
We thank the following people from The Salk Institute's core facilities for their invaluable services: M. Baker of DNA sequencing and quantitative PCR, A. Garcia of functional genomics, and D. Chambers and J. Barra of the flow cytometry core. We thank B. Aimone, V. Chu, and J. Hsieh for valuable assistance with expression profile data analysis, and W. Deng, M. L. Gage, and K. Nakashima for their critical reading of the manuscript.
This paper results from the Arthur M. Sackler Colloquium of the National Academy of Sciences, “Regenerative Medicine,” held October 18-22, 2002, at the Arnold and Mabel Beckman Center of the National Academies of Science and Engineering in Irvine, CA.
Abbreviations: SC, stem cell; EGFP, enhanced GFP; En, embryonic day n; ESC, embryonic SC; FACS, fluorescence-activated cell sorting; ICM, inner cell mass; NSC, neural stem cell; NSCc, cultured NSC; NSCf, freshly isolated NSC.
References
- 1.Weissman, I. L. (2000) Science 287, 1442-1446. [DOI] [PubMed] [Google Scholar]
- 2.Wulf, G. G., Jackson, K. A. & Goodell, M. A. (2001) Exp. Hematol. 29, 1361-1370. [DOI] [PubMed] [Google Scholar]
- 3.Wagers, A. J., Sherwood, R. I., Christensen, J. L. & Weissman, I. L. (2002) Science 297, 2256-2259. [DOI] [PubMed] [Google Scholar]
- 4.Morshead, C. M., Benveniste, P., Iscove, N. N. & van der Kooy, D. (2002) Nat. Med. 8, 268-274. [DOI] [PubMed] [Google Scholar]
- 5.Brazelton, T. R., Rossi, F. M. V., Keshet, G. I. & Blau, H. M. (2000) Science 290, 1775-1779. [DOI] [PubMed] [Google Scholar]
- 6.Bjornson, C. R. R., Rietze, R. L., Reynolds, B. A., Magli, M. C. & Vescovi, A. L. (1999) Science 283, 534-537. [DOI] [PubMed] [Google Scholar]
- 7.Anderson, D. J., Gage, F. H. & Weissman, I. L. (2001) Nat. Med. 7, 393-395. [DOI] [PubMed] [Google Scholar]
- 8.Collignon, J., Sockanathan, S., Hacker, A., Cohen-Tannoudji, M., Norris, D., Rastan, S., Stevanovic, M., Goodfellow, P. N. & Lovell-Badge, R. (1996) Development (Cambridge, U.K.) 122, 509-520. [DOI] [PubMed] [Google Scholar]
- 9.Li, M., Pevny, L., Lovell-Badge, R. & Smith, A. (1998) Curr. Biol. 8, 971-974. [DOI] [PubMed] [Google Scholar]
- 10.Nishimoto, M., Fukushima, A., Okuda, A. & Muramatsu, M. (1999) Mol. Cell. Biol. 19, 5453-5465. [DOI] [PMC free article] [PubMed] [Google Scholar]
- 11.Yuan, H., Corbi, N., Basilico, C. & Dailey, L. (1995) Genes Dev. 9, 2635-2645. [DOI] [PubMed] [Google Scholar]
- 12.Ambrosetti, D.-C., Basilico, C. & Dailey, L. (1997) Mol. Cell. Biol. 17, 6321-6329. [DOI] [PMC free article] [PubMed] [Google Scholar]
- 13.Botquin, V., Hess, H., Fuhrmann, G., Anastassiadis, C., Gross, M. K., Vriend, G. & Scholer, H. R. (1998) Genes Dev. 12, 2073-2090. [DOI] [PMC free article] [PubMed] [Google Scholar]
- 14.Nichols, J., Zevnik, B., Anastassiadis, K., Niwa, H., Klewe-Nebenius, D., Chambers, I., Scholer, H. & Smith, A. (1998) Cell 95, 379-390. [DOI] [PubMed] [Google Scholar]
- 15.Niwa, H. J., Miyazaki, J. & Smith, A. G. (2000) Nat. Genet. 24, 372-376. [DOI] [PubMed] [Google Scholar]
- 16.Wood, H. B. & Episkopou, V. (1999) Mech. Dev. 86, 197-201. [DOI] [PubMed] [Google Scholar]
- 17.Zappone, M. V., Galli, R., Catena, R., Meani, N., De Biasi, S., Mattei, E., Tiveron, C., Vescovi, A. L., Lovell-Badge, R., Ottolenghi, S. & Nicolis, S. K. (2000) Development (Cambridge, U.K.) 127, 2367-2382. [DOI] [PubMed] [Google Scholar]
- 18.Wiebe, M. S., Wilder, P. J., Kelly, D. & Rizzino, A. (2000) Gene 246, 383-393. [DOI] [PubMed] [Google Scholar]
- 19.Friedrich, G. & Soriano, P. (1991) Genes Dev. 5, 1513-1523. [DOI] [PubMed] [Google Scholar]
- 20.Hogan, B. L., Beddington, R., Costantini, F. & Lacy, E. (1994) Manipulating the Mouse Embryo: A Laboratory Manual (Cold Spring Harbor Lab. Press, Plainview, NY).
- 21.Zhao, X., Lein, E. S., He, A., Smith, S. C., Aston, C. & Gage, F. H. (2001) J. Comp. Neurol. 441, 187-196. [DOI] [PubMed] [Google Scholar]
- 22.Palmer, T. D., Markakis, E. A., Willhoite, A. R., Safar, F. & Gage, F. H. (1999) J. Neurosci. 19, 8487-8497. [DOI] [PMC free article] [PubMed] [Google Scholar]
- 23.Wodicka, L., Dong, H., Mittmann, M., Ho, M. H. & Lockhart, D. J. (1997) Nat. Biotechnol. 15, 1359-1367. [DOI] [PubMed] [Google Scholar]
- 24.Sandberg, R., Yasuda, R., Pankratz, D. G., Carter, T. A., Del Rio, J. A., Wodicka, L., Mayford, M., Lockhart, D. J. & Barlow, C. (2000) Proc. Natl. Acad. Sci. USA 97, 11038-11043. [DOI] [PMC free article] [PubMed] [Google Scholar]
- 25.Naef, F., Hacker, C. R., Patil, N. & Magnasco, M. (2002) Genome Biol. 3, RESEARCH0018.1-0018.11. [DOI] [PMC free article] [PubMed] [Google Scholar]
- 26.Li, C. & Wong, W. H. (2001) Proc. Natl. Acad. Sci. USA 98, 31-36. [DOI] [PMC free article] [PubMed] [Google Scholar]
- 27.Khillan, J. S. & Bao, Y. (1997) BioTechniques 22, 544-549. [DOI] [PubMed] [Google Scholar]
- 28.Clarke, D. L., Johansson, C. B., Wilbertz, J., Veress, B., Nilsson, E., Karlstrom, H., Lendahl, U. & Frisen, J. (2000) Science 288, 1660-1663. [DOI] [PubMed] [Google Scholar]
- 29.Reitze, R. L., Valcanis, H., Brooker, G. F., Thomas, T., Voss, A. K. & Bartlett, P. F. (2001) Nature 412, 736-739. [DOI] [PubMed] [Google Scholar]
- 30.Ramalho-Santos, M., Yoon, S., Matsuzaki, Y., Mulligan, R. C. & Melton, D. A. (2002) Science 298, 597-600. [DOI] [PubMed] [Google Scholar]
- 31.Ivanova, N. B., Dimos, J. T., Schaniel, C., Hackney, J. A., Moore, K. A. & Lemischka, I. R. (2002) Science 298, 6001-6604. [DOI] [PubMed] [Google Scholar]
- 32.Baugh, L. R., Hill, A. A., Brown, E. L. & Hunter, C. P. (2001) Nucleic Acids Res. 29, e29. [DOI] [PMC free article] [PubMed] [Google Scholar]
- 33.Mitsui, K., Tokuzawa, Y., Itoh, H., Segawa, K., Murakami, M., Takahashi, K., Maruyama, M., Maeda, M. & Ymanaka, S. (2003) Cell 113, 631-642. [DOI] [PubMed] [Google Scholar]
- 34.Chambers, I., Colby, D., Robertson, M., Nichols, J., Lee, S., Tweedie, S. & Smith, A. (2003) Cell 113, 643-655. [DOI] [PubMed] [Google Scholar]
Associated Data
This section collects any data citations, data availability statements, or supplementary materials included in this article.