

Abstract
There have been a variety of nanoparticles created for in vivo uses ranging from gene and drug delivery to tumor imaging and physiological monitoring. The use of nanoparticles to measure physiological conditions while being fluorescently addressed through the skin provides an ideal method toward minimally invasive health monitoring. Here we create unique particles that have all the necessary physical characteristics to serve as in vivo reporters, but with minimized diffusion from the point of injection. These particles, called microworms, have a cylindrical shape coated with a biocompatible porous membrane that possesses a large surface-area-to-volume ratio while maintaining a large hydrodynamic radius. We use these microworms to create fluorescent sodium sensors for use as in vivo sodium concentration detectors after subcutaneous injection. However, the microworm concept has the potential to extend to the immobilization of other types of polymers for continuous physiological detection or delivery of molecules.
Keywords: hydrogel, initiated chemical vapor deposition, conformal coating
Direct, minimally invasive monitoring of in vivo physiological conditions presents a route to determine health status in real time and address needs as they arise. To accomplish these measurements, there needs to be a reporter in the body that can be quantified without blood or fluid withdrawal, which can either be endogenous or a submillimeter system that can be placed into the skin. A submillimeter system can be comprised of nanoparticles that have fluorescent properties thus relaying information transdermally using light. We have recently reported on nanosensors designed to monitor either in vivo glucose or sodium (1, 2). These nanosensors are comprised of optode material (3–6), the optical equivalent of an ion-selective electrode, and a PEG coating. Nanoparticle optodes were first described as probes encapsulated by biologically localized embedding (PEBBLEs) (7, 8). Brasuel et al. later improved PEBBLEs based on ion-selective optodes by enhancing the electrolyte selectivity (9, 10). Dubach et al. improved these nanosensors by increasing the lifetime in solution and reducing the size for intracellular detection (11, 12). These sensors also had PEG-based coatings that made them biocompatible and stable, allowing successful use for in vivo experiments (2).
Continuously monitoring sodium in vivo addresses multiple diseases and could prevent clinical complications during certain procedures. Sodium imbalances may lead to hypernatremia (13) or hyponatremia (14)—the most common electrolyte disorder. Monitoring sodium may provide an insight into the progression of subarachnoid hemorrhage or syndrome of inappropriate antidiuresis (15, 16). However, to provide continuous monitoring, sensors need to be small enough to have a rapid response to changes in concentration yet be large enough to reside at the sight of injection without diffusing away or being endocytosed or phagocytosed by cells. Complementing the extensive research on the influence of particle size in biological systems, recent work has revealed the potential advantages of controlling particle shape (17, 18). Here we exploit the in vivo physical characteristics of nano- and micromaterials (19) by creating microworms—multiple micron long cylinders with a high aspect ratio. Whereas nanomaterials have characteristics that are preferable in biology, materials on the micron scale also maintain unique properties depending on the application (20). These microworms have a large surface-area-to-volume ratio as is common in nanomaterials and the large effective hydrodynamic radius of a micromaterial.
We demonstrate the templated fabrication of microworms with hydrogel coatings using initiated chemical vapor deposition (iCVD) technique. Initiated CVD (21, 22) is a vapor phase polymer synthesis technique where the monomer and initiator vapor is delivered into the reactor in the vapor phase. The polymerization is initialized on the substrate surface when the initiator radicals that are created by the thermal decomposition of the initiator molecules react with the adsorbed monomers on the substrate surface. The low operating pressures and substrate temperatures enable polymer deposition on delicate substrates (22). Furthermore, the conformal nature of the iCVD technique can be exploited to coat high aspect ratio features and subsequently create nanotubes of highly cross-linked polymers (23). Previous work on planar optode sensors using a biocompatible hydrogel layer, poly(2-hydroxyethyl methacrylate) [p(HEMA)], deposited by photoinitiated chemical vapor deposition (piCVD) showed no interference of the hydrogel with the sensor function (24). Hydrogels present an environment that resembles the hydrated state of tissues, making them ideal coating materials for particle use in vivo (25).
Results and Discussion
Multiple deposition and filling steps were used to create the tubular scaffold and filled microworms. The anopore aluminum oxide (AAO) template was first coated with hydrogel, p(HEMA), using deposition to create the tube structure (Fig. 1B). The coated scaffold was then filled with optode, and excess optode was rinsed off of the top of the template (Fig. 1 C and D). The filled hydrogel tubes were then capped by depositing the same thickness of hydrogel on the top and bottom to seal the microworm (Fig. 1E). The AAO scaffold was then etched away with HCl and the individual microworms were freed by intense sonication. This method enables the creation of a coated microworm or tubular structure that can contain any polymer-based sensor or component that is soluble in any solvent that will not dissolve the hydrogel itself or etch in HCl.
Fig. 1.

Schematic of the microworm fabrication process. The bare AAO template (A) is first conformally coated with the iCVD hydrogel layer (B). The optode solution is filled in the pores of the template (C) and the excess optode and the hydrogel layer is etched away (D). A final hydrogel layer is deposited on both sides of the template to cap the optode (E). As the final step, the template is dipped in the HCl solution to etch the AAO template and release the microworms (F). (G and H) SEM images of the microworms in the dehydrated state. (I and J) TEM images of the microworms. The inner optode core and the outer hydrogel layers are visible. The hydrogel coating has a thickness of 50 ± 10 nm. (K) Confocal images of control sensors without hydrogel coating. Large piece of template, that is not completely etched, containing spots of hydrophobic optode is shown. Fluorescence (Upper Left), bright field (Upper Right), and overlay (Lower Left) are shown. (L) Confocal image of microworms. Shown are the brightfield (Left) and fluorescent (Right) images of microworms with scale bar.
SEM images of the microworms after etching but prior to sonication separation are shown in Fig. 1 F and G. The AAO template has 200-nm-diameter pores. The hydrogel deposition was run to an average thickness of 50 nm leaving 100-nm-diameter pores in the hydrogel tubular structure; the pore diameter can be seen in unfilled hydrogel tubes. Furthermore, the hydrogel deposition also filled in the AAO template pores completely. The conformal deposition inside the pores of the AAO templates was achieved by tuning the deposition parameters to keep the ratio of the monomer partial pressure (Pm) to monomer saturation pressure (Psat) low (26, 27). Although temperature of the AAO template is difficult to control, by maintaining low reactor pressures, low Pm/Psat values of 0.1–0.3 can be achieved which improves the conformality. Transmission electron microscopy (TEM) images of single microworms in the dehydrated state confirm that the optode fills the hydrogel tubes (Fig. 1 H and I). The darker core is the optode, whereas the lighter outer shell is the hydrogel coating. The dimensions of the microworms were roughly 40-μm long and 200 nm in diameter. The outer shell is comprised solely of hydrogel and the inner core is optode. The cylindrical shape of the optode in the hydrogel tube indicates that the THF evaporation occurred at the open ends of the hydrogel tubes allowing the optode to gel inside. This evaporation process also explains the difference between the 40-μm length of the microworms and the 60-μm length of the AAO template. The 33% reduction in length is due to optode shrinkage from THF evaporation and hydrogel tube capping that fills the tube down to the boundary of the optode. The stability of the hydrogel tube without optode filling breaks down after AAO etching and sonication separation.
Coating the optode sensors with a conformal polymer layer is necessary to prevent the shape deformation or the agglomeration of the optode sensors in aqueous solution. Fig. 1K shows the fluorescence microscopy images of the optode sensors without any hydrogel coating. As seen in the image, the sensors are in circular shapes after rolling up and agglomerating without the coating. The strong fluorescence signal from the microworms indicates that the outer hydrogel layer does not affect the fluorescence of the optode. Furthermore, the complete filling of the pores with the optode (Fig. 2C) confirms the tubular shaped scaffold and complete filling of the optode during microworm formation. If any of the AAO template channels do not fill with the optode, they will produce hollow tubes with one open end because the capping deposition will plug the bottom side during the initial capping.
Fig. 2.

Response of microworms and nanosensors to sodium. Normalized fluorescent intensity α is plotted against the log of the sodium concentration for microworms (♦) and nanosensors (▪). Shown is the average with standard deviation for three measurements. Kd values are obtained by fitting the data to a sigmoidal function and values of 82 and 97 mM are obtained for nanosensors and microworms, respectively.
The mechanism of the optode is dependent on sodium extraction into the microworm through the hydrogel. In the aqueous medium, the hydrogel coating may swell up to 150% (23, 24), which may alter mesh size and interaction of the aqueous environment with the optode. Mesh size of the polymer, ξ, can be calculated using 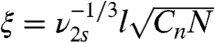 where ν2s is the volume fraction of the swollen polymer, l is the length of the C–C bond (0.154 nm), N is the number of repeat units between the cross-links, and Cn is the characteristic ratio (28). N can be found from the cross-link density (23) which is 6.25, ν2s is 0.22, and Cn is assumed to be 8.5. The mesh size is therefore 1.86 nm in this case which will allow diffusion of sodium ions but prevent fouling of larger molecules.
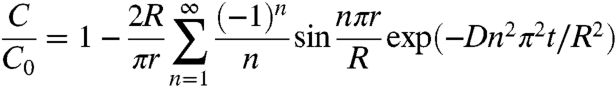
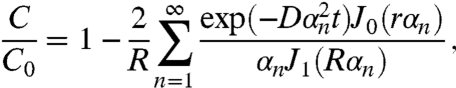
To be a continuous monitoring device, the response time of the microworms needs to be fast. The response time of the sensor is completely dependent on diffusion within the optode and decreases below seconds as the size decreases to microns (3). Theoretical response times of the nanosensors and the microworms can be estimated by solving the diffusion equation for a sphere (29)
 |
[1] |
and a rod (29)
 |
[2] |
where D is the diffusion coefficient, J0 and J1 are the Bessel’s functions of zeroth and first order, and αn are the roots of the Bessel function. C0 represents the concentration of the analyte in the medium and C is the concentration at a given time and position inside the sensor. Response rates of the nanosensors and the microworms can be compared by determining the time for each sensor to reach C/C0 = 0.99. Using Eqs. 1 and 2, the response times tsphere and tcylinder are then calculated as 0.07 and 0.11 s, respectively, for a radius Rs of 100 nm. The similar response times obtained for nanosensors and the microworms confirm that the cylindrical shapes of the microworms do not significantly change the response times.
The response mechanism of the sensors to sodium has been previously explained (3). Briefly, the optode consists of a plasticized polymer that creates a hydrophobic environment in which a pH sensitive fluorophore, an ionophore specific for sodium, and a charge neutrality molecule are contained. Selective uptake into the optode by the ionophore brings a positive charge into the polymer resulting in a loss of a hydrogen ion to balance the charge. This hydrogen ion loss changes the protonation state of the fluorophore and thus the optical properties of the optode. The optical response of nanosensors and microworms to sodium was determined with a plate reader. The intensity of a given sodium concentration was normalized according to α = (Imax - I[Na+])(Imax - Imin), where Imax is the intensity of the nanosensors or the microworms at zero sodium, Imin is the intensity at 500 mM sodium, and I[Na+] is the intensity at the concentration of interest. The response data, α, was plotted against the log of the sodium concentration, in millimolar, with the log of zero sodium set to -1 for curve fit analysis. The response data for both the microworms and the nanosensors are shown in Fig. 2. Sigmoidal curves are fit (Origin) to the data and using the software the Kd is calculated as 82 mM for the nanosensors and 97 mM for the microworms. This Kd is satisfactory within resting interstitial sodium concentration, which is roughly 130 mM. Considering the error bars in response (Fig. 2), the difference in the Kd values is insignificant, indicating that the response of the microworms are the same as the nanosensors.
For continuous in vivo monitoring, the diffusion of the sensors should be minimized. The diffusion coefficient, D, can be calculated using the Stokes–Einstein equation D = kT/(6πηRh), where k is Boltzmann’s constant and η is the viscosity of water. The hydration radius (Rh) of the microworms can be found from the radius of gyration (Rg) (30), here Rg = 1.732Rh. The Rg of a cylinder depends on the length and radius [Rg = (L2/12 + r2/2)1/2], where L is the length and r is the radius. For aspect ratios (L/r)≫1 the radius of the microworm contributes little to Rg and can be ignored in this case because L/r = 400. For a length of 40 μm and a radius of 100 nm, the Rh of the microworm is 6.67 μm. The surface-area-to-volume ratio of the microworm is 20 μm-1, whereas the surface-area-to-volume ratio of a sphere with an Rh of 6.67 μm is 0.45 μm-1, shown in Fig. 3A. At smaller effective Rh, the surface-area-to-volume ratio is actually greater for spheres. However, once the effective Rh is above 150 nm, the microworm structure provides an improved surface-to-volume ratio.
Fig. 3.

(A) The surface-area-to-volume ratio of microworms (black) and nanosensors (red) are plotted as a function of the diffusion constant, and thus hydrodynamic radius. Shown are the theoretical values for the sizes used here for microworms (blue line) and nanosensors (blue dot), as well as the experimentally measured diffusion coefficient values, green line and green dot for microworms and nanosensors, respectively. (B) Normalized fluorescent intensity of injected spots over time of microworms (blue) and nanosensors (red). Shown is the average with standard deviation for three spots of each type of particle. The decrease in the nanosensor fluorescence intensity is due to the diffusion of the nanosensors away from the injection site. Over a time range of 1 h, no significant diffusion of the microworms is observed. (C) In vivo demonstration of microworm sensors for sodium sensing. Microworms are subcutaneously located in the two injection spots on the left side of each mouse. Nanosensors are subcutaneously located in the two injection spots on the right side of each mouse. Each mouse is separated by a green bar to indicate that there were two different imaging conditions, I and II, for the two types of sensors to limit image saturation. The increased background in imaging condition I is due to the longer exposure times used to image the microworms. This method enabled imaging of both types of sensors in the presence of the autofluorescent noise.
For microworms of length 40 μm, the theoretical diffusion coefficient 30 °C was 4.1 × 10⁻¹⁴ m2/s. The theoretical diffusion coefficient 30 °C of the spherical nanosensors with a diameter of 272 nm was 2.0 × 10⁻¹² m2/s. These are shown in Fig. 3A as a blue line and a blue circle. By matching the diameter of the nanosphere to that of the microworm, the response times to sodium will be similar for both shapes. For the given geometrical structure and dimensions, the diffusion coefficient of the microworms is calculated to be approximately 50 times smaller than that of the nanosensors. The experimental values of the diffusion coefficients were measured by dynamic light scattering (DLS) experiments and are shown as a green line and green circle in Fig. 3A. The average diffusion coefficient of the microworms at 30 °C was 1.54 ± 0.33 × 10⁻¹³ m2/s. The spherical nanosensors of 271.6 ± 12.4-nm diameter, on the other hand, had an average diffusion coefficient of 1.699 ± 0.237 × 10⁻¹² m2/s at 30 °C—an order of magnitude larger than that of the microworms. The difference between the theoretical calculation and the DLS experiment results for the diffusion coefficient of the microworms might be related to the variations in the nanoworm sizes (polydispersity of 0.74 ± 0.2) or the bending or twisting of the microworms during diffusion which changes the hydrodynamic radius. Also, unfilled tubular scaffolds will have smaller sizes than the microworms and may not have been completely removed during microworm isolation, thus increasing the diffusion coefficient.
The theoretical advantages of the microworms were confirmed experimentally by subcutaneously injecting microworms and nanosensors in nude mice (Fig. 3B). The fluorescence efficiency of the sensors were tracked over time. The fluorescence efficiency represents the total amount of fluorophore present and thus indicates that amount of sensor, either microworms or nanosensors, that are present in the region analyzed. This measurement therefore can be used to determine diffusion away from the spot of injection. The microworms show little diffusion away from the injection spot over the course of an hour, however, the nanosensors have significant diffusion as the efficiency decreases by roughly 60% (Fig. 3C). Experiments were stopped at 1 h as the decrease in fluorescence efficiency of the nanosensors leveled and therefore an accurate comparison of retention in the injection spot could be made. Each sensor is made of the same components and has similar responses with respect to sodium and photobleaching. Also, nude, immune-compromised mice were used to eliminate the possible effects of an immune reaction to the sensors. Previous experiments have shown that similar nanoparticles do not elicit a noticeable immune response of the same time period (1) and phagocytosis of particles with similar size and shape is not possible (31). Therefore, the difference in efficiency changes between the microworms and the nanosensors is solely due to diffusion of the sensors out of the injection spot. Sensor degradation via leaching was not considered because it has previously been shown that PEG-coated nanosensors will not leach components and are stable in solution for weeks (12). The diffusion properties of the microworms are better suited for measurement conditions over the course of 1 h. At this smaller diffusion rate, the microworm geometry has a much larger surface-area-to-volume ratio that allows for rapid responses to changes in the sodium concentration. Therefore, the microworms developed here have a more ideal geometry than spheres for use of in vivo monitoring.
Incorporating the sodium optode into the microworm sensor prevented diffusion of the sensor away from the spot of subcutaneous injection. Furthermore, the microworm shape and coating did not prevent optode interaction with the surrounding environment. Microworms present a biocompatible mechanism to immobilize polymer sensing material in vivo for continuous monitoring. This technology can be extended to immobilize any polymer with the capacity of adjusting the hydrogel coverage or cross-linking density to alter medium interaction.
Experimental Methods
Materials.
The monomer 2-hydroxyethyl methacrylate (HEMA, 99%, Aldrich), the cross-linker ethylene glycol diacrylate (EGDA, 98%, PolySciences), and the initiator tert-butyl peroxide (TBPO, 98%, Aldrich) were used as received. All chemicals used to prepare the optode were purchased from Sigma. The AAO membranes were purchased from Whatman, Inc. The pores of the membranes are 60 μm in length and 200 nm in diameter.
Sodium selective optode was created from the following compounds: 30 mg high molecular weight poly(vinyl chloride); 60 mg bis-2(ethylhexyl)-sebacate; 3 mg sodium ionophore X; 0.5 mg chromoionophore III; and 0.4 mg of sodium tetrakis[3,5-bis(trifluoromethyl)phenyl]borate. These components were brought up in 500 μL of THF.
Initiated CVD system.
Initiated CVD depositions were performed in a custom-built high-vacuum reactor with a base pressure of 10-4 torr. The monomer vapors were delivered to the reactor using needle valves, whereas mass flow controllers were used to deliver nitrogen gas (N2) and the initiator. The initiator molecules were thermally decomposed by a heated filament array that consists of 14 parallel ChromAlloy filaments (Goodfellow) that were placed 2 cm above the sample. The sample temperature was controlled by backstage cooling using a chiller and heater (Neslab, Thermo Scientific).
Polymer Coating Deposition.
The biocompatible hydrogel film, cross-linked p(HEMA), was deposited using iCVD. The flow rates of HEMA, EGDA, TBPO, and N2 used were 0.6, 0.15, 1, and 1 sccm, respectively. During depositions, the reactor pressure was kept at 200 m torr. The filament and the substrate temperatures were maintained at 215 and 30 °C, respectively.
Nanosensor Fabrication.
Nanosensors were prepared as previously described (12). Briefly, optode was diluted 50% with dichloromethane and added dropwise to 4 mL of aqueous solution, either PBS or 10 mM Hepes, containing 1,2-diacyl-sn-glycero-3-phosphoethanolamine-N-[methoxy(polyethyleneglycol)-550] (Avanti Polar Lipids). The solution was then mixed with a probe tip sonicator to form nanosensors (Branson).
Fabrication of Microworms.
For the fabrication of the microworms, AAO templates were first conformally coated with p(HEMA-co-EGDA) hydrogel with a wall thickness of approximately 50 ± 10 nm. The pores of the coated AAO templates were then filled with the optode solution. Optode was first diluted in 1 mL of THF in a glass dish inside a chamber with a THF bath to prevent rapid evaporation of THF in the optode solution. The coated AAO templates were placed facing down in the glass dish and allowed to float on the optode for 1–2 min. The AAO templates were then washed in a THF bath to rinse excess optode, inverted, and allowed to dry while resting on two glass micropipettes. Both sides of the templates were then iCVD coated with hydrogel to cap the ends of the tubes. As the final stage, the templates were etched in HCl and the microworms were released.
To prepare the microworms for tests, they were suspended in 2 mL of water. This solution was sonicated using a probe tip sonicator (Branson) for 1 min, four times. The solution was then transferred to microcentrifuge tubes and spun at 500 rpm for 5 min. The supernatant was removed and mixed 1∶1 with PBS or HEPES buffer. This solution was then spun at 10,000 rpm for 30 min. The supernatant was then removed and discarded and the remaining pellet was brought up in PBS or Hepes buffer and resuspended.
For the preparation of the control samples, the pores of the AAO templates with no iCVD coating were filled with the optode solution the same way as described for the microworms. After the optode inside the pores was dried, the AAO templates were etched in HCl solution to release the cylindrical sensors without polymer coating.
Chemical Analysis.
The compositional analysis of the deposited hydrogel layer was performed by Nexus 870 FTIR (Thermo Nicolet) equipped with a deuterated triglycine sulfate and thermoelectricity cooled detector. The analysis was done on the polymer films deposited on silicon. The spectra were acquired at 4 cm-1 resolution and the number of scans was kept at 128. The cross-link density, R, of the hydrogel layer was calculated using the relation (32)
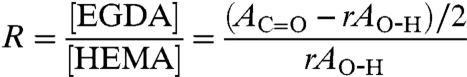 |
where AC=O and AO-H are the FTIR peak areas of the C = O stretching and O-H regions, respectively, for the copolymer films. The ratio r is of peak areas AC=O to AO-H for the linear p(HEMA) film. For the deposition parameters used in this study, the cross-linking density was calculated to be 0.19.
Imaging.
The fabricated microworms were imaged with a field emission gun SEM (JEOL J5M-6700F) instrument. The TEM analysis was performed with an FEI Tecnai F20. Confocal images were recorded on a Zeiss 510 meta confocal microscope. Microworms were imaged using a 633-nm He–Ne laser with emission at 680 ± 10 nm using a 63× 1.4 N.A. oil immersion objective.
Size Analysis.
Size measurements of nanoparticles and microworms were performed using dynamic light scattering (Zetasizer, Nano Series ZS90, Malvern Instruments). Measurements were made in triplicate at temperatures ranging from 15 to 35 °C at 5° increments.
Sensor Response.
Calibration was performed by diluting the 100 μL of microworms or nanosensors in 100 μL of 10 mM Hepes solution pH 7.4 with sodium chloride concentrations ranging from 0 to 1 M. The solutions were loaded into an optical bottom 96-well plate (VWR) in triplicate per sodium concentration. The fluorescence was read in a plate reader exciting at 633 nm and collecting emission at 680 nm (Spectramax Gemini EM, Molecular Devices).
In Vivo Measurements.
Microworm and nanosensor diffusion measurements were performed in nude, immune-compromised CD-1 mice (Charles River Labs). All animal procedures are approved by the Institutional Animal Care and Use Committee of Tufts University Medical School, Boston, MA. Mice were anesthetized using Isofluorane. Twenty microliters of microworms or nanosensors in PBS solution were injected subcutaneously in the back of each mouse in multiple spots. The mice were then imaged using an IVIS 200 (Caliper Life Sciences). Brightfield and fluorescent images were taken at 5 min intervals for 60 min. Fluorescent images were acquired using the Cy5 filter settings. Two imaging conditions were used for fluorescent images, one for the microworms and one for the nanosensors. These images were taking back to back and therefore have the same time points. The conditions were changed between the two sensors to ensure that each sensor was producing similar fluorescent intensities compared to the other without saturating the image. Both types of sensors were exposed to both imaging conditions to prevent the effects of photobleaching causing differences in fluorescence efficiency. Regions of interest were analyzed using total efficiency and were background subtracted.
Acknowledgments.
We thank Gary Sahagian at Tufts University Medical Center for his assistance with animal imaging. We thank the US Army through the Institute for Soldier Nanotechnologies, under Contract DAAD-19-02-D-0002 with the US Army Research Office, for financial support for this work. This work was also funded by National Institutes of Health Grant R01GM084366 (to H.A.C.). J.M.D. is supported by the Integrative Graduate Education and Research Traineeship Nanomedicine Science and Technology program at Northeastern University (funding from National Cancer Institute and National Science Foundation Grant DGE- 0504331).
Footnotes
The authors declare no conflict of interest.
This article is a PNAS Direct Submission.
References
- 1.Billingsley K, et al. Fluorescent nano-optodes for glucose detection. Anal Chem. 2010;82:3707–3713. doi: 10.1021/ac100042e. [DOI] [PMC free article] [PubMed] [Google Scholar]
- 2.Dubach JM, Lim E, Zhang N, Francis KP, Clark H. In vivo sodium concentration continuously monitored with fluorescent sensors. Integr Biol. 2010 doi: 10.1039/c0ib00020e. 10.1039/C0IB00020E. [DOI] [PubMed] [Google Scholar]
- 3.Bakker E, Bühlmann P, Pretsch E. Carrier-based ion-selective electrodes and bulk optodes. 1. General characteristics. Chem Rev. 1997;97:3083–3132. doi: 10.1021/cr940394a. [DOI] [PubMed] [Google Scholar]
- 4.Wolfbeis OS. Sensor paints. Adv Mater. 2008;20:3759–3763. [Google Scholar]
- 5.Shortreed M, Bakker E, Kopelman R. Miniature sodium-selective ion-exchange optode with fluorescent pH chromoionophores and tunable dynamic range. Anal Chem. 1996;68:2656–2662. doi: 10.1021/ac960035a. [DOI] [PubMed] [Google Scholar]
- 6.Watts AS, Urbas AA, Finley T, Gavalas VG, Bachas LG. Decyl methacrylate-based microspot optodes. Anal Chem. 2006;78:524–529. doi: 10.1021/ac051652e. [DOI] [PubMed] [Google Scholar]
- 7.Clark HA, et al. Subcellular optochemical nanobiosensors: probes encapsulated by biologically localised embedding (PEBBLEs) Sens Actuators, B. 1998;51:12–16. [Google Scholar]
- 8.Clark HA, Hoyer M, Philbert MA, Kopelman R. Optical nanosensors for chemical analysis inside single living cells. 1. Fabrication, characterization, and methods for intracellular delivery of PEBBLE sensors. Anal Chem. 1999;71:4831–4836. doi: 10.1021/ac990629o. [DOI] [PubMed] [Google Scholar]
- 9.Brasuel M, Kopelman R, Miller TJ, Tjalkens R, Philbert MA. Fluorescent nanosensors for intracellular chemical analysis: Decyl methacrylate liquid polymer matrix and ion-exchange-based potassium PEBBLE sensors with real-time application to viable rat C6 glioma cells. Anal Chem. 2001;73:2221–2228. doi: 10.1021/ac0012041. [DOI] [PubMed] [Google Scholar]
- 10.Brasuel MG, Miller TJ, Kopelman R, Philbert MA. Liquid polymer nano-PEBBLEs for Cl2 analysis and biological applications. Analyst. 2003;128:1262–1267. doi: 10.1039/b305254k. [DOI] [PubMed] [Google Scholar]
- 11.Dubach JM, Das S, Rosenzweig A, Clark HA. Visualizing sodium dynamics in isolated cardiomyocytes using fluorescent nanosensors. Proc Natl Acad Sci USA. 2009;106:16145–16150. doi: 10.1073/pnas.0905909106. [DOI] [PMC free article] [PubMed] [Google Scholar]
- 12.Dubach JM, Harjes DI, Clark HA. Fluorescent ion-selective nanosensors for intracellular analysis with improved lifetime and size. Nano Lett. 2007;7:1827–1831. doi: 10.1021/nl0707860. [DOI] [PubMed] [Google Scholar]
- 13.Adrogue HJ, Madias NE. Hypernatremia. N Engl J Med. 2000;342:1493–1499. doi: 10.1056/NEJM200005183422006. [DOI] [PubMed] [Google Scholar]
- 14.Adrogue HJ, Madias NE. Hyponatremia. N Engl J Med. 2000;342:1581–1589. doi: 10.1056/NEJM200005253422107. [DOI] [PubMed] [Google Scholar]
- 15.Benvenga S. What is the pathogenesis of hyponatremia after subarachnoid hemorrhage? Nat Clin Pract Endocrinol Metab. 2006;2:608–609. doi: 10.1038/ncpendmet0302. [DOI] [PubMed] [Google Scholar]
- 16.Ellison DH, Berl T. Clinical practice. The syndrome of inappropriate antidiuresis. N Engl J Med. 2007;356:2064–2072. doi: 10.1056/NEJMcp066837. [DOI] [PubMed] [Google Scholar]
- 17.Gratton SE, et al. The effect of particle design on cellular internalization pathways. Proc Natl Acad Sci USA. 2008;105:11613–11618. doi: 10.1073/pnas.0801763105. [DOI] [PMC free article] [PubMed] [Google Scholar]
- 18.Champion JA, Mitragotri S. Role of target geometry in phagocytosis. Proc Natl Acad Sci USA. 2006;103:4930–4934. doi: 10.1073/pnas.0600997103. [DOI] [PMC free article] [PubMed] [Google Scholar]
- 19.Mitragotri S, Lahann J. Physical approaches to biomaterial design. Nat Mater. 2009;8:15–23. doi: 10.1038/nmat2344. [DOI] [PMC free article] [PubMed] [Google Scholar]
- 20.Whitesides GM. The ‘right’ size in nanobiotechnology. Nat Biotechnol. 2003;21:1161–1165. doi: 10.1038/nbt872. [DOI] [PubMed] [Google Scholar]
- 21.Lewis HGP, Caulfield JA, Gleason KK. Perfluorooctane sulfonyl fluoride as an initiator in hot-filament chemical vapor deposition of fluorocarbon thin films. Langmuir. 2001;17:7652–7655. [Google Scholar]
- 22.Tenhaeff WE, Gleason KK. Initiated and oxidative chemical vapor deposition of polymeric thin films: iCVD and oCVD. Adv Funct Mater. 2008;18:979–992. [Google Scholar]
- 23.Ince GO, Demirel G, Gleason KK, Demirel MC. Highly swellable free-standing hydrogel nanotube forests. Soft Matter. 2010;6:1635–1639. [Google Scholar]
- 24.Baxamusa SH, et al. Protection of sensors for biological applications by photoinitiated chemical vapor deposition of hydrogel thin films. Biomacromolecules. 2008;9:2857–2862. doi: 10.1021/bm800632d. [DOI] [PubMed] [Google Scholar]
- 25.Ratner BD, Bryant SJ. Biomaterials: Where we have been and where we are going. Annu Rev Biomed Eng. 2004;6:41–75. doi: 10.1146/annurev.bioeng.6.040803.140027. [DOI] [PubMed] [Google Scholar]
- 26.Ozaydin-Ince G, Gleason KK. Tunable conformality of polymer coatings on high aspect ratio features. Chem Vap Deposition. 2010;16:100–105. [Google Scholar]
- 27.Baxamusa SH, Gleason KK. Thin polymer films with high step coverage in microtrenches by initiated CVD. Chem Vap Deposition. 2008;14:313–318. [Google Scholar]
- 28.Tenhaeff WE, Gleason KK. Surface-tethered pH-responsive hydrogel thin films as size-selective layers on nanoporous asymmetric membranes. Chem Mater. 2009;21:4323–4331. [Google Scholar]
- 29.Crank J. The Mathematics of Diffusion. New York: Oxford Univ Press; 2004. pp. 69–104. [Google Scholar]
- 30.Ruggiero A, et al. Paradoxical glomerular filtration of carbon nanotubes. Proc Natl Acad Sci USA. 2010;107:12369–12374. doi: 10.1073/pnas.0913667107. [DOI] [PMC free article] [PubMed] [Google Scholar]
- 31.Geng Y, et al. Shape effects of filaments versus spherical particles in flow and drug delivery. Nat Nanotechnol. 2007;2:249–255. doi: 10.1038/nnano.2007.70. [DOI] [PMC free article] [PubMed] [Google Scholar]
- 32.Chan K, Gleason KK. Initiated chemical vapor deposition of linear and cross-linked poly(2-hydroxyethyl methacrylate) for use as thin-film hydrogels. Langmuir. 2005;21:8930–8939. doi: 10.1021/la051004q. [DOI] [PubMed] [Google Scholar]