Abstract
The association of a particular mitochondrial DNA (mtDNA) mutation with different clinical phenotypes is a well-known feature of mitochondrial diseases. A simple genotype–phenotype correlation has not been found between mutation load and disease expression. Tissue and intercellular mosaicism as well as mtDNA copy number are thought to be responsible for the different clinical phenotypes. As disease expression of mitochondrial tRNA mutations is mostly in postmitotic tissues, studies to elucidate disease mechanisms need to be performed on patient material. Heteroplasmy quantitation and copy number estimation using small patient biopsy samples has not been reported before, mainly due to technical restrictions. In order to resolve this problem, we have developed a robust assay that utilizes Molecular Beacons to accurately quantify heteroplasmy levels and determine mtDNA copy number in small samples carrying the A8344G tRNALys mutation. It provides the methodological basis to investigate the role of heteroplasmy and mtDNA copy number in determining the clinical phenotypes.
INTRODUCTION
In the past decade mitochondrial genome variation has been recognized as a contributor to human disease. More than 50 pathogenic mitochondrial DNA (mtDNA) mutations have been described so far. The majority of these mutations are single base changes that occur in tRNA genes (1). Maternal inheritance is a specific feature of mtDNA (2) and diseases associated with point mutations in mtDNA are involved in several, predominantly neuromuscular diseases. They are also thought to play a role in aging due to the accumulation of mtDNA damage as a consequence of a low efficiency repair system and absence of protective proteins such as histones (3).
The influence of many pathogenic mtDNA mutations on mitochondrial transcription, protein synthesis and oxidative phosphorylation has been described (4,5) and is still the subject of intensive study (6–8). A well-studied example is the A8344G tRNALys mutation that causes Myoclonus Epilepsy and Ragged-Red Fibers (MERRF) syndrome (9–11). This disorder represents an encephalomyopathy characterized by myoclonic and tonic-clonic seizures, ataxia, dementia, muscle weakness and mitochondrial abnormalities in skeletal muscle. The same A8344G mutation is found in multiple, symmetric lipomas as the only manifestation of the mutation in non-symptomatic relatives of MERRF patients (12).
The association of a particular mtDNA mutation with different clinical phenotypes is also seen for other mutations. For example, the A3243G tRNALeu mutation leads in some individuals to the mitochondrial myopathy, encephalopathy, lactic acidosis and stroke-like episode syndrome (MELAS) (13), and in others to the maternally-inherited diabetes and deafness syndrome (MIDD) (14) or to progressive kidney disease (15).
A characteristic feature of the A8344G tRNALys and other pathogenic mutations is that tissues harbor a mixture of mutant and wild-type mtDNA, a phenomenon referred as heteroplasmy. Different tissues of a patient often show different levels of heteroplasmy. This variability in heteroplasmy has been suggested to be fundamental to the diversity of clinical presentation of a particular mutant. Cellular mosaicism (i.e. heterogeneous distribution of heteroplasmy) may be an additional factor involved in the variable clinical expression (16–18).
Furthermore, the mitochondrial copy number may contribute to the clinical expression. Studies with cybrid cell lines clearly illustrated that, in addition to the level of heteroplasmy, the mtDNA copy number is a limiting factor in cell respiration and consequently influences the phenotype (19).
For the understanding of the patho-biochemistry of mitochondrial diseases it is therefore essential to have a method to quantify heteroplasmy levels in tissues, in small groups of cells or in single cells.
In this study we have developed an alternative, PCR-based assay for heteroplasmy quantification of the A8344G tRNALys mutation in tissue samples that uses two differently labeled (mutant and wild-type) Molecular Beacon probes for real-time fluorescence monitoring of PCR. In addition we show that by applying a Molecular Beacon-PCR for the β-globin gene, a mitochondrial genome quantitation relative to the nuclear genome copy number can be achieved. Molecular Beacons are well suited for this purpose because they are fluorogenic, permit multiplexing and have great discriminatory power for single base mismatches due to the stem–loop structure of the molecule (20).
MATERIALS AND METHODS
Patient and cell line DNAs
The DNA samples derived from 10 carriers of the A8344G mutation with or without clinical manifestation of MERRF syndrome. From each individual one tissue sample was analyzed (lymphocytes, muscle biopsy or lipoma). DNA was extracted as described (21). The samples were selected to cover a wide range of mtDNA heteroplasmy with the A8344G mutation. The restriction fragment length polymorphism (RFLP)–PCR-based mutation analysis was done as described (22). Briefly, a 32P-labeled forward primer was added before the last PCR cycle. After restriction enzyme cleavage and electrophoresis the percentage of mutated to normal mtDNA was determined by a PhosphorImager as described (23). R1-C3 cells carrying the tRNALys mutation and R2-1A cells carrying the same mtDNA without the mutation (4) were used for assay development. Cell lines were cultured in Dulbecco’s modified Eagle’s medium containing 50 µg/ml uridine, supplemented with 10% fetal bovine serum. Total DNA was isolated from all cell lines using standard procedures (24). DNA samples from R2-1A and R1-C3 cell lines were mixed to simulate 5, 10, 25, 50, 75, 90 or 95% heteroplasmy at DNA concentrations of 2 ng/µl. To assess the sensitivity of PCR reactions, a series of DNA dilutions was prepared from R1-3C cell DNA (100 ng/µl to 0.1 pg/µl); 1 µl was used in each PCR reaction.
Molecular Beacon design
Molecular Beacon probes were designed following the guidelines described by Tyagi and Kramer (25) and in the related Web site (www.phri.nyu.edu/molecular_beacons). The intramolecular configuration of Molecular Beacons and the amplicon probing were modeled using the DNA Mfold program (www.ibc.wustl.edu/~zuker/dna/form1.shtml) that uses thermodynamic parameters established by SantaLucia (26). Molecular Beacons for the mutant and wild-type tRNALys did not contain self-complementary sequences of the tRNALys. Both Beacons were equipped with a 6 bp stem sequence. Melting temperatures of probe sequences were calculated using Primer! (Web site, http://www.williamstone.com). Candidate PCR primers and Molecular Beacons were checked for inter- and intramolecular interactions with the same software. Molecular Beacons were synthesized using standard phosphoramidite chemistry and purified by high performance liquid chromatography (HPLC). Briefly, Molecular Beacons were synthesized automatically with the 3′-DABCYL quencher linked to the solid phase support (DABCYL-CPG, Glen Research). Oligonucleotide chain elongation was run via standard cyanoethyl-phosphoramidite chemistry and fluorophores were covalently linked to the 5′-end via Iodoacetamide (Molecular Probes) or phosphoramidite derivatives (Glen Research) following release from the solid support. Molecular Beacons were purified twice by reverse-phase HPLC with a Waters 600E equipped with a Waters 996 Photodiode Array Detector for simultaneous detection at three different wavelengths. Ion-molecular weights of purified Molecular Beacons were determined by mass spectrometry using a Dynamo Time-Of-Flight instrument. The temperature at which there is no contribution of mutant Molecular Beacon to the fluorescence from wild-type target and of wild-type Molecular Beacon to mutant target was determined as described (25).
Primers and Molecular Beacon probes
Sequences of primers and Molecular Beacon probes are described in Table 1. β-Globin gene-specific primers (RS40/RS42) were described by Greer et al. (27).
Table 1. Sequences of amplification primers and Molecular Beacon probes.
| Primers |
Sequence |
| RS40 |
5′-TTTTCCCACCCTTAGGCTG-3′ |
| RS42 |
5′-CTCACTCAGTGTGGCAAAG-3′ |
| 47ex (8259–8281) |
5′-TTACCCTATAGCACCCCCTCTAC-3′ |
| 51ex (8396–8371) |
5′-TGGGCCATACGGTAGTATTTAGTTGG-3′ |
| Molecular Beacons |
|
| WT-594 (8334–8353) |
TET-5′-CCAGCG GATTAAGAGAACCAACACCT CGCTGG-3′-DABCYL |
| MT-593 (8334–8353) |
FAM-5′-CCAGCG GATTAAGAGAGCCAACACCT CGCTGG-3′-DABCYL |
| BG-736 |
FAM-5′-CCAGCG CTGTCCACTCCTGATGCTGTTAT CGCTGG-3′-DABCYL |
| Primer pair |
Predicted product size |
| RS40/RS42 |
198 bp |
| 47EX/51EX | 138 bp |
The underlined parts of Molecular Beacon sequences represent the stem and italic parts the loop sequences.
PCR conditions
Two-color Molecular Beacon PCR reactions were carried out in the presence of 1× PCR buffer (containing 15 mM Tris–HCl pH 8.0 and 50 mM KCl), 5 mM MgCl2, 200 µM of each deoxynucleotide-triphosphate (dATP, dCTP, dGTP, dTTP), 1 U of Amplitaq Gold DNA polymerase (all from Applied Biosystems), 250 nM of each primer, 200 nM of 6-carboxyfluorescein (FAM)-labeled mutant, 200 nM tetrahydrochloro-6-carboxyfluorescein (TET)-labeled wild-type Molecular Beacons and 1 µl of sample DNA in 50 µl final volume. Amplification reactions were performed in an ABI Prism 7700 spectrofluorometric thermal cycler (Applied Biosystems) with the following cycle conditions: 95°C denaturation and enzyme activation step for 10 min followed by 40 cycles of 95°C denaturation for 15 s, 59°C annealing for 30 s and 72°C elongation for 30 s. For the β-globin gene amplifications identical PCR conditions were used. Fluorescence spectra were recorded during the annealing phase of each PCR cycle. The Sequence Detection System software (SDS v1.7) of the ABI-Prism 7700 was used to generate the FAM and TET fluorescence intensity values.
Heteroplasmy quantification and threshold cycle determination
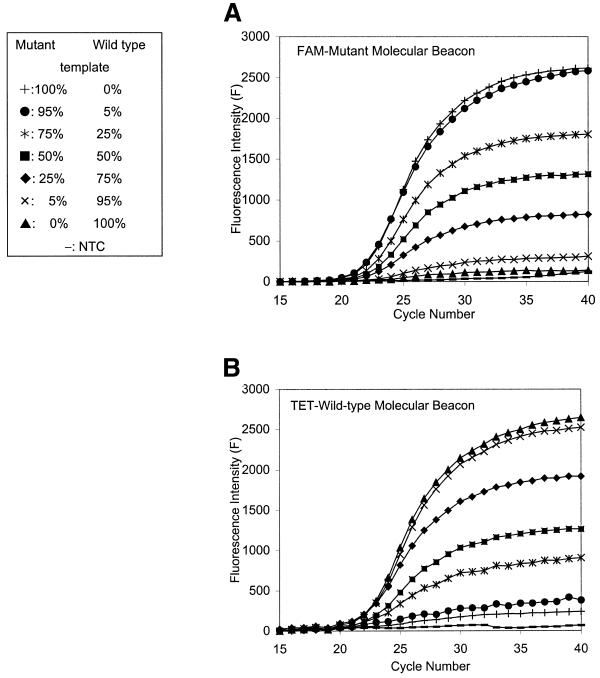
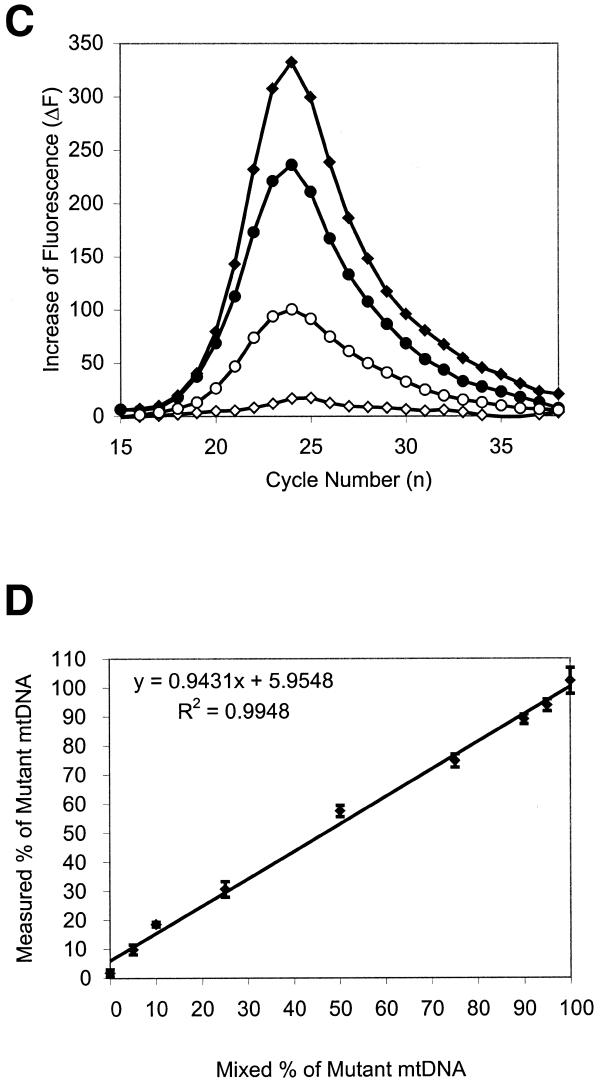
Since Molecular Beacons are reporting hybridization events of single-stranded DNA molecules, the integrated fluorescence intensities of each Molecular Beacon are proportional to the amount of cognate amplicons. To quantify the contribution of the mutant and wild-type sequence variants to the mtDNA PCR amplicons, fluorescence intensities of the differently labeled Molecular Beacons were integrated during the exponential phase of the PCR. In our experience, this phase comprises seven or more cycles (Fig. 1A and B). Thus integration was done over cycles nmax – 3 to nmax + 3, where nmax is the cycle number at which maximum amplification occurs. To objectively determine nmax, the first derivative of the amplification curve was taken. In cases where no amplification was obtained with one of the A8344G Molecular Beacons (homoplasmy), the interval of integration was defined by the interval determined with the responding Molecular Beacon, (Fig. 1C, open versus filled symbols).
Figure 1.
Calibration of heteroplasmy measurements. (A and B) Fluorescence intensities of the two A8344G Molecular Beacons at different heteroplasmy levels as a function of PCR cycle number. FAM and TET fluorescence intensities were measured simultaneously in each reaction vessels. (A) The FAM-labeled mutant; (B) the TET-labeled wild-type Molecular Beacon Measurements. (C) Determination of the exponential phase of the PCR reporting. In two selected examples the first derivatives of fluorescence intensities are plotted as a function of PCR cycle number from the measurements showed in (A) and (B). Diamonds, homoplasmic wild-type; circles, 25% mutant heteroplasmy. The FAM-mutant- and the TET-wild-type Molecular Beacon fluorescence data are indicated by open and filled symbols, respectively. The peaks represent nmax, and the integrals over nmax – 3 to nmax +3 were used to quantify percentages of heteroplasmy. (D) The calibration line obtained as demonstrated above for heteroplasmy quantitation. Bars indicate SDs of seven independent measurements.
Threshold cycle calculations
The threshold cycle number (Ct) was calculated with SDS software v1.7 (Applied Biosystems) and an automatic setting of the baseline. The baseline value was the average fluorescence value of PCR cycles 3–15 plus 10 times its standard deviation (SD). These values were used for the relative copy number calculations by expressing Ct differences of the β-globin and mtDNA PCR.
RESULTS
Quantification of heteroplasmy levels and sensitivity of PCR reactions
For heteroplasmy quantification, independent of input mtDNA copy number, the fluorescence intensities of the wild-type and mutant A8344G Molecular Beacons were integrated over seven cycles of the exponential phase of the PCR reaction. This approach was validated by analyzing DNA samples with known amounts of mutant and wild-type mtDNA (Fig. 1A and B). As can be seen in Figure 1D, there is a linear relationship between the measured level of heteroplasmy and the nominal input values. Only a small correction is necessary for determining heteroplasmy levels of test samples. An unequivocal detection of as little as 5% heteroplasmy was possible.
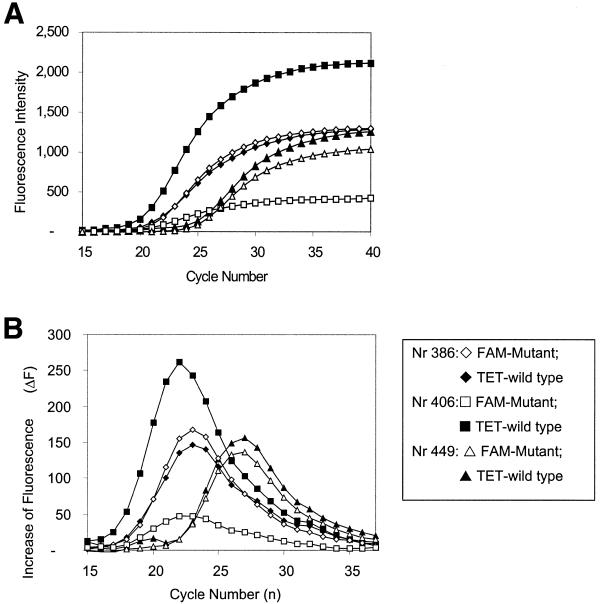
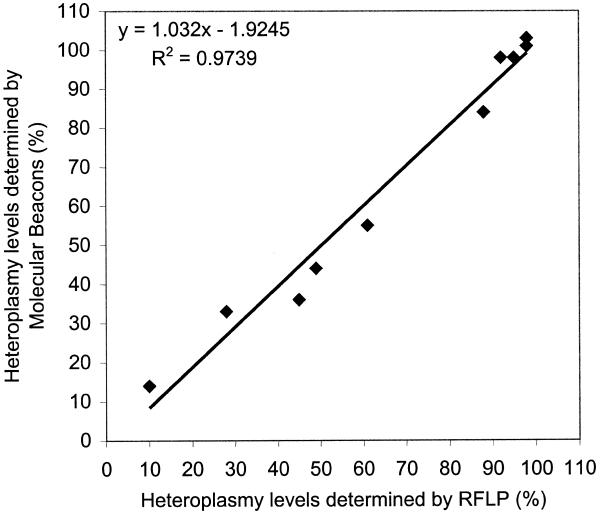
Subsequently, heteroplasmy levels were determined in a set of 10 DNA samples. Figure 2 shows Molecular Beacon PCR results for three of the 10 samples. As shown in Figure 3, a linear correlation exists between the heteroplasmy values determined with the Molecular Beacon PCR approach and by the classical RFLP method. Note that the Molecular Beacon-PCR data were determined from seven independent measurements (averaged SD = 4.22).
Figure 2.
Real time, duplex Molecular Beacon A8334G PCR of patient DNA samples. (A) The FAM-labeled mutant (open symbols) and the TET-labeled wild-type Molecular Beacon (filled symbols) amplification patterns are displayed simultaneously. (B) The first derivatives of the amplification curves. Differences in curve height indicate the heteroplasmy differences, while the relative position to the PCR cycle number reflects the differences in mtDNA copy number. (Sample 386 and 449 derived from muscle and lymphocyte, respectively.)
Figure 3.
Correlation between heteroplasmy levels for the A8344G mutation determined by the Molecular Beacon PCR and RFLP methods, respectively. DNA from 10 individuals carrying A8344G mutation was subjected to analysis.
Also, the accuracy of heteroplasmy quantification using the ‘Ct approach’ was analyzed (28). For the ‘simulation’ experiment in Figure 1A, B and D, r2 of 0.834 and 0.9943 was found for the Ct and integration approach, respectively. Also, for the patient samples, RFLP-PCR data were compared with Molecular Beacon PCR, analyzed by the Ct and integration approach, resulting in r2 of 0.9294 and 0.9739, respectively.
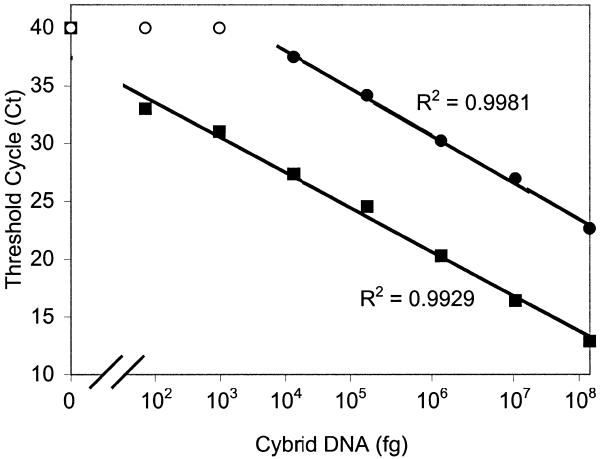
To be able to relate mitochondrial to nuclear genome copy number and to assess whether sensitivity of the heteroplasmy quantitation assay is at the single cell level, DNA was diluted 10-fold stepwise, and diluted samples were subjected to mitochondrial A8344G as well as to β-globin Molecular Beacon PCR. The β-globin Molecular Beacon PCR allowed reliable detection of the nuclear gene from as little as a single-cell equivalent of DNA. As expected, the mitochondrial tRNALys gene is readily amplified from even smaller amounts.
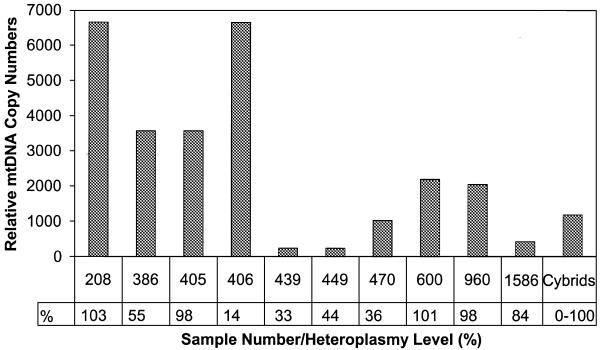
As can be seen in Figure 4 an inverse linear relationship was found between the Ct values and the logarithm of the input DNA. Moreover, the slopes for the mitochondrial tRNALys and the β-globin gene are similar, indicating that amplification efficiencies of these two different targets are identical. Consequently, Ct values can be used as a measure of the input copy number and Ct value differences used to quantify mtDNA copy number relative to the β-globin gene with the following equation: Rc = 2ΔCt (28), where Rc is the calculated relative copy number and ΔCt is the Ctglobin – CtmtDNA. The results are shown in Table 2. There appear to be large differences in relative mitochondrial copy number between the different samples. In accord with previous findings (29,30) the mtDNA copy number of the three lymphocyte samples (439, 449, 1586) showed the lowest values. Muscle samples were found to have high mtDNA copy numbers, except for sample number 470, which derived from a two and a half-year-old child, whereas the other samples were from teenagers or adults. No correlation was found between copy number and heteroplasmy level (Fig. 5).
Figure 4.
Sensitivity of the method to detect the A8344G mutation (squares) and β-globin (circles) gene by Molecular Beacon PCR. Filled symbols, Ct values determined by using a given input DNA; open symbols indicate that reported Molecular Beacon fluorescence did not reach the threshold levels at PCR cycle number 40.
Table 2. Mitochondrial copy number relative to β-globin gene content as determined from the Ct differences.
| Sample no. |
β-globin
Ct |
mtDNA Ct |
ΔCta |
Rcb |
Tissue type |
| 208 |
29.8 |
17.1 |
12.7 |
6650 |
Muscle |
| 386 |
32.2 |
20.4 |
11.8 |
3570 |
Muscle |
| 405 |
32.3 |
20.5 |
11.8 |
3570 |
Muscle |
| 406 |
32.6 |
19.9 |
12.7 |
6650 |
Muscle |
| 439 |
28.4 |
20.5 |
7.9 |
240 |
Lymphocyte |
| 449 |
31.4 |
23.5 |
7.9 |
240 |
Lymphocyte |
| 470 |
31.1 |
21.1 |
10.0 |
1020 |
Muscle |
| 600 |
30.5 |
19.4 |
11.1 |
2190 |
Lipoma |
| 960 |
32.5 |
21.5 |
11.0 |
2050 |
Muscle |
| 1586 |
29.0 |
20.3 |
8.7 |
420 |
Lymphocyte |
| MERRF cybridc | 30.99 ± 0.43 | 20.8 ± 0.34 | 10.2 | 1180 | 143B TK |
aΔCt = Ctglobin – CtmtDNA.
bRC, relative mtDNA copy number.
cAll cybrid mixtures used for the calibration curve (n = 9) were included for this Ct analysis.
Figure 5.
Relative mtDNA copy numbers from various tissues derived from the set of 10 samples of the A8344G mutation carriers and the mixes of the MERRF cybrid cell lines. Heteroplasmy levels, determined from the same samples are indicated.
DISCUSSION
The variations in clinical phenotypes of mitochondrial diseases are thought to be the result of variations in heteroplasmy levels in different tissues. When the proportion of the wild-type mitochondrial genome decreases below a certain level, cells become dysfunctional, a phenomenon known as the threshold effect. However, it has not been clarified whether the proportion of mutated mtDNA in a tissue is the only major factor for the phenotypic expression of the mutation. Cellular mosaicism (i.e. heterogeneous distribution of heteroplasmy) may be an additional factor involved in the variable clinical expression patterns (16,18). Also, mitochondrial copy number may be an influence on phenotypic expression (19). Increased mitochondrial proliferation is indeed characteristic of heteroplasmic mtDNA mutations involving tRNA genes as evidenced by the occurrence in affected muscle of ragged-red fibers, representing a subsarcolemmal accumulation of abnormal mitochondria. An increased mtDNA copy number relative to nuclear genome has also been suggested in patient samples with mtDNA mutations (31,32). Such increased proliferation might therefore be a compensatory mechanism in heteroplasmic situations and may be held responsible for delayed clinical manifestations.
A recent mathematical simulation of heteroplasmy drift in postmitotic heteroplasmic cells illustrated how increased mtDNA replication can cause drift in heteroplasmy. Interestingly, considerable intercellular variation in heteroplasmy drift and delay in fixation of the mutant allele was found (33).
It is evident from the above considerations that simultaneous quantitation of the heteroplasmy level and mtDNA copy number in small groups of cells or single cells is essential for understanding mitochondrial disease mechanisms. The present methodologies are unable to address this problem. Bicolor in situ hybridization, similar to that described for Pearson’s syndrome with large-scale mtDNA deletion (17), would have the requisite spatial resolution but lacks the specificity and sensitivity for single base mismatch detection as needed for the majority of mtDNA mutations. In order to address the problem of mtDNA copy number changes caused by a heteroplasmy drift in patient samples an assay with low material demand is needed. The currently available assays for these are a Southern blot-based copy number determination and a PCR amplification followed by RFLP analysis. Southern blotting has a high material demand and both assays are tedious.
Here we developed a homogeneous PCR assay that uses Molecular Beacons in a duplex format to quantify point mutated and wild-type mitochondrial amplicons in the annealing phase of the PCR cycle. Integration of Molecular Beacon fluorescence over the exponential phase is used to accurately determine heteroplasmy leveles as low as 5%. The integration approach uses an objective determination of the cycle at which maximum amplification occurs and integrates over multiple PCR cycles. In practice, seven cycles are used to determine the contribution of the two different sequence variants to the amplicons. This is in contrast with Ct determination, which yields a single data point, the determination of which is noise-sensitive particularly at low levels of heteroplasmy.
The sensitivity of the assay for quantitative heteroplasmy determination is at the single-cell level. Furthermore, the ratio of mtDNA over nuclear genome copy number can be determined accurately by Molecular Beacon analysis of a separately amplified β-globin gene. With a set of 10 DNA samples selected for varying heteroplasmy levels, the Molecular Beacon PCR method showed a good correlation with the conventional RFLP method for heteroplasmy quantitation.
A relative low mtDNA copy number was found in tissue samples of lymphocyte origin, which is in accordance with previous findings (29). A higher but variable copy number was found between the different muscle biopsy samples. This variation was not correlated to the percentage of mutated mtDNA and obviously further studies with microdissection-based sampling including proper control samples are needed to establish the clinical relevance of mtDNA copy number assessment.
In conclusion, we have developed an alternative assay in which Molecular Beacons are used to quantify single base mismatches of the mitochondrial genome relative to the wild-type mtDNA genome in real-time under homogeneous conditions. In addition, a simultaneous determination of the mtDNA copy number is provided. Thus, in combination with microdissection, our approach provides the methodological basis for the study of heteroplasmy and mtDNA copy number in relation to clinical phenotypes.
Acknowledgments
ACKNOWLEDGEMENTS
The authors would like to thank Dr Giuseppe Attardi for the cybrid cells, Dr Ronald van Soest for initial assistance with the ABI-PRISM 7700, Dr Fred Kramer, Dr Sanjay Tyagi and Salvatore Marras for advice on Molecular Beacons.
References
- 1.Schon E.A., Bonilla,E. and DiMauro,S. (1997) Mitochondrial DNA mutations and pathogenesis. J. Bioenerg. Biomembr., 29, 131–149. [DOI] [PubMed] [Google Scholar]
- 2.Giles R.E., Blanc,H., Cann,H.M. and Wallace,D.C. (1980) Maternal inheritance of human mitochondrial DNA. Proc. Natl Acad. Sci. USA, 77, 6715–6719. [DOI] [PMC free article] [PubMed] [Google Scholar]
- 3.Corral-Debrinski M., Shoffner,J.M., Lott,M.T. and Wallace,D.C. (1992) Association of mitochondrial DNA damage with aging and coronary atherosclerotic heart disease. Mutat. Res., 275, 169–180. [DOI] [PubMed] [Google Scholar]
- 4.Chomyn A., Meola,G., Bresolin,N., Lai,S.T., Scarlato,G. and Attardi,G. (1991) In vitro genetic transfer of protein synthesis and respiration defects to mitochondrial DNA-less cells with myopathy-patient mitochondria. Mol. Cell. Biol., 11, 2236–2244. [DOI] [PMC free article] [PubMed] [Google Scholar]
- 5.King M.P., Koga,Y., Davidson,M. and Schon,E.A. (1992) Defects in mitochondrial protein synthesis and respiratory chain activity segregate with the tRNA (Leu(UUR)) mutation associated with mitochondrial myopathy, encephalopathy, lactic acidosis, and strokelike episodes. Mol. Cell. Biol., 12, 480–490. [DOI] [PMC free article] [PubMed] [Google Scholar]
- 6.Janssen G.M., Maassen,J.A. and van den Ouweland,J.M. (1999) The diabetes-associated 3243 mutation in the mitochondrial tRNA (Leu(UUR)) gene causes severe mitochondrial dysfunction without a strong decrease in protein synthesis rate. J. Biol. Chem., 274, 29744–29748. [DOI] [PubMed] [Google Scholar]
- 7.Yasukawa T., Suzuki,T., Ueda,T., Ohta,S. and Watanabe,K. (2000) Modification defect at anticodon wobble nucleotide of mitochondrial tRNAs (Leu)(UUR) with pathogenic mutations of mitochondrial myopathy, encephalopathy, lactic acidosis, and stroke-like episodes. J. Biol. Chem., 275, 4251–4257. [DOI] [PubMed] [Google Scholar]
- 8.Chomyn A., Enriquez,J.A., Micol,V., Fernandez-Silva,P. and Attardi,G. (2000) The mitochondrial myopathy, encephalopathy, lactic acidosis, and stroke- like episode syndrome-associated human mitochondrial tRNALeu(UUR) mutation causes aminoacylation deficiency and concomitant reduced association of mRNA with ribosomes. J. Biol. Chem., 275, 19198–19209. [DOI] [PubMed] [Google Scholar]
- 9.Wallace D.C., Zheng,X.X., Lott,M.T., Shoffner,J.M., Hodge,J.A., Kelley,R.I., Epstein,C.M. and Hopkins,L.C. (1988) Familial mitochondrial encephalomyopathy (MERRF): genetic, pathophysiological, and biochemical characterization of a mitochondrial DNA disease. Cell, 55, 601–610. [DOI] [PubMed] [Google Scholar]
- 10.Shoffner J.M., Lott,M.T., Lezza,A.M., Seibel,P., Ballinger,S.W. and Wallace,D.C. (1990) Myoclonic epilepsy and ragged-red fiber disease (MERRF) is associated with a mitochondrial DNA tRNA(Lys) mutation. Cell, 61, 931–937. [DOI] [PubMed] [Google Scholar]
- 11.Larsson N.G., Tulinius,M.H., Holme,E., Oldfors,A., Andersen,O., Wahlstrom,J. and Aasly,J. (1992) Segregation and manifestations of the mtDNA tRNA(Lys) A→G(8344) mutation of myoclonus epilepsy and ragged-red fibers (MERRF) syndrome. Am. J. Hum. Genet., 51, 1201–1212. [PMC free article] [PubMed] [Google Scholar]
- 12.Holme E., Larsson,N.G., Oldfors,A., Tulinius,M., Sahlin,P. and Stenman,G. (1993) Multiple symmetric lipomas with high levels of mtDNA with the tRNA(Lys) A→G(8344) mutation as the only manifestation of disease in a carrier of myoclonus epilepsy and ragged-red fibers (MERRF) syndrome. Am. J. Hum. Genet., 52, 551–556. [PMC free article] [PubMed] [Google Scholar]
- 13.Goto Y., Nonaka,I. and Horai,S. (1990) A mutation in the tRNA(Leu)(UUR) gene associated with the MELAS subgroup of mitochondrial encephalomyopathies. Nature, 348, 651–653. [DOI] [PubMed] [Google Scholar]
- 14.van den Ouweland J.M., Lemkes,H.H., Ruitenbeek,W., Sandkuijl,L.A., de Vijlder,M.F., Struyvenberg,P.A., van de Kamp,J.J. and Maassen,J.A. (1992) Mutation in mitochondrial tRNA(Leu)(UUR) gene in a large pedigree with maternally transmitted type II diabetes mellitus and deafness. Nature Genet., 1, 368–371. [DOI] [PubMed] [Google Scholar]
- 15.Jansen J.J., Maassen,J.A., van der Woude,F.J., Lemmink,H.A., van den Ouweland,J.M., t’ Hart,L.M., Smeets,H.J., Bruijn,J.A. and Lemkes,H.H. (1997) Mutation in mitochondrial tRNA(Leu(UUR)) gene associated with progressive kidney disease. J. Am. Soc. Nephrol., 8, 1118–1124. [DOI] [PubMed] [Google Scholar]
- 16.Macmillan C., Lach,B. and Shoubridge,E.A. (1993) Variable distribution of mutant mitochondrial DNAs (tRNA(Leu[3243])) in tissues of symptomatic relatives with MELAS: the role of mitotic segregation. Neurology, 43, 1586–1590. [DOI] [PubMed] [Google Scholar]
- 17.van de Corput M.P., van den Ouweland,J.M., Dirks,R.W., ‘t Hart,L.M., Bruining,G.J., Maassen,J.A. and Raap,A.K. (1997) Detection of mitochondrial DNA deletions in human skin fibroblasts of patients with Pearson’s syndrome by two-color fluorescence in situ hybridization. J. Histochem. Cytochem., 45, 55–61. [DOI] [PubMed] [Google Scholar]
- 18.Chinnery P.F., Howell,N., Lightowlers,R.N. and Turnbull,D.M. (1997) Molecular pathology of MELAS and MERRF. The relationship between mutation load and clinical phenotypes. Brain, 120, 1713–1721. [DOI] [PubMed] [Google Scholar]
- 19.Bentlage H.A. and Attardi,G. (1996) Relationship of genotype to phenotype in fibroblast-derived transmitochondrial cell lines carrying the 3243 mutation associated with the MELAS encephalomyopathy: shift towards mutant genotype and role of mtDNA copy number. Hum. Mol. Genet., 5, 197–205. [DOI] [PubMed] [Google Scholar]
- 20.Tyagi S., Bratu,D.P. and Kramer,F.R. (1998) Multicolor molecular beacons for allele discrimination. Nature Biotechnol., 16, 49–53. [DOI] [PubMed] [Google Scholar]
- 21.Larsson N.G., Holme,E., Kristiansson,B., Oldfors,A. and Tulinius,M. (1990) Progressive increase of the mutated mitochondrial DNA fraction in Kearns-Sayre syndrome. Pediatr. Res., 28, 131–136. [DOI] [PubMed] [Google Scholar]
- 22.Zeviani M., Amati,P., Bresolin,N., Antozzi,C., Piccolo,G., Toscano,A. and DiDonato,S. (1991) Rapid detection of the A→G(8344) mutation of mtDNA in Italian families with myoclonus epilepsy and ragged-red fibers (MERRF). Am. J. Hum. Genet., 48, 203–211. [PMC free article] [PubMed] [Google Scholar]
- 23.Traff J., Holme,E., Ekbom,K. and Nilsson,B.Y. (1995) Ekbom’s syndrome of photomyoclonus, cerebellar ataxia and cervical lipoma is associated with the tRNA(Lys) A8344G mutation in mitochondrial DNA. Acta Neurol. Scand., 92, 394–397. [DOI] [PubMed] [Google Scholar]
- 24.Sambrook J., Fritsch,E.F. and Maniatis,T. (1989) Molecular Cloning: A Laboratory Manual. Cold Spring Harbor Laboratory Press, Cold Spring Harbor, NY.
- 25.Tyagi S. and Kramer,F.R. (1996) Molecular beacons: probes that fluoresce upon hybridization. Nature Biotechnol., 14, 303–308. [DOI] [PubMed] [Google Scholar]
- 26.SantaLucia J.,Jr (1998) A unified view of polymer, dumbbell, and oligonucleotide DNA nearest- neighbor thermodynamics. Proc. Natl Acad. Sci. USA, 95, 1460–1465. [DOI] [PMC free article] [PubMed] [Google Scholar]
- 27.Greer C.E., Peterson,S.L., Kiviat,N.B. and Manos,M.M. (1991) PCR amplification from paraffin-embedded tissues. Effects of fixative and fixation time. Am. J. Clin. Pathol., 95, 117–124. [DOI] [PubMed] [Google Scholar]
- 28.Higuchi R., Fockler,C., Dollinger,G. and Watson,R. (1993) Kinetic PCR analysis: real-time monitoring of DNA amplification reactions. Biotechnology, 11, 1026–1030. [DOI] [PubMed] [Google Scholar]
- 29.Heerdt B.G. and Augenlicht,L.H. (1990) Changes in the number of mitochondrial genomes during human development. Exp. Cell Res., 186, 54–59. [DOI] [PubMed] [Google Scholar]
- 30.Zhang H., Cooney,D.A., Sreenath,A., Zhan,Q., Agbaria,R., Stowe,E.E., Fornace,A.J.,Jr and Johns,D.G. (1994) Quantitation of mitochondrial DNA in human lymphoblasts by a competitive polymerase chain reaction method: application to the study of inhibitors of mitochondrial DNA content. Mol. Pharmacol., 46, 1063–1069. [PubMed] [Google Scholar]
- 31.Tokunaga M., Mita,S., Sakuta,R., Nonaka,I. and Araki,S. (1993) Increased mitochondrial DNA in blood vessels and ragged-red fibers in mitochondrial myopathy, encephalopathy, lactic acidosis, and stroke- like episodes (MELAS). Ann. Neurol., 33, 275–280. [DOI] [PubMed] [Google Scholar]
- 32.Moslemi A.R., Tulinius,M., Holme,E. and Oldfors,A. (1998) Threshold expression of the tRNA(Lys) A8344G mutation in single muscle fibres. Neuromusc. Disord., 8, 345–349. [DOI] [PubMed] [Google Scholar]
- 33.Chinnery P.F. and Samuels,D.C. (1999) Relaxed replication of mtDNA: A model with implications for the expression of disease. Am. J. Hum. Genet., 64, 1158–1165. [DOI] [PMC free article] [PubMed] [Google Scholar]


