

Abstract
Capturing how a patient’s medical problems change over time is important for understanding the progression of a disease, its effects, and response to treatment. We describe two prototype tools that are being developed as part of a data processing pipeline for standardizing, structuring, and visualizing problems and findings documented in clinical reports associated with neuro-oncology patients. Given a list of problems and findings identified using a natural language processing (NLP) system, we have created a mapping tool that assigns an observation of a problem to one of nine classes that describe change. The second tool utilizes iconic representations of the nine classes to generate a timeline interface, enabling users to pan, zoom, and filter the data. The result of this preliminary work is an automated approach for understanding and summarizing the evolution of a problem within the patient electronic medical record.
Introduction
Time is an important notion in medicine; much of the medical data collected during clinical care are time-stamped, and patient documents are typically reviewed chronologically. However, given the large amounts of data being generated, following how problems advance during a patient’s treatment becomes increasingly time-consuming and obscured. Having tools to automatically summarize trends and relationships for reported medical problems from past clinical reports would assist practitioners with understanding the interplay between interventions and reported problems.
We explore the creation of software tools that address two challenges: 1) how to automatically characterize change in a problem at each observation; and 2) how to graphically represent this characterization so that trends can be readily interpreted visually. To address these issues, we first developed a mapping tool that helps users: 1) validate problems, findings, and attributes extracted using a natural language processing (NLP) tool; 2) automatically map each problem to a class that describes the change in a problem when compared to the previous observation (of the same problem); and 3) assign classes to iconic graphical representations. We then implemented a user interface that allows users to: 1) select which medical problems are presented on the display; 2) view every observation for the selected problems plotted on a timeline; 3) zoom, pan, and filter observations by source (e.g., radiology report), severity (e.g., significantly worse), and temporal attributes; and 4) review the details and underlying clinical data when specific observations are selected.
Background
While approaches for dealing with time-related concepts have been widely explored, particularly with structured medical data (e.g., numerical laboratory data [1–2]), researchers have only recently examined trends in unstructured clinical reports [3]. Recent efforts have automated the discovery of temporal patterns by: structuring the data using NLP [4]; abstracting events and patterns from the structured data [5]; and encoding the event sequences using a temporal representation (e.g., TimeML) [6]. The goal is to leverage NLP to automatically enumerate states of attributes (e.g., size, location) at each time point associated with a problem (e.g., tumor). Change could then be characterized by events that alter the states of these attributes over the course of multiple time points [7]. An ongoing challenge, however, is being able to automatically interpret the temporal order of events from free-text; this challenge is not directly addressed here but is part of our ongoing effort to create a robust structuring tool.
Time-oriented information has traditionally been presented using a timeline to show the temporal distribution of observations in relation to one another [8] or to some sentinel event [9]. To extend the timeline metaphor, several works have incorporated other visual properties such as color and height to convey additional information (e.g., severity, abnormality) about the patient’s condition [10]. Other works have examined how to quantify and visualize change in imaging data: LesionViewer [11] visually summarizes changes in tumor size across multiple imaging studies.
Our goal is to create an automated processing pipeline that characterizes and visualizes medical problems along the dimensions of time, space (location), existence, and causality. Building upon our work reported in [12], this paper represents initial efforts to create a more granular characterization of change in neuro-oncology patients.
Methods
With prior institutional review board approval, we created a set of 20 de-identified neuro-oncology patient cases previously seen at UCLA Medical Center. The dataset contains a total of 717 documents capturing events from date of diagnosis to death; we divided the cases into 10 training and 10 testing cases. After manually reviewing the training cases, we decided to target problems and findings mentioned in admission, inpatient, and discharge summaries, (outpatient) neuro-oncology notes, and radiology reports as they contained the majority of documented observations, which have assessments of change.
Extraction of Findings
A semi-automated toolkit for standardizing, extracting, and structuring problems and findings from clinical reports is being developed concurrently [13]. The toolkit: 1) identifies spatially where the problem is anatomically located; 2) resolves intra- and inter-document co-reference; 3) characterizes finding attributes; and 4) defines existence attributes for each observation of a problem. Considering the sentence, “since the prior examination, there has been a decrease in the transverse diameter of the heterogeneously enhancing tumor,” the generated attributes and values are:
Location
Anatomical (spatial) location describes the affected regions of the body; signs and symptoms can be inferred from this information based on the effect of the problem on surrounding structures. The toolkit extracts two attributes: location (e.g., brain) and spatial relation (e.g., involving).
Existence
Existence indicates whether a problem is observed at a point in time. Our toolkit characterizes existence using multiple attributes, as listed in Table 1. Existence attributes for the example sentence include: “certainty” is “definite”; “relevancy” is “significant”; “newness” is “not stated”; and “multiplicity” is “not stated”.
Table 1:
Attributes and possible values for existence and findings that are identified by the structuring tool for each problem.
| Existence Attributes | |
| Certainty | Definite, appears to be, less likely, unlikely, does not exist |
| How determined | Observation, inference |
| Multiplicity | Single, a few, multiple, not stated |
| Newness | Previously seen, newly diagnosed, recurrent, resolved, not stated |
| Relevancy | Significant, incidental, not stated |
| Study quality | Okay, poor |
| Visibility | Clearly seen, appears, difficult |
| Finding Attributes | |
| Presence | Yes, no, not stated |
| Severity | None, mild, moderate, severe, not stated |
| Change | Improved, worsened, increased, decreased, stable, not stated |
| Degree | Slightly, significantly, not stated |
Finding
A finding represents anything observable about a problem. The structuring tool utilizes a data model built for the domain of neuro-oncology to guide the identification of pertinent findings, attributes, and values. The initial set of targeted findings was defined based on input from a neuro-oncologist. Attributes for the example sentence include: “size change” is “decreasing”; “contrast enhancement” is “present”; and “solid contrast” is “heterogeneous”.
The output of the structuring tool is a frame representation encoded in eXtensible Markup Language (XML); the output is used as input by the mapping and visualization tools.
Mapping and Interpretation
We have created a mapping tool that: 1) provides a user interface to view and validate how problems and findings are extracted by the NLP structuring tool; 2) utilizes contextual rules to identify when changes occur in the data and assign descriptive labels for categorizing how problems change; and 3) associates labels with user-defined iconic representations that is used to summarize the label graphically.
Requirements analysis
Problems typically have a starting state (new, recurrent, existing), stopping state (resolved, not present), and intermediate states (improving, worsening, unchanged, not stated). The labels (classes) are summarized in Table 2. These labels are derived based on a combination of domain expert input and manual examination of the training records. Some label assignments can be made explicitly: the sentence, “the patient’s hydrocephalus has worsened,” can be directly mapped to the class “worsening”. However, most assignments require the incorporation of some contextual information. In the sentence, “hydrocephalus has decreased,” domain knowledge is needed to understand that a decrease in hydrocephalus implies reduced swelling of the ventricles and hence, an improvement. In addition, a single observation may be insufficient to perform an assignment. For example, one report may describe “severe hydrocephalus” followed by another report stating “moderate hydrocephalus.” A rule can be defined to interpret the change from severe to moderate as being an improvement in the context of hydrocephalus. Additionally, values may be expressed in multiple ways: mass effect can be described using terms such as “more”, “mild”, “minimal”, “reduced”, “stable”, or “not significant”. Finally, words such as “slightly”, “significantly”, and “much” provide information about the degree of change.
Table 2:
A listing of the possible classes and assigned icons that are used to label observations.
| Class | Description | |
|---|---|---|
| Existing |  |
Assigned to problems that are known to have existed prior to the start of available documentation. |
| Improving |  |
Given to a problem that has changed for the better based on context. # of arrows denote greater improvement. |
| New |  |
Assigned to the first mention of a problem that has never previously been observed. |
| Not stated |  |
Given to problems that are not described in a report. |
| Recurrent |  |
Given to the first mention of a problem that has already been observed and resolved in the past. |
| Resolved |  |
Assigned to problems that have been mentioned in the past but explicitly observed to be not present or resolved in the current report. |
| Unassigned |  |
Given to a problem that is mentioned but does not contain sufficient context to make a class assignment. |
| Unchanged |  |
Assigned to a problem that has remained in the same state as the last observation. |
| Worsening | 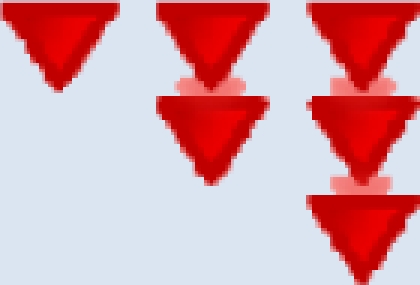 |
Given to a problem that has changed for the worse based on context. # of arrows denote greater decline. |
Design and implementation
The initial task is to supplement the existing neuro-oncology data model (developed as part of the structuring tool) to include a mapping between possible values for attributes such as severity, change, and degree for each problem (e.g., increasing hydrocephalus) and the predefined classes (e.g., worsening). This expanded model is then used as the contextual knowledge base. A set of rules categorizing each observation into one of nine classes (Table 2) can be generalized as follows:
▪ If value for change is stated as worsening, improving, or stable, map to the respective classes;
▪ If value for change is stated as either increasing or decreasing, use the contextual knowledge base to determine which class to assign;
▪ If a value for degree or severity is provided (e.g., significant, moderate), annotate the assigned class with this value;
▪ If value for change is not stated but a value for degree or severity is, compare the value with the previous time point to make a mapping;
▪ Based on values for newness and certainty, assign whether the problem is existing, new, not present, recurrent, or resolved; and
▪ For all other problems that do not meet the aforementioned rules, map to the unassigned class.
The aforementioned rules are implemented as regular expressions. We also incorporate negation detection using NegEx [14] for two reasons: 1) sentences in which the finding is negated (e.g., hydrocephalus is not present) should be assigned to the class “not present” and 2) sentences in which change has been negated (e.g., has not improved) should be labeled as “unchanged.”
Rather than present a list of textual labels for each observation, labels are represented as icons to visually convey the information. In our prototype, we represent “improving” as a green arrow pointing upwards and “worsening” as a red arrow pointing downwards. Degree or severity information, if available, is used to annotate the icon: for problems that are moderately or significantly different between two time points, two or three arrows are shown in place of a single arrow. Problems observed as “unchanged” are denoted as gray circles with a text label stating “No Δ”. “Resolved” and “not present” classes are represented as green icons. When a problem is not explicitly mentioned, a graphical representation is not assigned to that observation. If a problem is unassigned, it is represented as a white circle. Users can customize how each label is graphically represented.
Integration and Visualization
The objective of the visualization tool is to provide: 1) an integrative, temporal view that summarizes changes in problems across available observations; and 2) the supporting tools to navigate and query this data.
Requirements analysis
Two physicians, an oncologist and a radiologist, defined a set of desired features for the user interface. Based on their initial feedback, we determined that the primary functionality should include: 1) showing the temporal distribution of problems; 2) visualizing how problems change in the course of the entire patient record; and 3) providing the ability to overlay other data such as significant events (e.g., surgery), imaging studies (e.g., magnetic resonance imaging, computed tomography), and treatments (e.g., medications) on the display.
Design and implementation
The user interface is shown in Fig. 1. The interface consists of four components: a master problem list, a query panel, a timeline, and a detail panel. The master problem list (Fig. 1a) serves as the primary method of navigating the patient record: users select which problems to display in the timeline. The query panel (Fig. 1b) provides additional options for customizing the display. The timeline (Fig. 1c) visually summarizes each observation and any changes in comparison to previous observations. Additional timelines can be added to present other treatment information (e.g., medication dosages, durations), facilitating visual comparison between problems and interventions. The detail panel (Fig. 1d) provides a view of the raw data. Users can select a specific time point when a problem is observed: along with the selected time point, the detail panel shows NLP-extracted information in a table for observations immediately preceding and following the selected time point. Key image slices identified from the imaging study are also displayed alongside the extracted attributes.
Figure 1:

A screen capture of the temporal visualization, which consists of four components: (a) the master problem list; (b) the querying panel; (c) the timeline and (d) the detail panel.
Results
We first used the structuring tool to identify all problems and findings in the ten test cases. Accuracy and completeness of identifying problems and findings are being evaluated as part of the structuring tool; for the purposes of our evaluation, we assume that the output of the structuring tool is the gold standard. We then used the mapping tool to automatically assign each observation to a class. Combined, the ten patient cases had 1,960 observations; our approach assigned 965 of the observations (49.2%) to a class other than “unassigned”. We found that observations were labeled as “unassigned” for primarily two reasons: 1) it did not contain any attributes that could be used to assess change: for instance, the phrase, “the patient has a clinical history of glioblastoma multiforme” notes the presence of the tumor but provides no information about how it has changed (920 instances, 95%); or 2) change could not be interpreted based on the available attributes: for example, a change in “midline shift direction” would be difficult to label as either improving or worsening (40 instances, 4%). Examining the 965 labeled observations, we determined that 921 (95.4%) were labeled appropriately. Observations were given incorrect labels due to difficulty in differentiating among new, recurrent, existing, and resolved problems. Currently, the system solely relies on the sentence in which a problem is mentioned to obtain context: one approach would be to expand the window of sentences that are examined to neighbors.
A version of the visualization tool was demonstrated at the Radiological Society of North America (RSNA) 2009 scientific meeting as an interactive informatics education exhibit. Feedback was informally solicited from the attendees, recorded, and used to guide further revisions.
Discussion
In this paper, we present a tool that utilizes attributes and values characterized using a NLP-assisted structuring tool as context for determining which class related to change is assigned to each observation of the problem. Both tools are implemented in Java; the visualization tool incorporates a modified version of Jaret Timebars to render the timeline.
One challenge is to address the vagueness and inconsistency of how change is reported in clinical documents. Additional data sources such as quantitative imaging features (e.g., tumor size) may be utilized to supplement the text to label observations. This information would also be helpful in discerning the true state of observations that are currently unassigned. Another issue is being able to accommodate variations in how attributes are reported (e.g., “mild to moderate”) that are not explicitly encoded in the knowledge base. As a limitation of the rule-based approach, we are attempting to explore more sophisticated modeling techniques (e.g., hidden Markov models) that would enable training the model on available data to estimate probabilities for each class assignment. In this paper, we have addressed the task of characterizing change for individual problems. However, ultimately, we intend to address the broader problem of how multiple problems contribute to the overall status of a patient as part of future work. We also intend to perform a study of the interface using the multiple-reader multiple-case experimental design (MRMC) [15], which allows assessment and comparison of decision accuracy and latency time comparing our visualization with existing tools. Our framework is also generalizable to domains beyond neuro-oncology if a disease-specific ontology and appropriate logic for mapping feature states to change labels are provided.
Acknowledgments
The authors would like to thank Albert Chern and Drs. Corey Arnold, Alex Bui, Suzie El-Saden, and Hooshang Kangarloo for their thoughtful discussions. We would also like to acknowledge Dr. Timothy Cloughesy for providing access to the UCLA Neuro-oncology database. This research was supported by NLM R01-LM009961 and NIBIB R01-EB009306.
References
- [1].Shahar Y, Combi C. Timing is everything. Time-oriented clinical information systems. West J Med. 1998;168(2):105–13. [PMC free article] [PubMed] [Google Scholar]
- [2].Post AR, Harrison JH., Jr PROTEMPA: a method for specifying and identifying temporal sequences in retrospective data for patient selection. J Am Med Inform Assoc. 2007 Sep–Oct;14(5):674–83. doi: 10.1197/jamia.M2275. [DOI] [PMC free article] [PubMed] [Google Scholar]
- [3].Zhou L, Hripcsak G. Temporal reasoning with medical data—A review with emphasis on medical natural language processing. J Biomed Inform. 2007;40(2):183–202. doi: 10.1016/j.jbi.2006.12.009. [DOI] [PMC free article] [PubMed] [Google Scholar]
- [4].Augusto JC. Temporal reasoning for decision support in medicine. Artif Intell Med. 2005;33(1):1–24. doi: 10.1016/j.artmed.2004.07.006. [DOI] [PubMed] [Google Scholar]
- [5].Shahar Y, Musen M. Knowledge-based temporal abstraction in clinical domains. Artif Intell Med. 1996;8(3):267–98. doi: 10.1016/0933-3657(95)00036-4. [DOI] [PubMed] [Google Scholar]
- [6].Pani A, Bhattacharjee G. Temporal representation and reasoning in artificial intelligence: A review. Math Comput Model. 2001;34(1–2):55–80. [Google Scholar]
- [7].Allen J, Ferguson G. Actions and events in interval temporal logic. J Logic and Computation. 1994;4(5):531–79. [Google Scholar]
- [8].Plaisant C, Mushlin R, Snyder A, Li J, Heller D, Shneiderman B. LifeLines: using visualization to enhance navigation and analysis of patient records. Proc AMIA Symp. 1998:76–80. [PMC free article] [PubMed] [Google Scholar]
- [9].Wang T, Plaisant C, Quinn A, Stanchak R, Murphy S, Shneiderman B. Aligning temporal data by sentinel events: discovering patterns in electronic health records. Proceedings of the SIGCHI conference on Human factors in computing systems. 2008:457–66. [Google Scholar]
- [10].Bade R, Schlechtweg S, Miksch S. Connecting time-oriented data and information to a coherent interactive visualization. Proceedings of the SIGCHI conference on Human factors in computing systems. 2004:105–12. [Google Scholar]
- [11].Levy MA, Garg A, Tam A, Garten Y, Rubin DL. LesionViewer: A tool for tracking cancer lesions over time. AMIA Annu Symp Proc. 2007:443–7. [PMC free article] [PubMed] [Google Scholar]
- [12].Taira R, Bui A, Hsu W, Bashyam V, Dube S, Watt E, et al. A tool for improving the longitudinal imaging characterization for neurooncology cases. AMIA Annu Symp Proc. 2008:712–6. [PMC free article] [PubMed] [Google Scholar]
- [13].Taira RK, Bashyam V, Kangarloo H. A field theoretical approach to medical natural language processing. IEEE Trans Inf Technol Biomed. 2007 Jul;11(4):364–75. doi: 10.1109/titb.2006.884368. [DOI] [PubMed] [Google Scholar]
- [14].Chapman W, Bridewell W, Hanbury P, Cooper G, Buchanan B. A simple algorithm for identifying negated findings and diseases in discharge summaries. J Biomed Inform. 2001;34(5):301–10. doi: 10.1006/jbin.2001.1029. [DOI] [PubMed] [Google Scholar]
- [15].Pieczkiewicz D, Finkelstein S, Hertz M. Design and evaluation of a web-based interactive visualization system for lung transplant home monitoring data. AMIA Annu Symp Proc. 2007:598–602. [PMC free article] [PubMed] [Google Scholar]